Chop shop

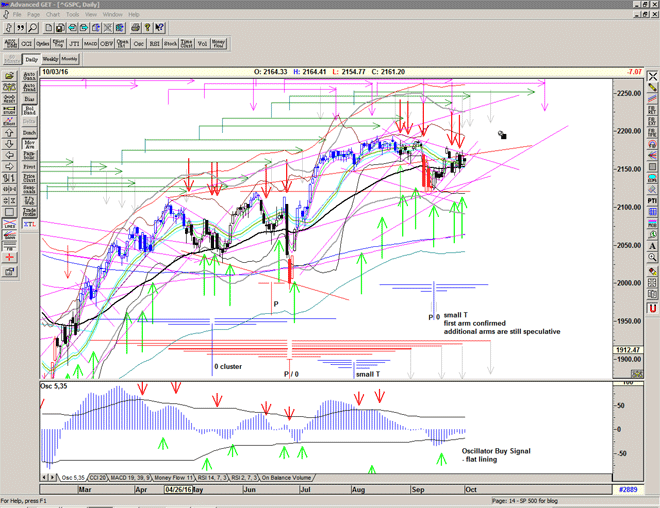
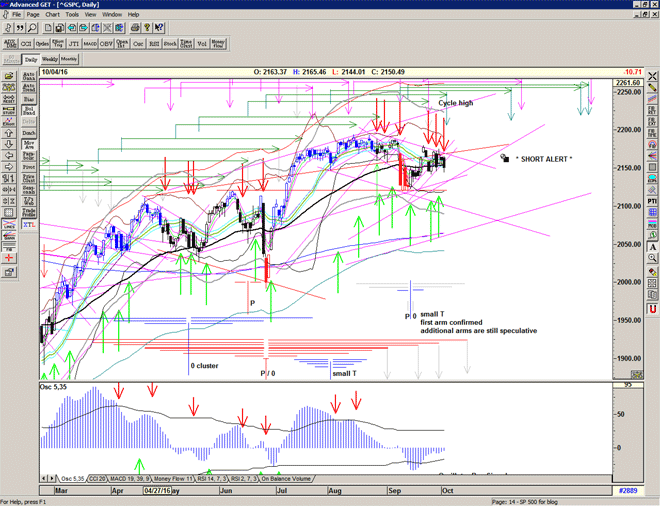
On a Sell Signal since yesterday afternoon's drop below 2154, but need to see some follow through as maybe the market will continue its seesaw chop up and down. As I have mentioned before, there are some strong (perhaps dark) forces at play keeping this market up.

Hopefully the end of the red T structure (Oct 17 or thereabouts) will provide some resolution to this malaise.
Untitled-2

For more detailed analysis, please Sign up for Alerts & Observations

Disclaimer: This is the diary of a personal trading system, its methodology and the signals that it is producing. You are welcome to follow along but please understand that the information presented here is for educational & entertainment purposes only. No recommendations are being made to buy, or sell stocks, options or futures contracts. Please consult your own financial advisor before making any investment decisions.


S/T Sell Signal at 2151

A Short Signal from 2151 occurring with the market dropping out of the recent triangle, and looking like its right on time with a cycle high scheduled for tomorrow, and the recent expiration of major arm of the red T structure.

Maybe targetting support lines at 2130 or 2120.

More tomorrow.

Maybe (a) stick up

Maybe stuck, or maybe a stick up.

Since mid June the market has essentially gone nowhere, in a series of flatlines separated by skids, or jolts, perhaps seizures..

is the patient still alive ?

and this triangle is running out of space,

Chart of S&P500 for 3 October 2016


For more detailed analysis, please Sign up for Alerts & Observations

Disclaimer: This is the diary of a personal trading system, its methodology and the signals that it is producing. You are welcome to follow along but please understand that the information presented here is for educational & entertainment purposes only. No recommendations are being made to buy, or sell stocks, options or futures contracts. Please consult your own financial advisor before making any investment decisions.


Triangle time

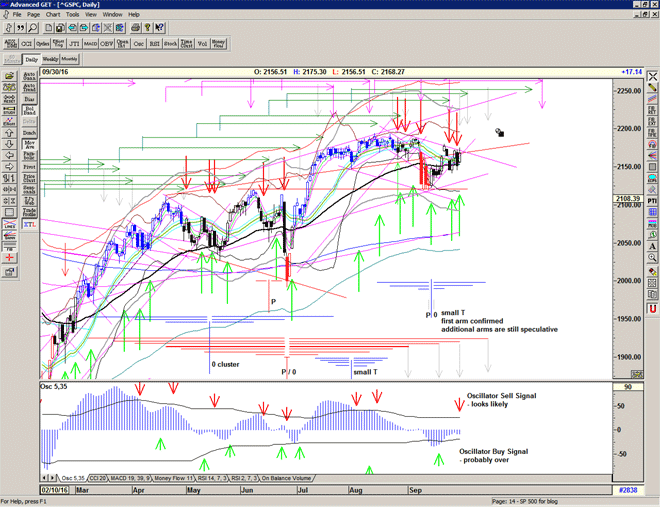
Triangle in play and hit expected resistance at 2172-5 with profit-taking.

Recovery of the T volume oscillator suggesting that there is the possibility of short-term strength into the early part of the week with another short-term high scheduled for October 4-5.

Choppy day-traders market likely to continue until direction resolved.

Chart of S&P500 for 01 October 2016

For more detailed analysis, please Sign up for Alerts & Observations

Disclaimer: This is the diary of a personal trading system, its methodology and the signals that it is producing. You are welcome to follow along but please understand that the information presented here is for educational & entertainment purposes only. No recommendations are being made to buy, or sell stocks, options or futures contracts. Please consult your own financial advisor before making any investment decisions.


S/T Buy Signal at 2163

Erratic market signals trouble ahead, but covered and back on a Buy Signal at 2163, expect short-term.

The erratic nature of the signalling is also 'telling' us something – and we should expect it to continue for the next few weeks. The market does not want to go down, there are significant forces at play keeping it up, but when the buying power dries up – albeit temporarily – as to be expected at the end of a major T structure, then the market will drop hard until the buyers are found at lower prices.

I think we are being warned that something unpleasant is about to occur.

Be prepared.

S/T Sell Signal at 2153

Short lived Buy signal again, market selling into rallies – covered and short from 2153.

An ugly triangle starting to appear indicative of a larger squeeze probable and as we are approaching the end-game of the large Red T structure it would make sense to expect the larger move to be 'down'. (perhaps after a short-lived pop to the upside.)

The erratic nature of the signalling is also 'telling' us something – and we should expect it to continue for the next few weeks. The market does not want to go down, there are significant forces at play keeping it up, but when the buying power dries up – albeit temporarily – as to be expected at the end of a major T structure, then the market will drop hard until the buyers are found at lower prices.

I think we are being warned that something unpleasant is about to occur.

Be prepared.

Chart of S&P500 for 30 September 2016

For more detailed analysis, please Sign up for Alerts & Observations

Disclaimer: This is the diary of a personal trading system, its methodology and the signals that it is producing. You are welcome to follow along but please understand that the information presented here is for educational & entertainment purposes only. No recommendations are being made to buy, or sell stocks, options or futures contracts. Please consult your own financial advisor before making any investment decisions.


Like a heart beat

World Heart Day – power your life

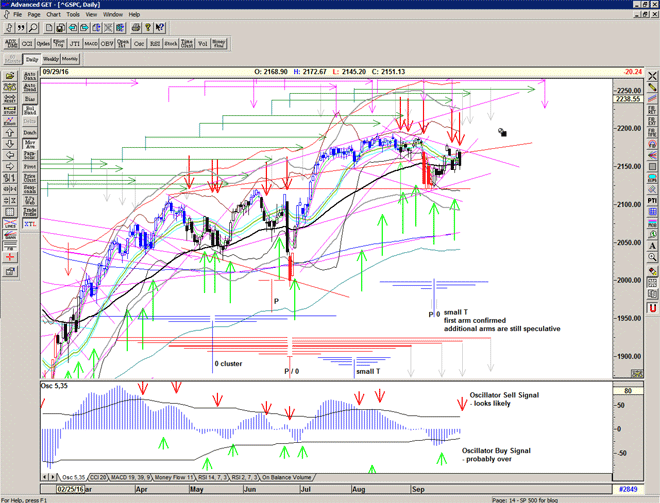
Pull-back and found 'support' at the 55 ema and push up above the mid-channel.

A general improvement all round and as the T volume oscillator turns positive it seems that the small T is more likely to play out now with a little bit of end of month bullishness and the new month's inflow of cash.

Chart of S&P500 for 29 September 2016

For more detailed analysis, please Sign up for Alerts & Observations

Disclaimer: This is the diary of a personal trading system, its methodology and the signals that it is producing. You are welcome to follow along but please understand that the information presented here is for educational & entertainment purposes only. No recommendations are being made to buy, or sell stocks, options or futures contracts. Please consult your own financial advisor before making any investment decisions.


S/T Buy Signal at 2160

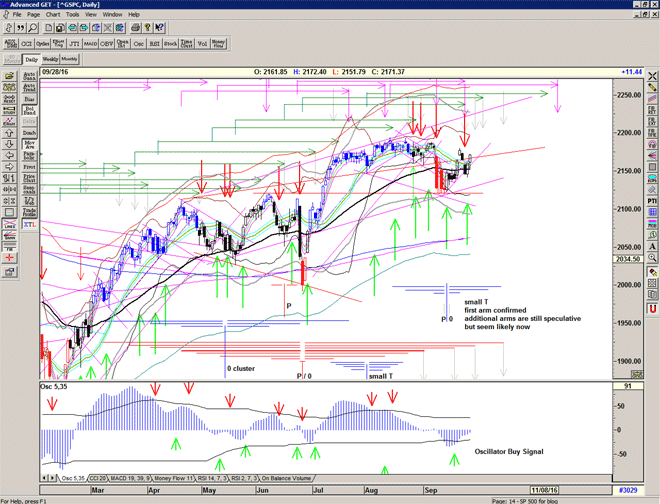
Speculative buying above 2152 and above the 55, cancelled out the Sell Signal for now.

If the market can hold above yesterday's low then we have the possibility of the small T pushing upwards into the next expected short term high – October 4-5

S/T Buy Signal at 2160 and above today.

Chart of S&P500 for 28 September 2016

For more detailed analysis, please Sign up for Alerts & Observations

Disclaimer: This is the diary of a personal trading system, its methodology and the signals that it is producing. You are welcome to follow along but please understand that the information presented here is for educational & entertainment purposes only. No recommendations are being made to buy, or sell stocks, options or futures contracts. Please consult your own financial advisor before making any investment decisions.


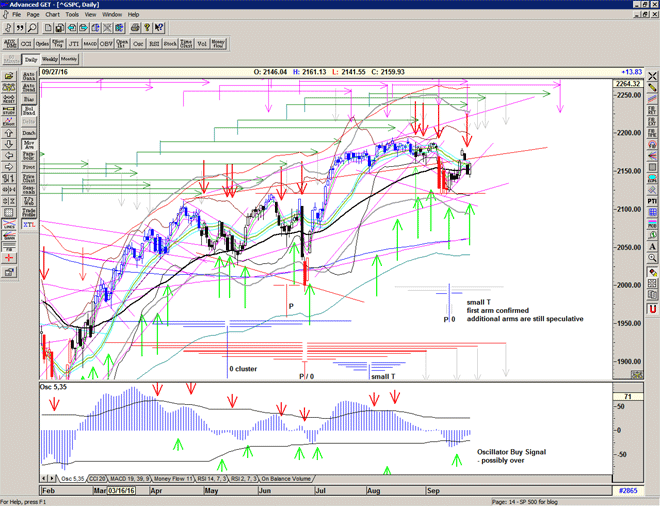
S/T Sell Signal at 2150

Looks like the short term cycle highs expected for today came in a couple days early this time.

Failure of the bounce at 2150 indicative of the general weakness apparent in the market, and now looking for another leg down.

Back on a * Short Alert *

Chart of S&P500 for 27 September 2016

For more detailed analysis, please Sign up for Alerts & Observations

Disclaimer: This is the diary of a personal trading system, its methodology and the signals that it is producing. You are welcome to follow along but please understand that the information presented here is for educational & entertainment purposes only. No recommendations are being made to buy, or sell stocks, options or futures contracts. Please consult your own financial advisor before making any investment decisions.


Trading the Line Free Report

2 weeks after the September 9 plunge, I thought it would be interesting to re-cap.

Chart of S&P500 for 25 September 2016

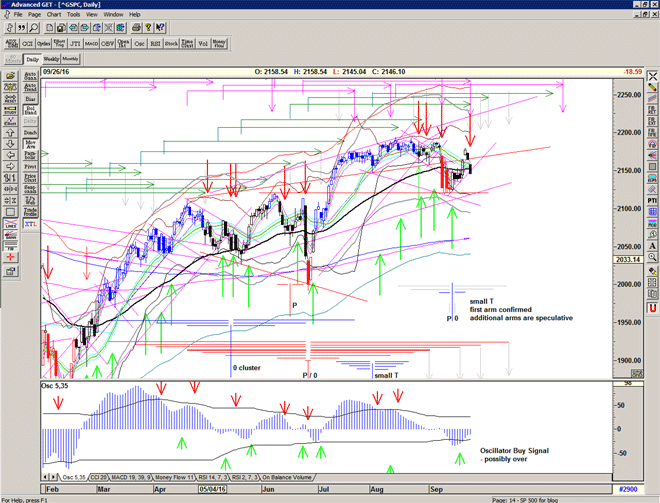
The market made a series of lows at an obvious support level – the 2015 high – and then made a tentative buy signal prior to the recent Fed statement. A small T was formed and confirmed by the oscillator and we are now back filling the gap.

The small T 'conveniently' projects a peak at the same time as the large Red T structure – on about October 17. (Not necessarily a new high.)

Unfortunately, 2 short-term cycle highs are scheduled for tomorrow (+/- 2 days), and this coincides with the first arm of the current small T structure.

It is possible that the recent small T has a centre 1 or 2 days earlier due to the discrepancy between the price and the oscillator lows – therefore thursday's peak at 2180 might be an important one.

Keep an eye on the rising support lines from the February and June lows for confirmation of the trend.

Be prepared.

For more detailed analysis and ongoing analysis of the developments in the S&P index on a daily basis, please Sign up for my daily Alerts & Observations