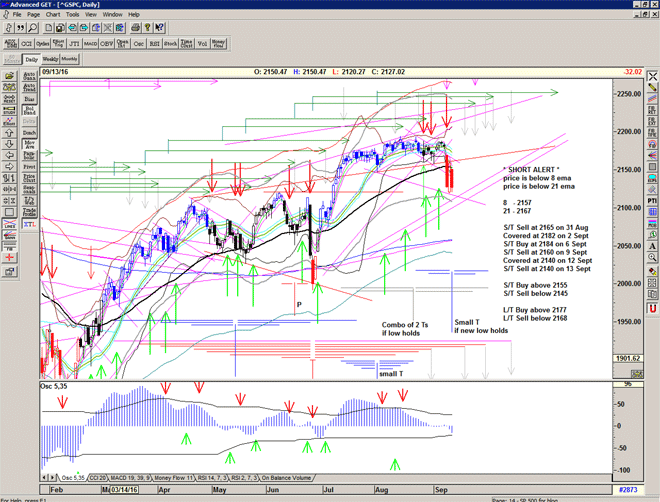
Pop and drop

Look no hands and swerve.

But closed thursday's gap.

T volume oscillator back below zero – potentially a warning… so we need to see a recovery soon.

First arm of small T and another cycle high scheduled for monday…
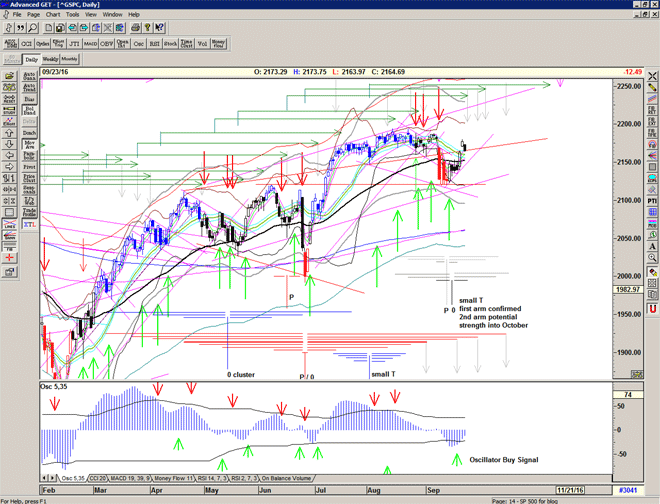
Chart of S&P500 for 26 September 2016

For more detailed analysis, please Sign up for Alerts & Observations

Disclaimer: This is the diary of a personal trading system, its methodology and the signals that it is producing. You are welcome to follow along but please understand that the information presented here is for educational & entertainment purposes only. No recommendations are being made to buy, or sell stocks, options or futures contracts. Please consult your own financial advisor before making any investment decisions.


Gap and Fill

An interesting gap and fill of the September 9 plunge – look no hands on the wheel again…

T volume oscillator turns positive and confirms the small gray T with potential strength into a mid October high corresponding with the red T structure

Chart of S&P500 for 23 September 2016

For more detailed analysis, please Sign up for Alerts & Observations

Disclaimer: This is the diary of a personal trading system, its methodology and the signals that it is producing. You are welcome to follow along but please understand that the information presented here is for educational & entertainment purposes only. No recommendations are being made to buy, or sell stocks, options or futures contracts. Please consult your own financial advisor before making any investment decisions.

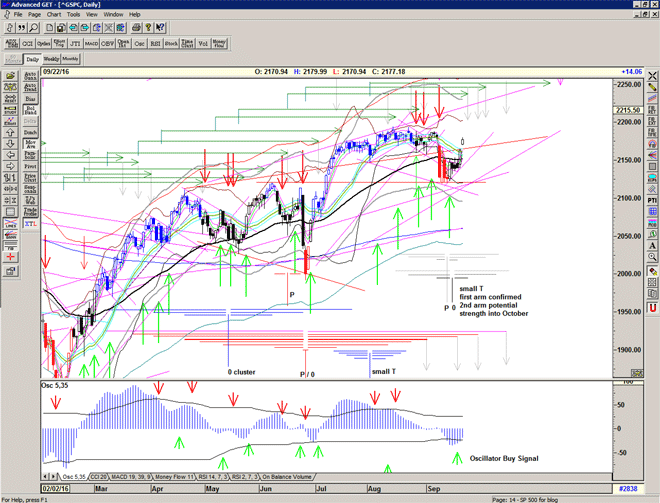
Fed up with waiting

Market held support at 2140 in preparation for the Fed and the Buy Signal from earlier in the week confirmed by price move above 2152 and by the OSC 5,35 and T volume oscillators.
Now watch out for any breach of the underlying rising Gann line to cancel this signal, otherwise the market is now signalling strength into 26 september for a short-term cycle high.

First arm of the small grey T structure now active, also into September 26.

Chart of S&P500 for 22 September 2016

For more detailed analysis, please Sign up for Alerts & Observations

Disclaimer: This is the diary of a personal trading system, its methodology and the signals that it is producing. You are welcome to follow along but please understand that the information presented here is for educational & entertainment purposes only. No recommendations are being made to buy, or sell stocks, options or futures contracts. Please consult your own financial advisor before making any investment decisions.


Fall Equinox

[Neo sees a black cat walk by them, and then a similar black cat walk by them just like the first one]
Neo: Whoa. Déjà vu.
[Everyone freezes right in their tracks]
Trinity: What did you just say?
Neo: Nothing. Just had a little déjà vu.
Trinity: What did you see?
Cypher: What happened?
Neo: A black cat went past us, and then another that looked just like it.
Trinity: How much like it? Was it the same cat?
Neo: It might have been. I'm not sure.
Morpheus: Switch! Apoc!
Neo: What is it?
Trinity: A déjà vu is usually a glitch in the Matrix. It happens when they change something.

– The Matrix (1999)

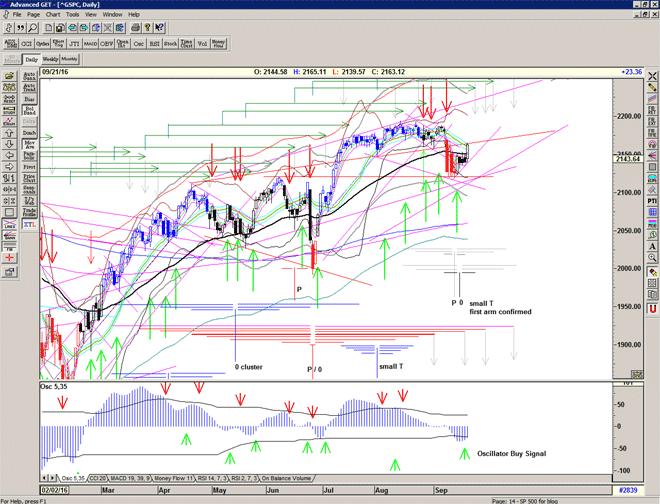
A Déjà vu day whilst waiting for the central bankers to juice the system.

Not quite hitting a Sell Signal but still on a 'Short Alert'.

OSC recovering and potentially making a Buy Signal.

Chart of S&P500 for 21 September 2016

For more detailed analysis, please Sign up for Alerts & Observations

Disclaimer: This is the diary of a personal trading system, its methodology and the signals that it is producing. You are welcome to follow along but please understand that the information presented here is for educational & entertainment purposes only. No recommendations are being made to buy, or sell stocks, options or futures contracts. Please consult your own financial advisor before making any investment decisions.


Fading away

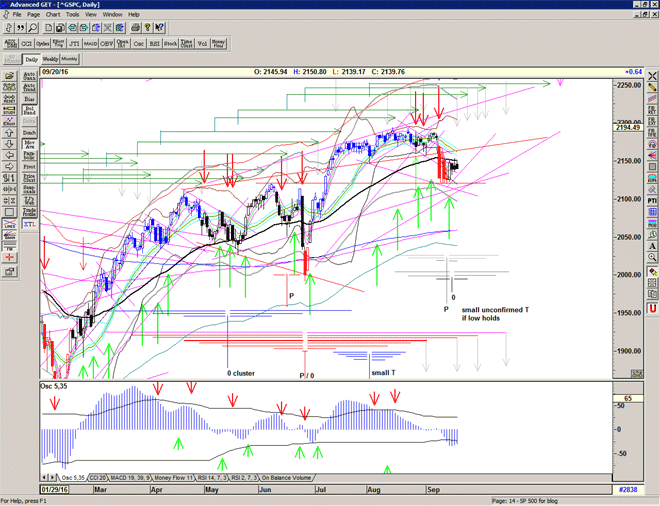
Market failed yet again at the 55 and continuous its 'bearish' behaviour, still indicative of a distribution going on under the surface.

Not quite hitting a Sell Signal, but still on a 'Short Alert'

Another major arm of the red T expires today and so the choppy time could be over.
Do we need another leg down or is it time for a recovery into October?

Chart of S&P500 for 20 September 2016

For more detailed analysis, please Sign up for Alerts & Observations

Disclaimer: This is the diary of a personal trading system, its methodology and the signals that it is producing. You are welcome to follow along but please understand that the information presented here is for educational & entertainment purposes only. No recommendations are being made to buy, or sell stocks, options or futures contracts. Please consult your own financial advisor before making any investment decisions.


Crapshoot

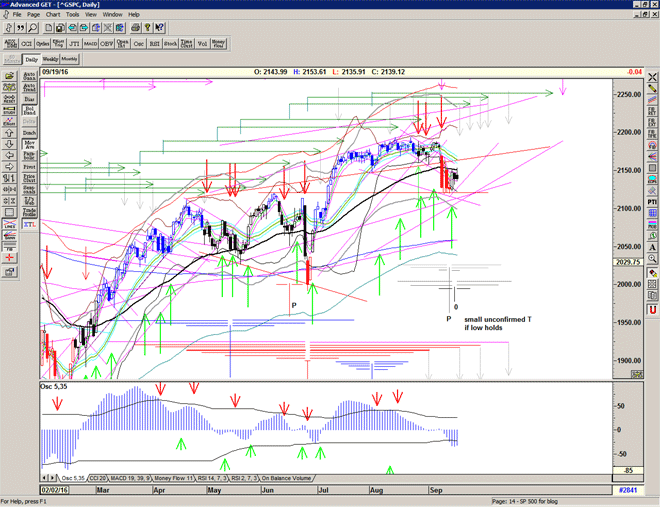
Expiration day selling contained successfully and held up into the close above important 2138 level, but note that the oscillator is still dropping.

Although the recent Buy Signal remains questionable, strength above 2152 would give it some credence as we approach another arm of the red T and then a cycle high scheduled for next monday.

However the prescence of the recent 'railroad tracks' indicates the possibility for a steep 'waterfall' sell-off (-100 points or so) if a catalyst appears during the next few days…

Chart of S&P500 for 19 September 2016

For more detailed analysis, please Sign up for Alerts & Observations

Disclaimer: This is the diary of a personal trading system, its methodology and the signals that it is producing. You are welcome to follow along but please understand that the information presented here is for educational & entertainment purposes only. No recommendations are being made to buy, or sell stocks, options or futures contracts. Please consult your own financial advisor before making any investment decisions.


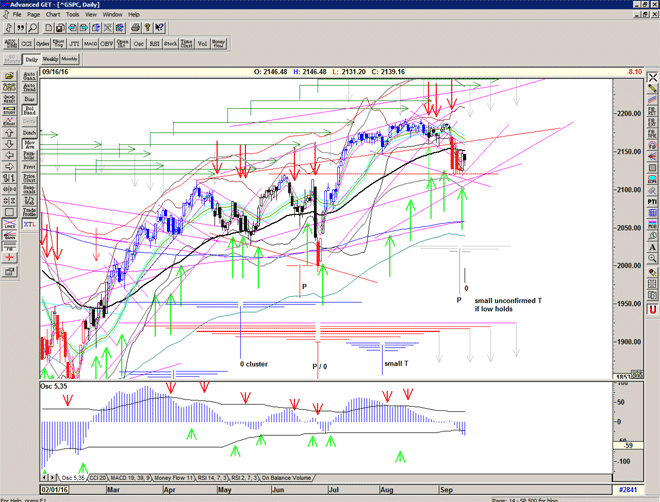
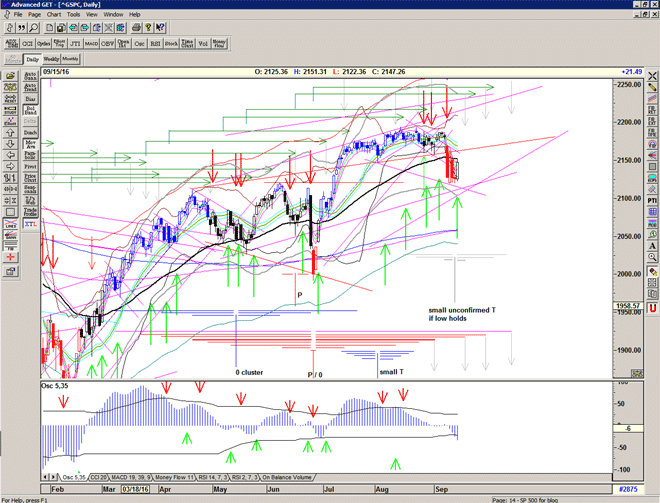
S/T Buy above 2147

Speculative Buying off the recent lows heads into resistance
S/T Buy signal confirmed (just) with the close above 2147 but needs strength above 2152 – the black line – to confirm the move is on.

And if the move is on, the small unconfirmed gray T with centre at 14 September points to next potential short-term high – 20 September – and if we see further strength into early October.

Chart of S&P500 for 15 September 2016

For more detailed analysis, please Sign up for Alerts & Observations

Disclaimer: This is the diary of a personal trading system, its methodology and the signals that it is producing. You are welcome to follow along but please understand that the information presented here is for educational & entertainment purposes only. No recommendations are being made to buy, or sell stocks, options or futures contracts. Please consult your own financial advisor before making any investment decisions.


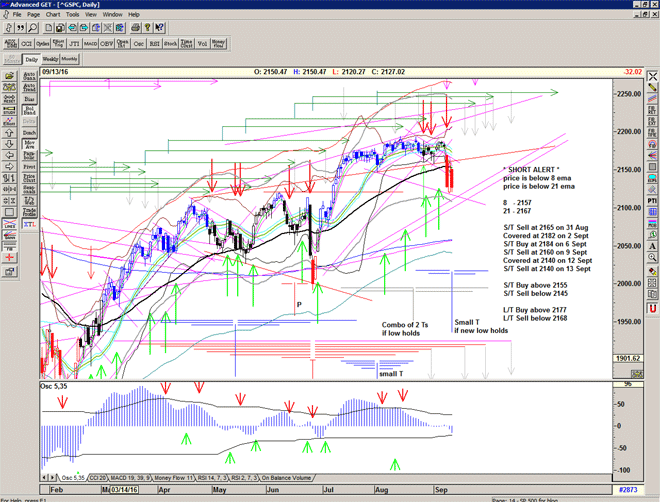
Waiting game

Still on a short alert, and eyeing up significant support just below – 2100 being a site of significant Put interest for tomorrow if the market doesn't rally into expiration, and 2150 and 2160 offering some resistance if the market does rally.

And another high ARMs reading…

Chart of S&P500 for September 15

For more detailed analysis, please Sign up for Alerts & Observations

Disclaimer: This is the diary of a personal trading system, its methodology and the signals that it is producing. You are welcome to follow along but please understand that the information presented here is for educational & entertainment purposes only. No recommendations are being made to buy, or sell stocks, options or futures contracts. Please consult your own financial advisor before making any investment decisions.


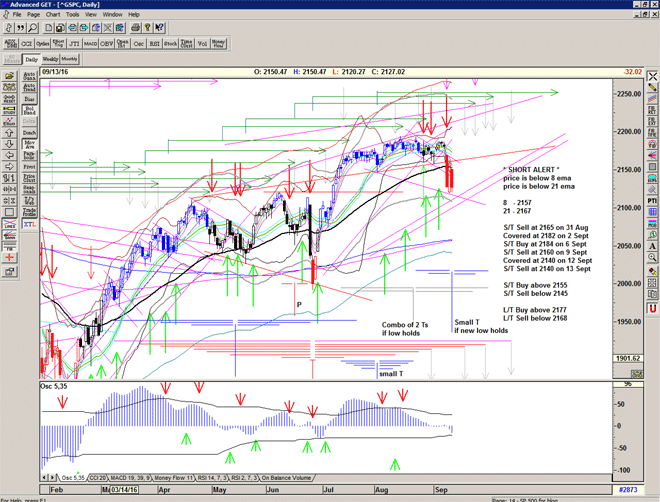
Arms over 2

Covered at 2125 in the expectation of a short-term bounce, and prepare for short covering rally into options expiration on Friday.

High ARMS and low NYMO readings suggest that we may have seen enough panic to turn the market around short-term.

Chart of S&P500 for 14 September 2016

For more detailed analysis, please Sign up for Alerts & Observations

Disclaimer: This is the diary of a personal trading system, its methodology and the signals that it is producing. You are welcome to follow along but please understand that the information presented here is for educational & entertainment purposes only. No recommendations are being made to buy, or sell stocks, options or futures contracts. Please consult your own financial advisor before making any investment decisions.