Cat’s paw

Nice bounce at horizontal support.
Covered at 2128, and speculative buying only above 2130.
Short signal still in place after breakdown through important rising lines but perhaps there is more in this bounce first, strong resistance at 2140 now.
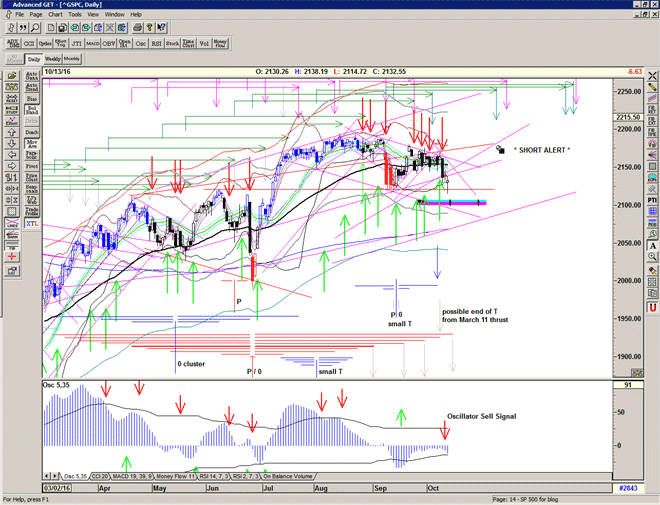
Chart of S&P500 for 14 October 2016

For more detailed analysis, please Sign up for Alerts & Observations

Disclaimer: This is the diary of a personal trading system, its methodology and the signals that it is producing. You are welcome to follow along but please understand that the information presented here is for educational & entertainment purposes only. No recommendations are being made to buy, or sell stocks, options or futures contracts. Please consult your own financial advisor before making any investment decisions.


Negatively charged

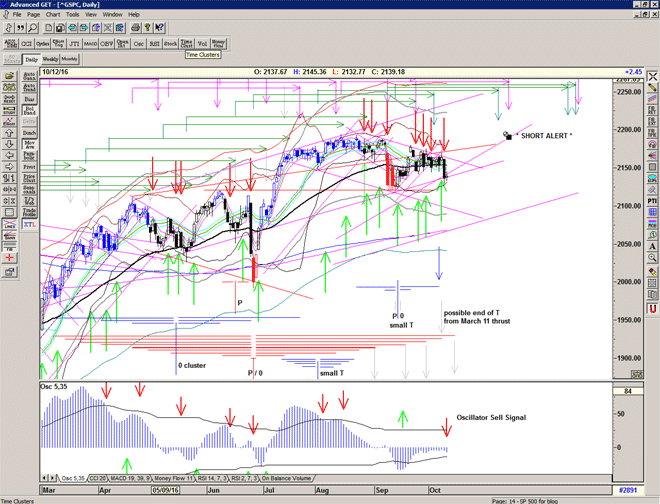
Support holding in the 2130s (for now) but everything looking rather negatively charged.
We are still within a triangular pattern, and if we can hold support here we could see a continuation of the recent choppy day-traders type action into the end date of the red T structure.

A break below the tightening bollingers (squeeze) and we may well be looking at 2070-80 in short order…

OSC oscillator makes a Sell signal.

Chart of S&P500 for 13 October 2016

For more detailed analysis, please Sign up for Alerts & Observations

Disclaimer: This is the diary of a personal trading system, its methodology and the signals that it is producing. You are welcome to follow along but please understand that the information presented here is for educational & entertainment purposes only. No recommendations are being made to buy, or sell stocks, options or futures contracts. Please consult your own financial advisor before making any investment decisions.


Deciding line

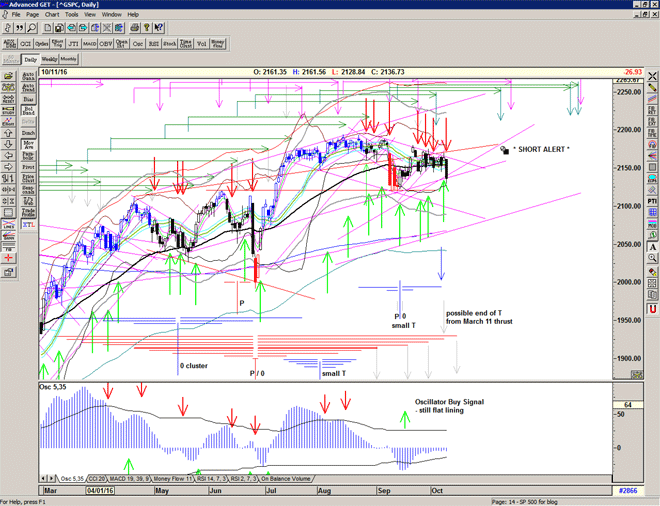
And finally some 'movement' and down to a strong ascending support line in the mid 2130s.
What happens here will be interesting because it is potentially a 'tipping' point for the market.

Note that there is a possible end date to the red T structure from the March 11 thrust because this is just above the 'Brexit' low.

Chart of S&P500 for 12 October 2016

For more detailed analysis, please Sign up for Alerts & Observations

Disclaimer: This is the diary of a personal trading system, its methodology and the signals that it is producing. You are welcome to follow along but please understand that the information presented here is for educational & entertainment purposes only. No recommendations are being made to buy, or sell stocks, options or futures contracts. Please consult your own financial advisor before making any investment decisions.


Short Term Buy above 2163 but still in triangle

Early bullish start to the day triggered a short-term Buy Signal but as we can see the consequent pullback remains consistent with the recent triangular and descending resistance.

Given the benefit of doubt due to the potentially bullish nature of the end arms of the large red T and recent small blue T, but looks like we may still be suffering from the see-saw day-trading environment.

Chart of S&P500 for 11 October 2016

For more detailed analysis, please Sign up for Alerts & Observations

Disclaimer: This is the diary of a personal trading system, its methodology and the signals that it is producing. You are welcome to follow along but please understand that the information presented here is for educational & entertainment purposes only. No recommendations are being made to buy, or sell stocks, options or futures contracts. Please consult your own financial advisor before making any investment decisions.


Blue Pill or Red Pill

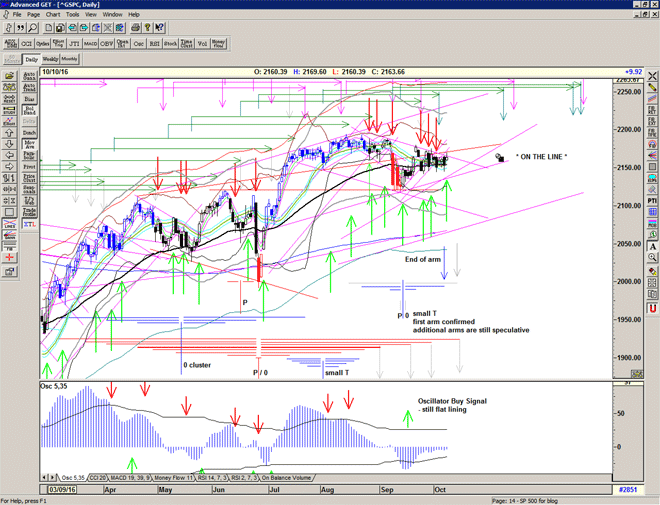
One week before the expiration of the large Red T structure formed at the 'Brexit' panic low the market appears to have 'stopped' and is effectively treading water waiting for some kind of catalyst.

Should we take the blue pill or the red pill – will the market Buy its way out of this stalemate or Sell off ?

Chart of S&P500 for 09 October 2016

What I believe is happening is that the downward force of the ending of the really long-range T structures – marked in pink and purple – are being counteracted by the upward force of the Red T structure.

The Red T structure is significant because it starts from an extreme high in the oscillator and is centred on an extreme low, similar to the main arm of the pink T structure.

As we can see the recent low formed a small T but the oscillator has failed (so far) to make any headway and the market has muddled along sideways. The downward sloping 'cash-build up' line marked in green remains unbroken and waiting to be used in the next T structure.

So what happens next? We 'should' see a push upwards into the final days of the Red T structure, followed by a distinct lack of buying power afterwards, ideally accompanied with some heavy selling and a low in the oscillator to form a new T structure, and hopefully a rally into Christmas after the Election is resolved.

Be prepared.

Wonderland

This is your last chance. After this, there is no turning back. You take the blue pill—the story ends, you wake up in your bed and believe whatever you want to believe. You take the red pill—you stay in Wonderland, and I show you how deep the rabbit hole goes. Remember: all I'm offering is the truth. Nothing more.

– The Matrix, Dir: The Wachowskis, 1999

Market still undecided, and not sure which pill to take.

Chart of S&P500 for 10 October 2016

For more detailed analysis, please Sign up for Alerts & Observations

Disclaimer: This is the diary of a personal trading system, its methodology and the signals that it is producing. You are welcome to follow along but please understand that the information presented here is for educational & entertainment purposes only. No recommendations are being made to buy, or sell stocks, options or futures contracts. Please consult your own financial advisor before making any investment decisions.


When the music’s over, turn out the lights

Come back, baby
Back into my arm
We're gettin' tired of hangin' around
Waitin' around with our heads to the ground

I hear a very gentle sound
Very near yet very far
Very soft, yeah, very clear
Come today, come today

– Jim Morrison, The Doors, 1967

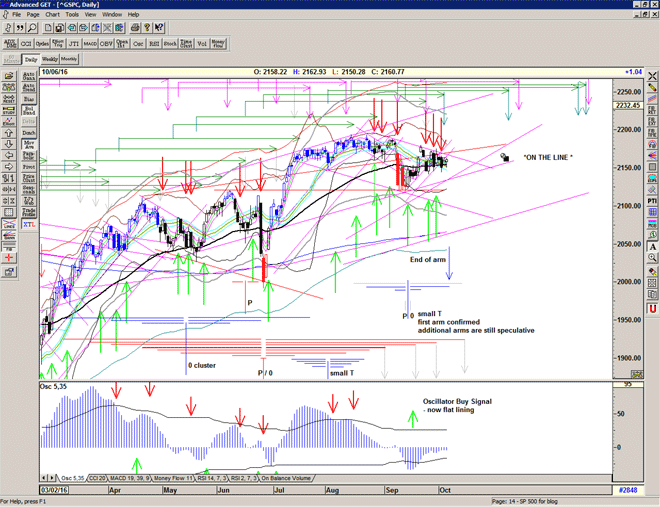
This morning I found myself humming 'When the music's over, turn out the lights…'

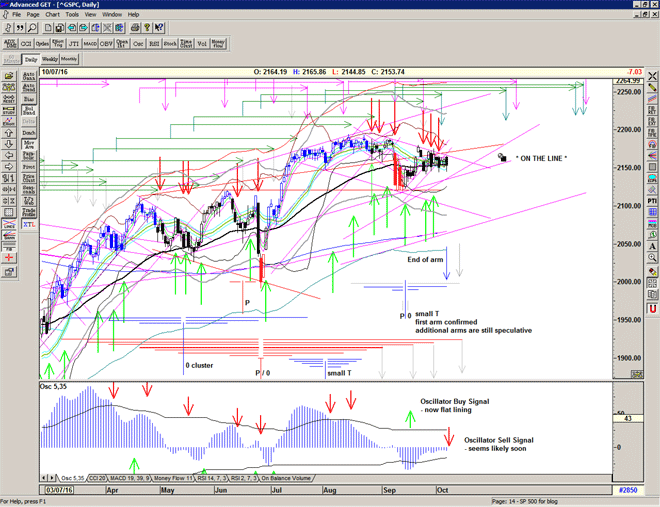
I'm starting to see this recent action (since mid July) as a large diamond or lozenge shape, a waiting game if you will.
The End of this tiresome movement (presumably of exhaustion) should therefore coincide with the expiration of the red T structure.

From a technical perspective, the market is right on the line

Chart of S&P500 for 7 October 2016

For more detailed analysis, please Sign up for Alerts & Observations

Disclaimer: This is the diary of a personal trading system, its methodology and the signals that it is producing. You are welcome to follow along but please understand that the information presented here is for educational & entertainment purposes only. No recommendations are being made to buy, or sell stocks, options or futures contracts. Please consult your own financial advisor before making any investment decisions.


More chop shop

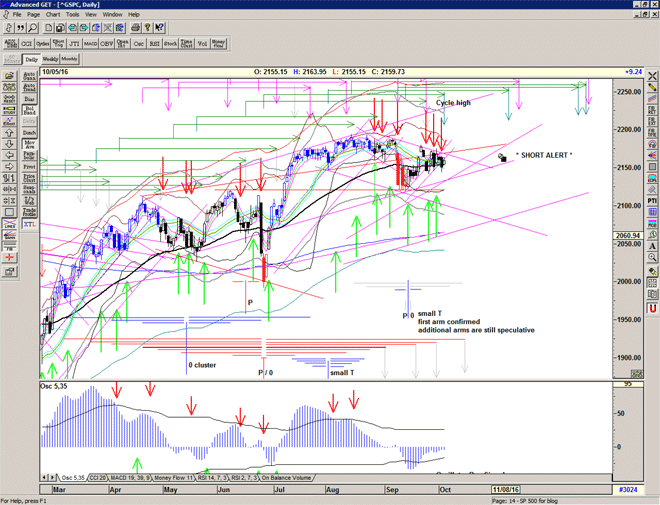
Choose your side of the fence and defend as appropriate. Grab a few points here and there.
Very close to a Buy signal yesterday but stayed short due to the tight triangulation and presence of a cycle high yesterday.

Still on a *Short Alert* and would require exit above the triangle to overide that.
Put / Call ratios signalling complacency associated with tops in markets.
Bollinger bands descending and tightening due to negatively shaped triangulation.

Chart of S&P500 for 6 October 2016

For more detailed analysis, please Sign up for Alerts & Observations

Disclaimer: This is the diary of a personal trading system, its methodology and the signals that it is producing. You are welcome to follow along but please understand that the information presented here is for educational & entertainment purposes only. No recommendations are being made to buy, or sell stocks, options or futures contracts. Please consult your own financial advisor before making any investment decisions.