Trump card

Nice very short term bounce but no Buy Signal (yet)

Friday's action was a great example of why the S/T Buy level is somewhat above the market during declines – and why I think at below that level the buying is very speculative and for aggressive traders only.

We can see that the market did not get above 2100 and resumed its selling into the close, indicating that the market has a 'Risk-Off' Attitude.

We are currently sitting at the 200 day moving average – the line in the sand – and 9 days down in a row.
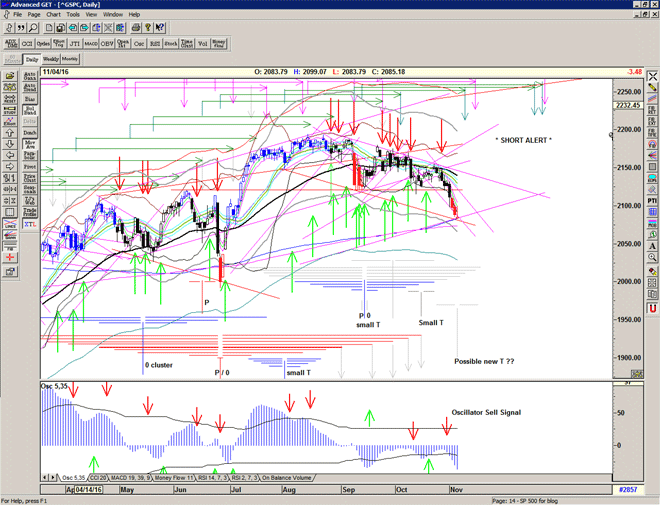
Chart of S&P500 for 07 November 2016

To receive further analysis and updated daily Buy / Sell levels being generated by the system before the market opens, please Sign up for Alerts & Observations

Disclaimer: This is the diary of a personal trading system, its methodology and the signals that it is producing. You are welcome to follow along but please understand that the information presented here is for educational & entertainment purposes only. No recommendations are being made to buy, or sell stocks, options or futures contracts. Please consult your own financial advisor before making any investment decisions.


Echo Low or Waterfall

The market has moved out of the stalemate associated with the end of the large pink T structure (pushing down) and the final weeks of the red 'Brexit' T structure (pushing up), and resolved to the downside.

I thought it would be interesting to look at the bigger picture and discuss 'double' bottoms.

Chart of S&P500 for 05 November 2016

Terry Laundry suggested that a double bottom resolves into one large T structure with the 2 major lows combining forces. We place the centre-post or vertical line of the T half-way between the 2 lows, and then draw the left-hand side of the T from the price peak to the centre-post, and this projects the end of the T.

We can see this clearly in the first double bottom of late August- September 2015.

Terry Laundry also pointed out that if you draw the T from the second low this will often project a price low instead of a peak – an Echo Low. (Marked in gray).

Moving on to the more recent 'double' bottom we have some complications. The oscillator shows that there is a cluster of 'lows' prior to the first price low and this is why I have drawn the major T structure in pink. However it is also possible to consider the T structure from a double bottom perspective and this projected to the early October breakdown in the market.

If we draw the T for the second low in gray we can see that at the end of the T the market was already moving downwards – into a low? And notice that the 2 previous arms of the gray T point to, or near to, lows

And so the question is: Are we entering an Echo Low or the beginning of a longer protracted decline?

If this is an Echo Low then we should see some stabilisation over the next few days, perhaps a panic low, in response to the Election and then a Buy Signal.

Of course nothing is ever certain, and there is a possible alternative view – that the Final price low in February 2016 is a single low not a double bottom, in which case we may be looking at longer bearish phase associated with the end of a major T structure.

This is why I use price to confirm the signals and not opinion. Price will get you into the market and ensure that you are not trading against it for very long.

Be prepared.

For more detailed analysis and ongoing analysis of the developments in the S&P500 index on a daily basis, please Sign up for daily Alerts & Observations


Gunpowder

“Remember remember the fifth of November
Gunpowder, treason and plot.
I see no reason why gunpowder, treason
Should ever be forgot…”

― Guy Fawkes

Lots of good reasons for a bounce here… , and a possible rally back into resistance, but a break lower is certainly possible.
And still plenty of time left for fireworks and depth charges associated with the election.

Significant risk indicated by SKEW

Chart of S&P500 for 04 Novemebr 2016

To receive further analysis and updated daily Buy / Sell levels being generated by the system before the market opens, please Sign up for Alerts & Observations

Disclaimer: This is the diary of a personal trading system, its methodology and the signals that it is producing. You are welcome to follow along but please understand that the information presented here is for educational & entertainment purposes only. No recommendations are being made to buy, or sell stocks, options or futures contracts. Please consult your own financial advisor before making any investment decisions.


Continuation of Selling

Today's intraday advice to subscribers:

After stabilising for the morning, the push lower thru 2195 has triggered a continuation with the selling.
The risk is that the market rapidly turns up now.
Target 2083.

Well, that was close enough for rock and roll, close.
If we don't bounce here we are going much lower.

Just because

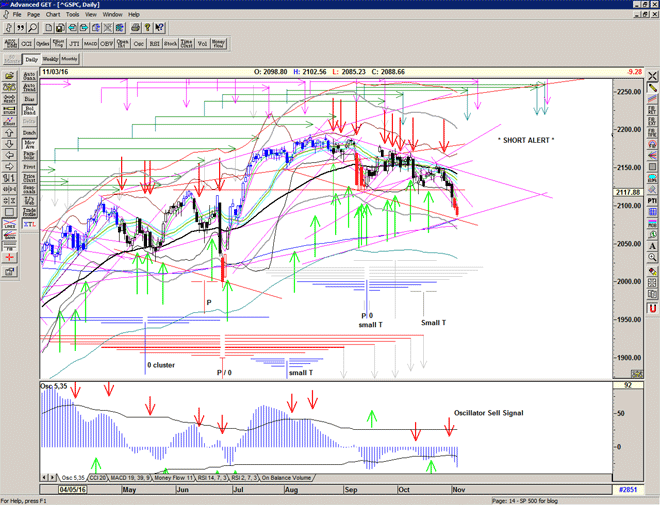
Continuation Sell Signal at 2107 yesterday with target of at least the prior low which was acheived.

The 2pm bounce prompted a cover signal (just in case), but the short term Sell Signal remains active.

The market is ready to bounce at a moments notice, with several indicators flashing green, but I still think we will touch the lower rising Gann line currently at 2083 sooner or later.

Moving into or towards a low…

Chart of S&P500 for 03 November 2016

To receive further analysis and updated daily Buy / Sell levels being generated by the system before the market opens, please Sign up for Alerts & Observations

Disclaimer: This is the diary of a personal trading system, its methodology and the signals that it is producing. You are welcome to follow along but please understand that the information presented here is for educational & entertainment purposes only. No recommendations are being made to buy, or sell stocks, options or futures contracts. Please consult your own financial advisor before making any investment decisions.


All Souls

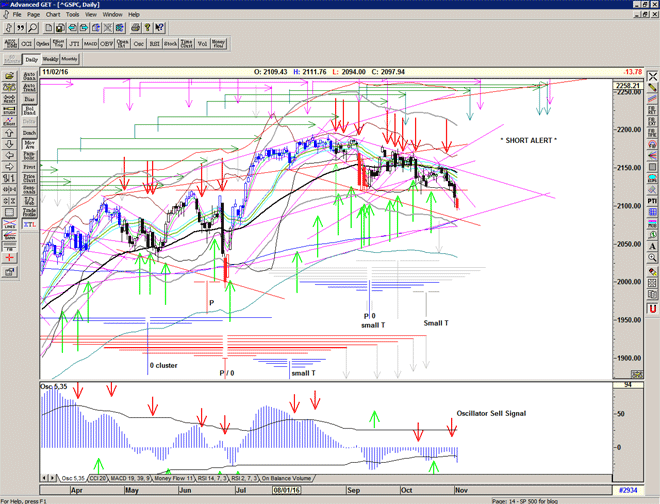
Market starting to factor in the possibility of a trump card next week, which is something I've been thinking might have been discounted (a bit like Brexit was). And that might really rattle the markets…

Anyway a short-term target was acheived with the trip down to 2100 and it was sensible place to take some profits.
I'm still eyeing 2180-85 for a more sustainable low and significant bull market support.

Chart of S&P500 for 02 November 2016

To receive further analysis and updated daily Buy / Sell levels being generated by the system before the market opens, please Sign up for Alerts & Observations

Disclaimer: This is the diary of a personal trading system, its methodology and the signals that it is producing. You are welcome to follow along but please understand that the information presented here is for educational & entertainment purposes only. No recommendations are being made to buy, or sell stocks, options or futures contracts. Please consult your own financial advisor before making any investment decisions.


All saints drift

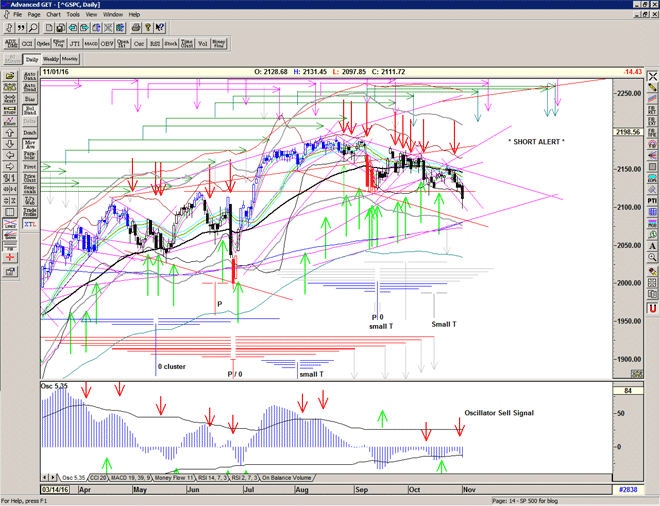
Not much trickery yesterday, but holding onto horizontal support as we drift sideways and downwards

Osc 5,35 oscillator turns negative, T volume oscillator rises slightly.

Still looking for a final low in this drift and thinking that we may need a visit to the lower rising Gann support line, currently in the 2080s.

Also noting that there are 2 cycle or pulse highs projected for approx 9 and 15 November.

Chart of S&P500 for 01 November 2016

To receive further analysis and updated daily Buy / Sell levels being generated by the system before the market opens, please Sign up for Alerts & Observations

Disclaimer: This is the diary of a personal trading system, its methodology and the signals that it is producing. You are welcome to follow along but please understand that the information presented here is for educational & entertainment purposes only. No recommendations are being made to buy, or sell stocks, options or futures contracts. Please consult your own financial advisor before making any investment decisions.


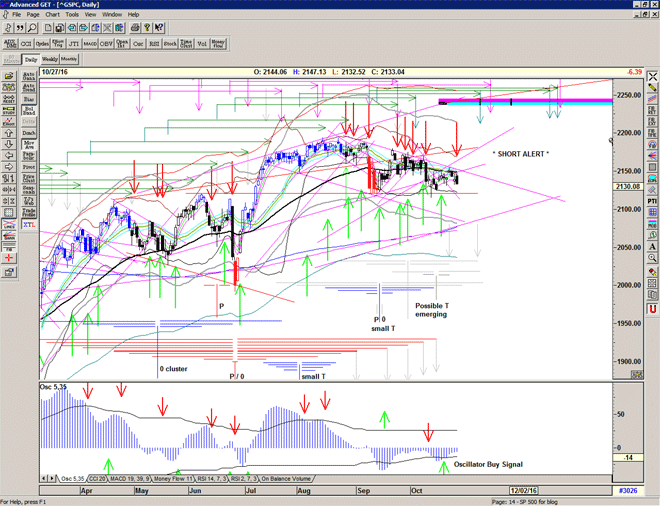
All Hallows’ Eve

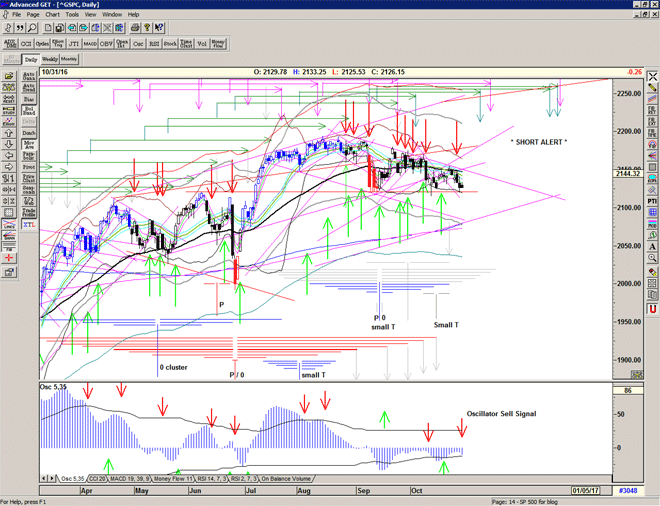
Market turns down into the end of last week, in-line with the T structure associated with the September 14 low which has a bearish formation of lower highs.

I'm assuming that the expiration of the larger red T structure associated with the Brexit low is pushing this one down and will do so until a clear 'low' is in place for a new T structure.

And now at a triple low, Does the market want to play Trick or Treat ?

Chart of S&P500 for 31 October 2016

To receive further analysis and updated daily Buy / Sell levels being generated by the system before the market opens, please Sign up for Alerts & Observations

Disclaimer: This is the diary of a personal trading system, its methodology and the signals that it is producing. You are welcome to follow along but please understand that the information presented here is for educational & entertainment purposes only. No recommendations are being made to buy, or sell stocks, options or futures contracts. Please consult your own financial advisor before making any investment decisions.


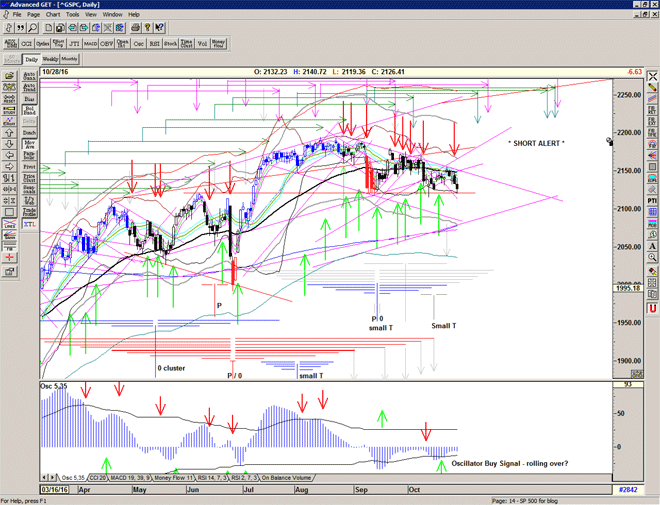
Tentatively short

Market possibly breaking down but wouldn't be surprised to see it it pop back up into the resistance line.

Market continuing to correct in time rather than price.

Looks like the real correction has been going on in long bonds.

Chart of S&P500 for 28 October 2016

To receive further analysis and updated daily Buy / Sell levels being generated by the system before the market opens, please Sign up for Alerts & Observations

Disclaimer: This is the diary of a personal trading system, its methodology and the signals that it is producing. You are welcome to follow along but please understand that the information presented here is for educational & entertainment purposes only. No recommendations are being made to buy, or sell stocks, options or futures contracts. Please consult your own financial advisor before making any investment decisions.