Great recovery

And a fantastic bounce at the breakout level of 2120.
Short positions no longer valid above 2140, and now of course looks like the market put in a low on Friday.

If Friday's low holds, then we can construct a small T structure marked in blue which projects strength into September 20 and 27.

However we are at an inflection point and need to see some confirmation of the recovery.
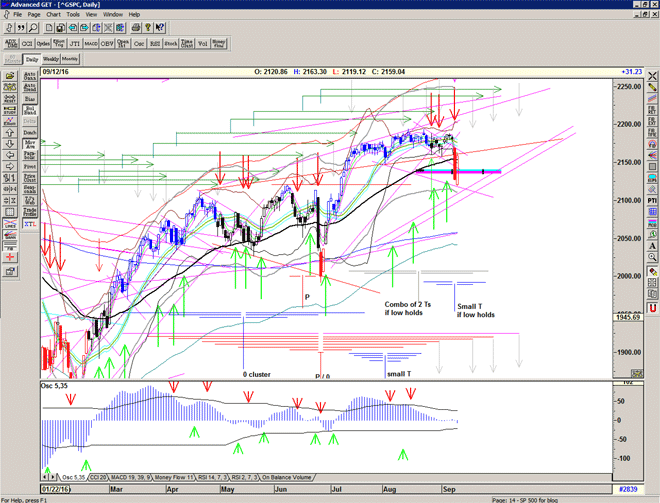
Chart of S&P500 for 13 September 2016

For more detailed analysis, please Sign up for Alerts & Observations

Disclaimer: This is the diary of a personal trading system, its methodology and the signals that it is producing. You are welcome to follow along but please understand that the information presented here is for educational & entertainment purposes only. No recommendations are being made to buy, or sell stocks, options or futures contracts. Please consult your own financial advisor before making any investment decisions.


Trading the Line Weekend Report – Something gives indeed

Although I have made my readers aware that an outsized move might be about to occur due to the repeated warnings from breadth, momentum, Arms, Put/Call ratios etc, the ferocity of Friday's move and the distinct lack of any buying power was interesting to me because it made me think I must have 'missed' something.

If you have been following my daily updates you will know that I was expecting a short-term high on about 31 August or 1 September to coincide with the major arm of the red T structure.

Something was holding up the market, and that something is often a longer range T structure.

And so back to the charts and zooming out:

Chart of S&P500 for 11 September 2016

What we can see is that the combination of 3 large T structures have been working together, to produce the recent rally into the mid July highs. And that there is, I believe, a direct correlation between the May high in 2015, the centre of the very large T structure of the January 2016 collapse, and Friday's 50 point drop.

So of course, the question on everyone's mind is 'what's next?'

The red T structure is still active and points to a recovery to highs (not necessarily new highs) in the mid-October time after perhaps some volatile days in the coming weeks.

Strong support exists just below at 2105-10.

And a new large T structure is under construction…

Be prepared.

For more detailed analysis and ongoing analysis of the developments in the S&P index on a daily basis, please Sign up for my daily Alerts & Observations


S/T Sell Signal at 2160

With the gap-down below 2170 we have a Short-term Sell Signal initiated at an important cycle high.

We finally received the catalyst for the squeeze that's been building, cancelling out the previous weak bullish signal and cancelling out the potential small T structures discussed.

We are now looking for a new major low to form the next large T structure.

Initial support could be on the important pink rising Gann line at about 2109 on monday.

Chart for 12 September 2016

For more detailed analysis, please Sign up for Alerts & Observations

Disclaimer: This is the diary of a personal trading system, its methodology and the signals that it is producing. You are welcome to follow along but please understand that the information presented here is for educational & entertainment purposes only. No recommendations are being made to buy, or sell stocks, options or futures contracts. Please consult your own financial advisor before making any investment decisions.


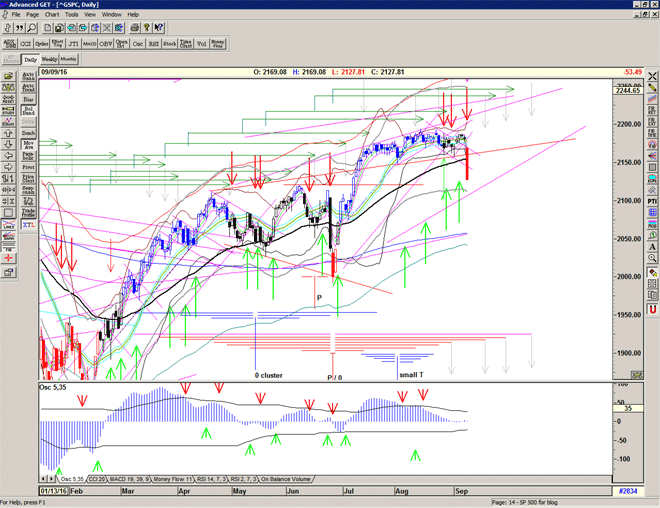
Something gives

Trading within an increasingly tight range and within the mid-channel, which is unusual behaviour and makes signalling direction very difficult at the moment. This reflects the long period of range bound price action. Something gives soon.

Approaching a short-term cycle high, active today and into tuesday, which corresponds with the small blue T structure pointing to  a high today, BUT could be drawn one day later and this would point to a short-term high on Tuesday…

Chart of S&P500 for 9 September 2016

For more detailed analysis, please Sign up for Alerts & Observations

Disclaimer: This is the diary of a personal trading system, its methodology and the signals that it is producing. You are welcome to follow along but please understand that the information presented here is for educational & entertainment purposes only. No recommendations are being made to buy, or sell stocks, options or futures contracts. Please consult your own financial advisor before making any investment decisions.


Literacy

Reading is the path to knowledge, and knowledge is the path to wealth.

On the 50th Literacy Day I would like to recommend a little book written in 1917:

One-Way Pockets: The Book of Books on Wall Street Speculation
by Don Guyon

A powerful little book that wastes no time at all in explaining just how to speculate on Wall Street, and is as relevant now as it was 99 years ago.

Chart of the S&P500 for 8 September 2016

For more detailed analysis, please Sign up for Alerts & Observations

Disclaimer: This is the diary of a personal trading system, its methodology and the signals that it is producing. You are welcome to follow along but please understand that the information presented here is for educational & entertainment purposes only. No recommendations are being made to buy, or sell stocks, options or futures contracts. Please consult your own financial advisor before making any investment decisions.


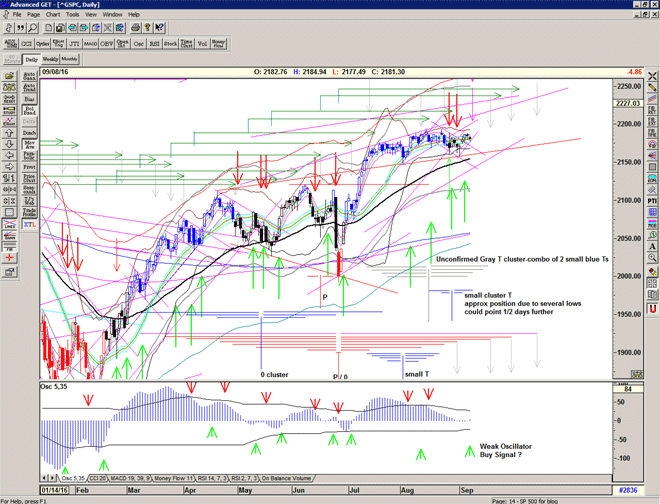
Short term Buy Signal at 2184

Price makes a short-term S/T Buy Signal at 2184, but upside seems relatively restricted.

Market seems to have shaken off that descending channel and the T volume oscillator turns positive confirming the prescence of the small cluster T.

The similar lows of the August 2 low and recent series of lows makes the unconfirmed possibility of a combination of the the 2 blue T structures, marked gray projecting highs for September 20.

Chart of S&P500 for 7 September 2016

For more detailed analysis, please Sign up for Alerts & Observations

Disclaimer: This is the diary of a personal trading system, its methodology and the signals that it is producing. You are welcome to follow along but please understand that the information presented here is for educational & entertainment purposes only. No recommendations are being made to buy, or sell stocks, options or futures contracts. Please consult your own financial advisor before making any investment decisions.


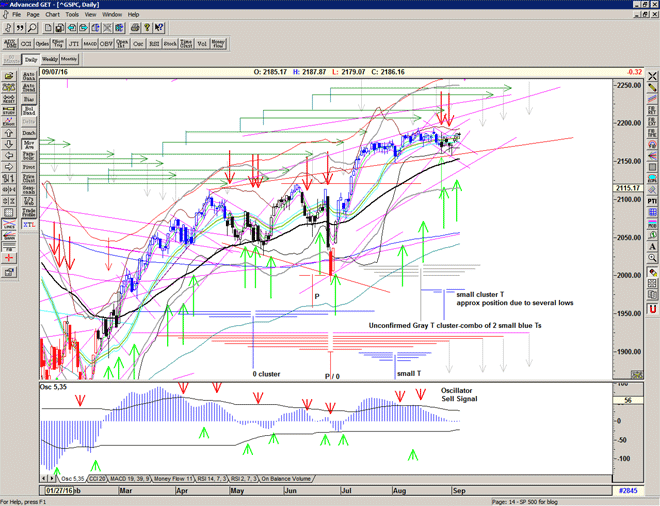
labor of love

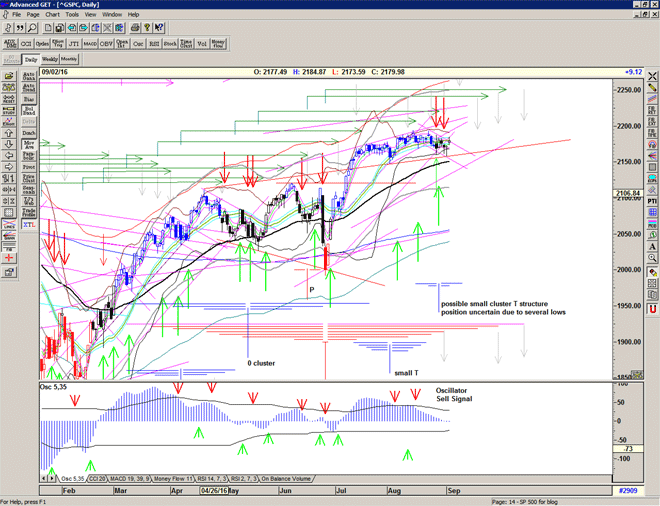
Pop and drop but didn't fail on the day.

Covered Short position at 2182, and potentially back on a Buy Signal with the recovery into the close above 2178.
Just wanted to see a bit more above the descending channel to confirm.

Not completely convincing due to underkiss of rising Gann line at 2084, but a possible small cluster T structure pointing to cycle high on the 8-9 September.

Chart of S&P500 for 05 September 2016

For more detailed analysis, please Sign up for Alerts & Observations

Disclaimer: This is the diary of a personal trading system, its methodology and the signals that it is producing. You are welcome to follow along but please understand that the information presented here is for educational & entertainment purposes only. No recommendations are being made to buy, or sell stocks, options or futures contracts. Please consult your own financial advisor before making any investment decisions.


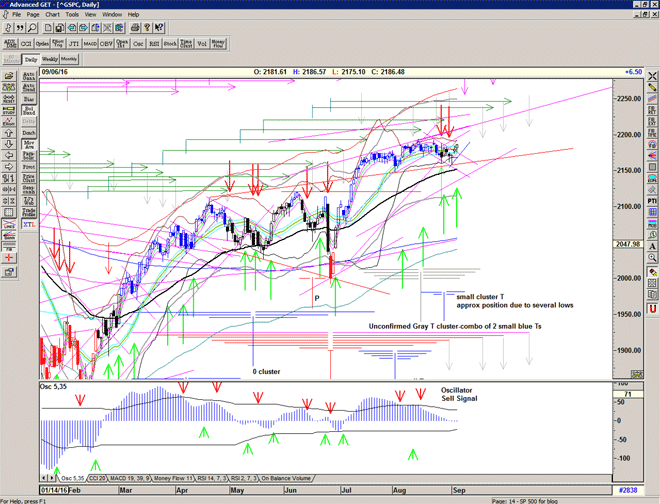
Without borders or boundaries

Neo: I know you're out there. I can feel you now. I know that you're afraid… you're afraid of us. You're afraid of change. I don't know the future. I didn't come here to tell you how this is going to end. I came here to tell you how it's going to begin. I'm going to hang up this phone, and then I'm going to show these people what you don't want them to see. I'm going to show them a world without you. A world without rules and controls, without borders or boundaries. A world where anything is possible. Where we go from there is a choice I leave to you. (The Matrix – 1999)

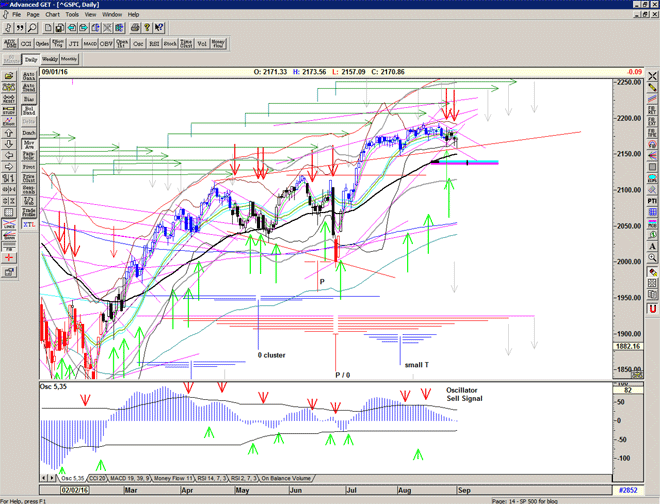
Market remains on a Sell Signal, for now, and looks like marking out a descending channel, targetting support at 2145.
Finding support below the tightening bollingers, which are becoming extremely tight.
Strength above that channel would indicate a change in direction.

Chart of S&P500 for 02 September 2016

For more detailed analysis, please Sign up for Alerts & Observations

Disclaimer: This is the diary of a personal trading system, its methodology and the signals that it is producing. You are welcome to follow along but please understand that the information presented here is for educational & entertainment purposes only. No recommendations are being made to buy, or sell stocks, options or futures contracts. Please consult your own financial advisor before making any investment decisions.


Short into September

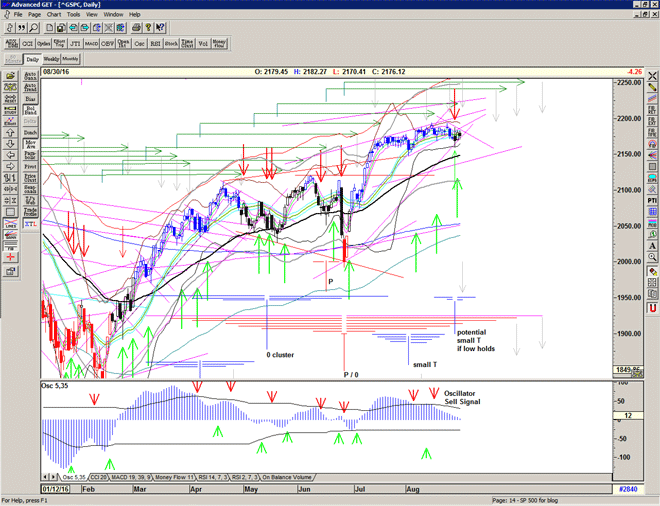
Yesterday's action produced a cover and short Signal at 2165, as it broke down through the important rising Gann line from the June 27 low. This line will probably become a resistance line for future moves up.

The lower bollinger held the day, and we saw a sort of recovery trying to cling onto the 2171 level.

Starting to build a downward sloping resistance line above the recent highs, so a break above those will change the picture somewhat.

Chart of S&P500 for 1 September 2016

For more detailed analysis, please Sign up for Alerts & Observations

Disclaimer: This is the diary of a personal trading system, its methodology and the signals that it is producing. You are welcome to follow along but please understand that the information presented here is for educational & entertainment purposes only. No recommendations are being made to buy, or sell stocks, options or futures contracts. Please consult your own financial advisor before making any investment decisions.


Waiting

"All things come to those who wait"

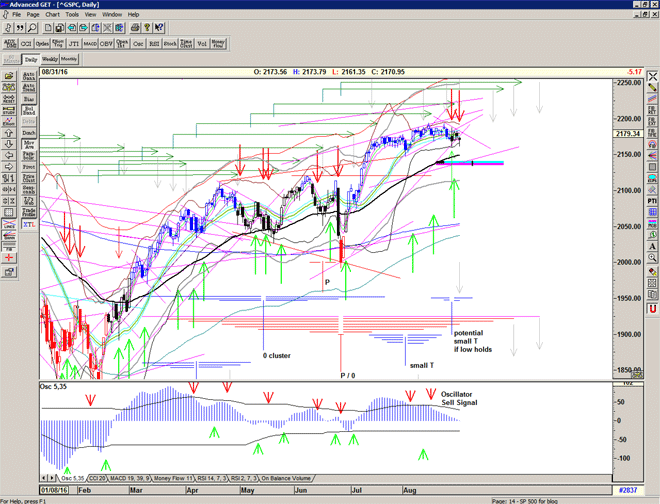
Time running out on a major arm of the red T structure – today / tomorrow –

and another tight bollinger squeeze preparing the market for a volatile start to September…

Chart of S&P500 for 31 August 2016

For more detailed analysis, please Sign up for Alerts & Observations

Disclaimer: This is the diary of a personal trading system, its methodology and the signals that it is producing. You are welcome to follow along but please understand that the information presented here is for educational & entertainment purposes only. No recommendations are being made to buy, or sell stocks, options or futures contracts. Please consult your own financial advisor before making any investment decisions.