From a Lion’s roar

Since the 01 March high in the S&Ps, we have seen a series of lower highs, and lower lows with strong bounces that have been sold into – marking out a defined downward channel.

So far the selling has been relatively mild, in comparison to previous corrective periods, but more and more it seems that the market is at an inflection point, and the obvious question is: is about to get unpleasant?

Lets have a look at the bigger picture:
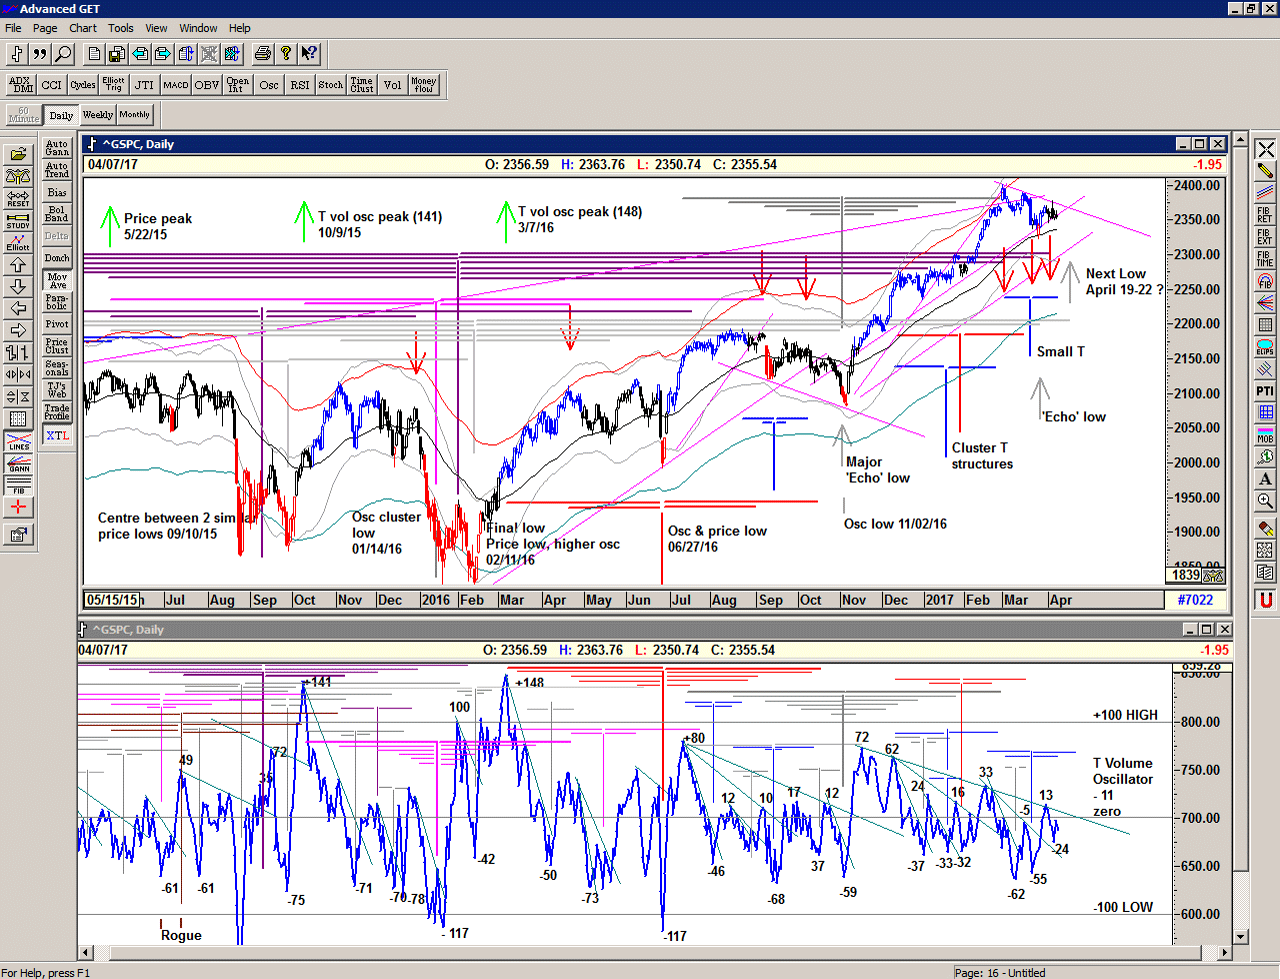
Chart of S&P 500 for 09 April 2017

The market has been trying to hold onto some strong rising support lines, whilst at the same time acknowledging a descending resistance line and this produces a triangulation. Triangulations are squeezes – direction uncertain.

We could make comparisons with the September 16 period, or alternatively with the May 16 period. It seems quite usual for the market to test a descending resistance line 3 or 4 times before making a firm decision whether to break it or rollover.

The very large T structure which still seems to be dominant – from the January-February 2016 double bottom projected a series of price highs from right back to the November and December 2014 highs to the recent highs. Before the November 2014 highs, the previous low was at a comparative level to the 2016 lows and so this T structure should be complete now. This could well explain the current lack of buying power in the market and could certainly produce some lower lows in the near future, as the market looks to re-charge itself.

The same T structure also projects an Echo low in the April 19-22 period, which remains to be seen.

We can also see that the buying surge at the Election low has produced a long line of shallow lower highs in the oscillator which we can describe as a cash-build up line, marked in green. When we get a buying surge that cuts through this line, we can draw the next large T structure. Of course, we may need to go down first in order to get the bounce required to break up through this cash build up.

We watch the oscillator for clues, but we use price as the leading indicator.

Be prepared for what is coming next.

For more detailed ongoing analysis of the developments in the S&P500 index on a daily basis, please Sign up for daily Alerts & Observations – includes access to Members Area and Explanatory Notes.

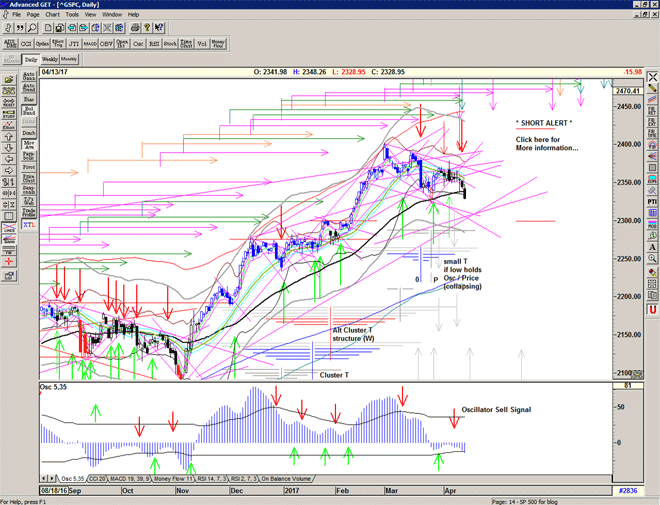
 

On reflection

“Meditation on inevitable death should be performed daily.
Every day when one’s body and mind are at peace, one should meditate upon being ripped apart by arrows, rifles, spears and swords, being carried away by surging waves, being thrown into the midst of a great fire, being struck by lightning, being shaken to death by a great earthquake, falling from thousand-foot cliffs, dying of disease or committing seppuku at the death of one’s master.
And every day without fail one should consider himself as dead”

– Yamamoto Tsunetomo, Hagakure: The Book of the Samurai

Holding onto support on the rising angle, trying to make a Buy Signal but selling into that strength again.
Very much within the chopshop zone oscillating between support and resistance, and on reflection waiting for the next catalyst.

The market continues to wind and coil in a strong triangulation pattern building a significant squeeze which when released will produce a dramatic movement (either up or down) and although the momentum (and risk) at the moment seems negative, the T volume oscillator is still hinting at a positive outcome.

Chart of S&P 500 for 07 April 2017

Be prepared for whatever comes next:

To receive detailed daily analysis, guidance and the updated daily Buy / Sell trigger levels being generated by the Trading the Line system before the market opens, and intraday alerts when appropriate, become a Member and Sign up for Alerts & Observations – includes access to Members Area and the Explanatory Notes for all of the concepts discussed.

Disclaimer: This is the diary of a personal trading system, its methodology and the signals that it is producing. You are welcome to follow along but please understand that the information presented here is for educational purposes only. No recommendations are being made to buy, or sell stocks, options or futures contracts. Please consult your own financial advisor before making any investment decisions.


To a thunder clap

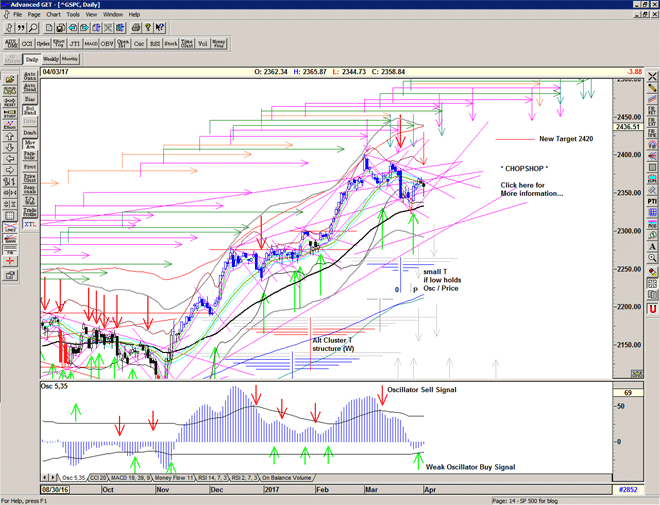
An S/T Buy Signal at the gap up open and straight into the strong descending resistance line at 2376.

The 2pm FED related panic move down, cancels that signal out and places a nervous market at rising support and if we are moving lower, we are back on a Sell Signal.

Dangerous market conditions.

Chart of S&P 500 for 06 April 2017

Be prepared for whatever comes next:

To receive detailed daily analysis, guidance and the updated daily Buy / Sell trigger levels being generated by the Trading the Line system before the market opens, and intraday alerts when appropriate, become a Member and Sign up for Alerts & Observations – includes access to Members Area and the Explanatory Notes for all of the concepts discussed.

Disclaimer: This is the diary of a personal trading system, its methodology and the signals that it is producing. You are welcome to follow along but please understand that the information presented here is for educational purposes only. No recommendations are being made to buy, or sell stocks, options or futures contracts. Please consult your own financial advisor before making any investment decisions.


From a rainstorm

“There is something to be learned from a rainstorm.
When meeting with a sudden shower, you try not to get wet and run quickly along the road.
But doing such things as passing under the eaves of houses, you still get wet.
When you are resolved from the beginning, you will not be perplexed, though you will still get the same soaking.
This understanding extends to everything.”

– Yamamoto Tsunetomo, Hagakure: The Book of the Samurai

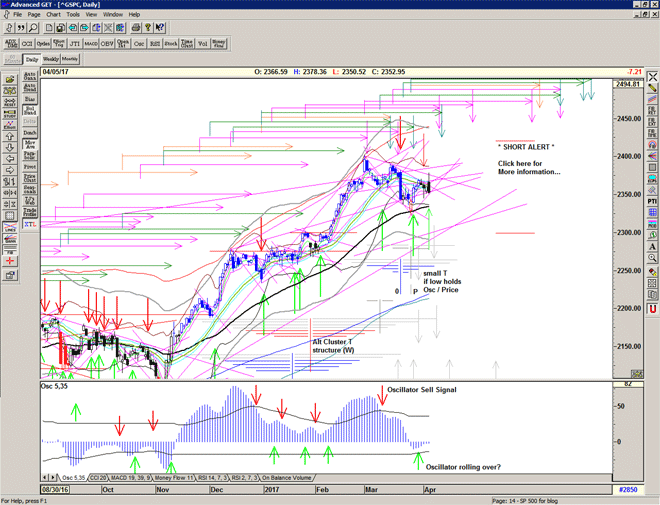
Testing the Short Signal level once again but still within the chopshop zone and acting accordingly.

So long as the recent low holds we might expect to see some kind of grind away higher towards the descending resistance within the right-hand side of the small T structure.

Chart of S&P 500 for 05 April 2017

Be prepared for whatever comes next:

To receive detailed daily analysis, guidance and the updated daily Buy / Sell trigger levels being generated by the Trading the Line system before the market opens, and intraday alerts when appropriate, become a Member and Sign up for Alerts & Observations – includes access to Members Area and the Explanatory Notes for all of the concepts discussed.

Disclaimer: This is the diary of a personal trading system, its methodology and the signals that it is producing. You are welcome to follow along but please understand that the information presented here is for educational purposes only. No recommendations are being made to buy, or sell stocks, options or futures contracts. Please consult your own financial advisor before making any investment decisions.


April Fool indeed

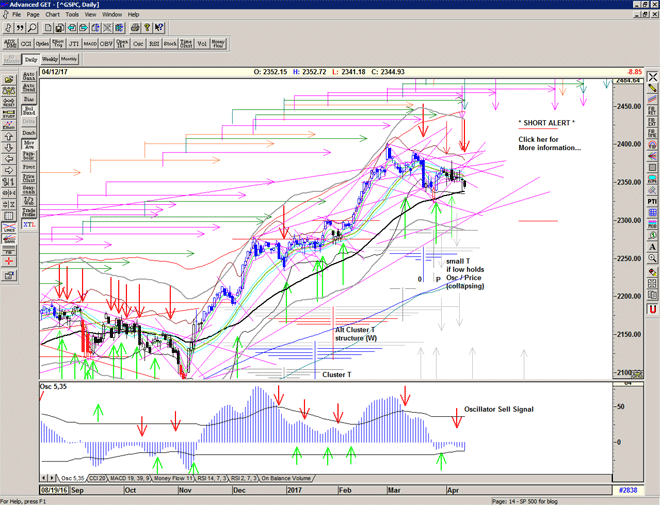
A Sell Signal generated in early trade but support found at 2345 – just above the rising angle from the most recent low – and a recovery into the afternoon cancelled out the Sell Signal, for now.

We are very much within the dangerous chopshop zone – where Sell Signals become Buy Signals and vice versa – and we should expect more chop in the days to come until the market makes a strong exit one way or another.

The T volume oscillator turns negative, flashing a warning signal, and weakening the current small T.

Chart of S&P 500 for 04 April 2017

Be prepared for whatever comes next:

To receive detailed daily analysis, guidance and the updated daily Buy / Sell trigger levels being generated by the Trading the Line system before the market opens, and intraday alerts when appropriate, become a Member and Sign up for Alerts & Observations – includes access to Members Area and the Explanatory Notes for all of the concepts discussed.

Disclaimer: This is the diary of a personal trading system, its methodology and the signals that it is producing. You are welcome to follow along but please understand that the information presented here is for educational purposes only. No recommendations are being made to buy, or sell stocks, options or futures contracts. Please consult your own financial advisor before making any investment decisions.


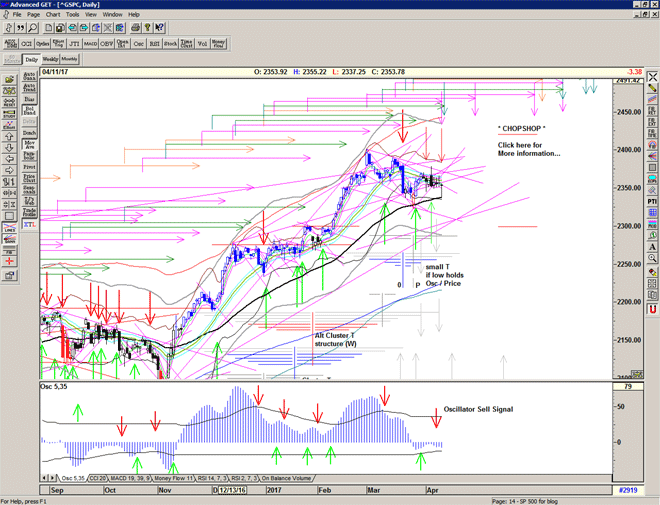
April Fool

Market finds repeated resistance at 2370 and equivalence at the Mid-channel.

Too much stability here leads to choppy days ahead as the balance of forces become too equal.

Chart of S&P 500 for 01 April 2017

Be prepared for whatever comes next:

To receive detailed daily analysis, guidance and the updated daily Buy / Sell trigger levels being generated by the Trading the Line system before the market opens, and intraday alerts when appropriate, become a Member and Sign up for Alerts & Observations – includes access to Members Area and the Explanatory Notes for all of the concepts discussed.

Disclaimer: This is the diary of a personal trading system, its methodology and the signals that it is producing. You are welcome to follow along but please understand that the information presented here is for educational purposes only. No recommendations are being made to buy, or sell stocks, options or futures contracts. Please consult your own financial advisor before making any investment decisions.


First quarter

Market heading up into potential resistance as we recover the majority of last week's gains, and a bit of a wobble or failure between 2370 and 2380 would seem likely (but not necessarily required) as we round off the first quarter and look forward to some April Fools.

Chart of S&P 500 for 31 March 2017

Be prepared for whatever comes next:

To receive detailed daily analysis, guidance and the updated daily Buy / Sell trigger levels being generated by the Trading the Line system before the market opens, and intraday alerts when appropriate, become a Member and Sign up for Alerts & Observations – includes access to Members Area and the Explanatory Notes for all of the concepts discussed.

Disclaimer: This is the diary of a personal trading system, its methodology and the signals that it is producing. You are welcome to follow along but please understand that the information presented here is for educational purposes only. No recommendations are being made to buy, or sell stocks, options or futures contracts. Please consult your own financial advisor before making any investment decisions.


Like sugar and spice

Market relaxing into the feel of things.

T volume oscillator makes a significant move higher above the zero line, adding additional credence to the signal and to the new T structure.

OSC oscillator looking like its turned and close to a OSC Buy Signal indicating that momentum looks up.

Chart of S&P 500 for 30 March 2017

Be prepared for whatever comes next:

To receive detailed daily analysis, guidance and the updated daily Buy / Sell trigger levels being generated by the Trading the Line system before the market opens, and intraday alerts when appropriate, become a Member and Sign up for Alerts & Observations – includes access to Members Area and the Explanatory Notes for all of the concepts discussed.

Disclaimer: This is the diary of a personal trading system, its methodology and the signals that it is producing. You are welcome to follow along but please understand that the information presented here is for educational purposes only. No recommendations are being made to buy, or sell stocks, options or futures contracts. Please consult your own financial advisor before making any investment decisions.

Like butter baby

And so the market powers back up through the previous layer of support / resistance to make an S/T BUY Signal and the Bull defends the important rising trend line off the previous highs.

Of course such a strong move up into an area of potential resistance may need some working off, and there is a scheduled pulse high for today, but yesterday's strength in breadth in the T volume oscillator has cut through the cash-build line from the 2400 peak and this confirms the prescence of a small T structure, projecting highs in April.

Chart of S&P 500 for 29 March 2017

Be prepared for whatever comes next:

To receive detailed daily analysis, guidance and the updated daily Buy / Sell trigger levels being generated by the Trading the Line system before the market opens, and intraday alerts when appropriate, become a Member and Sign up for Alerts & Observations – includes access to Members Area and the Explanatory Notes for all of the concepts discussed.

Disclaimer: This is the diary of a personal trading system, its methodology and the signals that it is producing. You are welcome to follow along but please understand that the information presented here is for educational purposes only. No recommendations are being made to buy, or sell stocks, options or futures contracts. Please consult your own financial advisor before making any investment decisions.