Ides of March

Soothsayer. Caesar!
Caesar. Ha! who calls?
Casca. Bid every noise be still: peace yet again!
Caesar. Who is it in the press that calls on me?
I hear a tongue, shriller than all the music,
Cry 'Caesar!' Speak; Caesar is turn'd to hear.
Soothsayer. Beware the ides of March.
Caesar. What man is that?
Brutus. A soothsayer bids you beware the ides of March.

William Shakespeare, The Tragedy of Julius Caesar, Act I, Scene 2

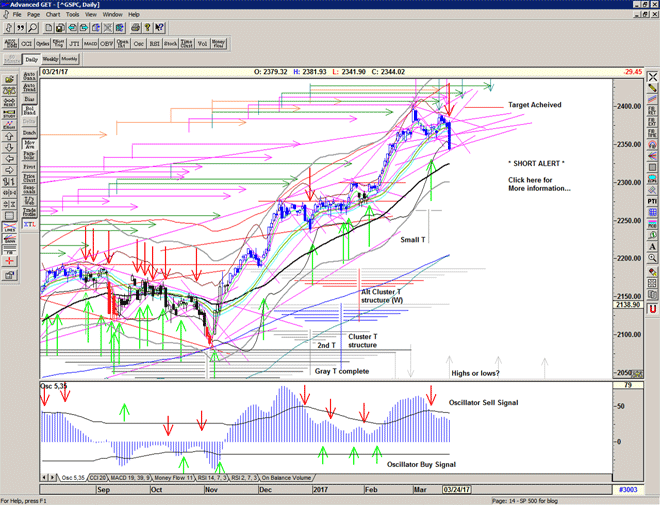
Another probe into the Mid-channel, and teasing with a 'cover signal'.
Weak Buy Signal still active but no follow thru yet, as we wait for the Fed's decision and commentary. Hedge accordingly.

Chart of S&P 500 for 15 March 2017

Be prepared: To receive detailed daily analysis, guidance and the updated daily Buy / Sell trigger levels being generated by the system before the market opens, and intraday alerts when appropriate, please become a Member and Sign up for Alerts & Observations – includes access to Members Area and the Explanatory Notes which explain how this system works.

Disclaimer: This is the diary of a personal trading system, its methodology and the signals that it is producing. You are welcome to follow along but please understand that the information presented here is for educational purposes only. No recommendations are being made to buy, or sell stocks, options or futures contracts. Please consult your own financial advisor before making any investment decisions.


Transcendence

The most beautiful experience we can have is the mysterious.
It is the fundamental emotion that stands at the cradle of true art and true science.

Albert Einstein, The World As I See It, 1930

Another one of those days when you could have been excused for not coming into work early.
Still trading mostly above the averages and gently pushing upwards into the close.

Chart of S&P500 for 14 March 2017

Be prepared: To receive detailed daily analysis, guidance and the updated daily Buy / Sell trigger levels being generated by the system before the market opens, and intraday alerts when appropriate, please become a Member and Sign up for Alerts & Observations – includes access to Members Area and the Explanatory Notes which explain how this system works.

Disclaimer: This is the diary of a personal trading system, its methodology and the signals that it is producing. You are welcome to follow along but please understand that the information presented here is for educational purposes only. No recommendations are being made to buy, or sell stocks, options or futures contracts. Please consult your own financial advisor before making any investment decisions.


The Power of T Theory

As mentioned in my last report, prior to the much anticipated 28 February peak at the end of the Large gray T structure, there was some doubt as to whether the Cluster T structures that had emerged during the final stages of the large gray T structure would have any effect upon extending the gray structure into March and April.

This was due to the ominous drop in the T volume oscillator just prior to the end-date which in-effect was cancelling out the extensions of the Cluster T structures and bringing them into doubt.

It is now clear that we did indeed make a final and dramatic peak in-line with the end of the Large gray T stucture centred around the per-election low. The market used every day of that projection in its search for new highs and a distinct lack of buying power and market breadth has been noted since the pop on the 1 of March.

The one day margin of error was previously noted on the 25th January and takes into account the fact that the T volume oscillator turned 2 days prior to price at the low. This is indeed a powerful example of T Theory's accuracy in projecting highs from major lows in the market.

Chart of S&P 500 for 12 March 2017

The recent descent from the highs towards 2350, has been gentle and orderly without any real panic and Friday's reaction to the strong employment report did, at least initially, trigger a short term Buy signal and there is a short line of cash-build up and the possibility of a small T which if confirmed during the next days would project highs towards the end of the month. This will be confirmed IF the T volume oscillator continues upwards and cuts the descending cash-build up line from the oscillator's recent highs.

As you can see there is also a longer line of cash-build up going back to the oscillator's peak at 72 on the 15 November and when the oscillator does cut this line (probably after a significant low yet to be seen) we will be able to declare another large T structure.

We watch the oscillator for clues, but we use price as the leading indicator.

Be prepared for what is coming next.

For more detailed ongoing analysis of the developments in the S&P500 index on a daily basis, please Sign up for daily Alerts & Observations – includes access to Members Area and Explanatory Notes.


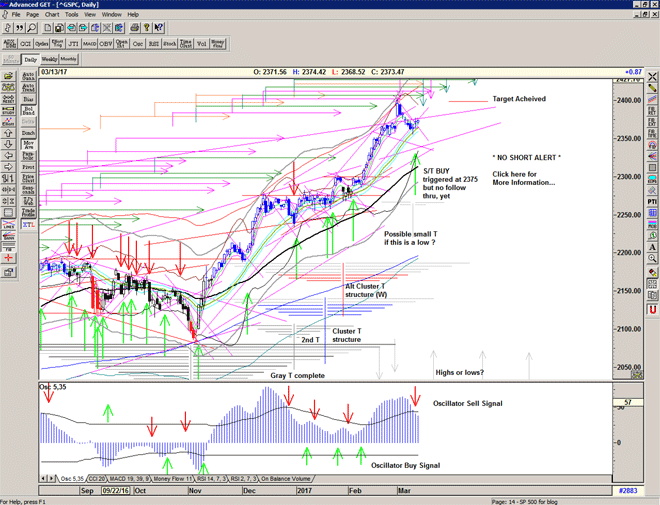
S/T Buy Signal at 2375, but…

An S/T BUY Signal triggered in early trade at 2375, but weakened by the pop and drop at the descending resistance line, followed by a Buy it back push into the close. Also characteristic chopshop behaviour that seems to occur when the market is within the mid-channel area.

A clean exit from the short term descending trend would have been more favorable to the buy signal, and the T volume oscillator requires further follow through to establish the new small possible T structure.

Chart of S&P 500 for 13 March 2017

Be prepared: To receive detailed daily analysis, guidance and the updated daily Buy / Sell trigger levels being generated by the system before the market opens, and intraday alerts when appropriate, please become a Member and Sign up for Alerts & Observations – includes access to Members Area and the Explanatory Notes which explain how this system works.

Disclaimer: This is the diary of a personal trading system, its methodology and the signals that it is producing. You are welcome to follow along but please understand that the information presented here is for educational purposes only. No recommendations are being made to buy, or sell stocks, options or futures contracts. Please consult your own financial advisor before making any investment decisions.


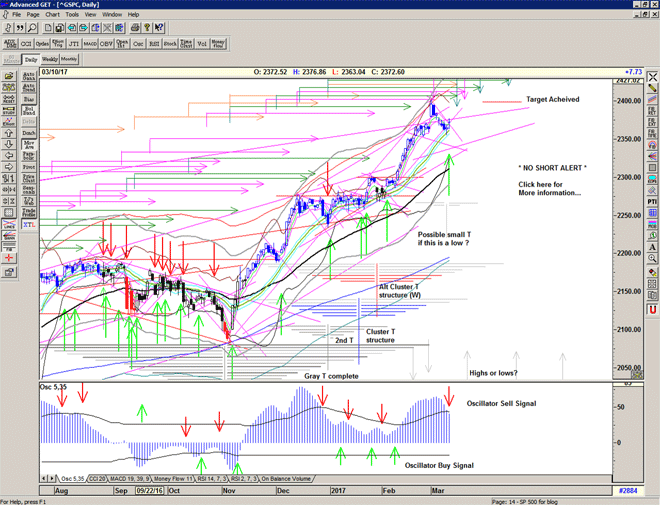
Mid-Channel dagger

A bullish rejection from the mid-channel area potentially setting up the possibility of a small T if yesterday turns out to be a low.

Momentum slowing and an OSC Oscillator Sell Signal will occur today.
Osc signals are a lagging momentum indicator and suggest that it is unlikely that we will see significantly higher new highs if we do rally.

I have drawn in the possible new T which will not be activated unless we actually get a Buy Signal and note that it does syncronise with the scheduled upcoming pulse and echo cycle highs.

Keep an eye on the T volume oscillator for signs of life, and allow price to be the leading indicator for commitment.

Chart of S&P 500 for 10 March 2017

Be prepared: To receive detailed daily analysis, guidance and the updated daily Buy / Sell trigger levels being generated by the system before the market opens, and intraday alerts when appropriate, please become a Member and Sign up for Alerts & Observations – includes access to Members Area and the Explanatory Notes which explain how this system works.

Disclaimer: This is the diary of a personal trading system, its methodology and the signals that it is producing. You are welcome to follow along but please understand that the information presented here is for educational purposes only. No recommendations are being made to buy, or sell stocks, options or futures contracts. Please consult your own financial advisor before making any investment decisions.


Waiting for signs of life

Market continues the gentle slide lower which is indicative of the lack of buying power at the end of a large T structure.
And we now enter a Warning Phase.

We are now quite oversold and a short term bounce could occur soon with several indicators now flashing 'oversold'.
A cross above the diagonal descending resistance line from the all time high would be a good confirmation.

As we wait for a signal, today's test will be to see if the rising line from the February 8 push upwards holds or not.
And keep an eye on the T volume oscillator for signs of life.

NYMO and short-term RSI at, or near to, levels associated with lows…

Chart of S&P 500 for 09 March 2017

Be prepared: To receive detailed daily analysis, guidance and the updated daily Buy / Sell trigger levels being generated by the system before the market opens, and intraday alerts when appropriate, please become a Member and Sign up for Alerts & Observations – includes access to Members Area and the Explanatory Notes which explain how this system works.

Disclaimer: This is the diary of a personal trading system, its methodology and the signals that it is producing. You are welcome to follow along but please understand that the information presented here is for educational purposes only. No recommendations are being made to buy, or sell stocks, options or futures contracts. Please consult your own financial advisor before making any investment decisions.


Provenance

Price fails to hold up above the Buy signal and a Cover Signal is confirmed.
Price will need to prove itself again, before we confirm a new Buy Signal.

The T volume oscillator makes a significant move down below -50, indicating that we are now looking for a low to be confirmed, before the next wave of buying occurs.

There is strong rising support ascending from the February 8 move upwards, and otherwise there is the long term trend line from the previous peaks which was previous resistance and now may become a support line.

It is now clear that the March 1 peak at 2400 was indeed the end of a major T structure and that the 'Cluster T structures' also completed at the same time. We may see some small effects from those projections, but we are now really looking to see a new structure emerge.

Chart of S&P 500 for 8 March 2017

Be prepared: To receive detailed daily analysis, guidance and the updated daily Buy / Sell trigger levels being generated by the system before the market opens, and intraday alerts when appropriate, please become a Member and Sign up for Alerts & Observations – includes access to Members Area and the Explanatory Notes which explain how this system works.

Disclaimer: This is the diary of a personal trading system, its methodology and the signals that it is producing. You are welcome to follow along but please understand that the information presented here is for educational purposes only. No recommendations are being made to buy, or sell stocks, options or futures contracts. Please consult your own financial advisor before making any investment decisions.


Gap-fill

Market continues to retrace its steps and filled the open gap at 2369-2375 with a bounce off the long term projection from the February 2015 high (a major turn).

Price remains above the Buy Signal level for the time-being, but the risks seem higher with the continued drop in the T volume oscillator and the Osc oscillator also now indicating a slowing of the momentum.

Perhaps not yet, but at some point we should see another 'attempt' at the highs in-line with the next series of scheduled highs which are mid March and late March.

The Cluster T structures also point to peaks at those times but the T volume oscillator is not currently confirming any further strength in those structures, and this is suggesting that there is a low to be confirmed first.

Chart of S&P 500 for 07 March 2017

Be prepared: To receive detailed daily analysis, guidance and the updated daily Buy / Sell trigger levels being generated by the system before the market opens, and intraday alerts when appropriate, please become a Member and Sign up for Alerts & Observations – includes access to Members Area and the Explanatory Notes which explain how this system works.

Disclaimer: This is the diary of a personal trading system, its methodology and the signals that it is producing. You are welcome to follow along but please understand that the information presented here is for educational purposes only. No recommendations are being made to buy, or sell stocks, options or futures contracts. Please consult your own financial advisor before making any investment decisions.