Playing catch up

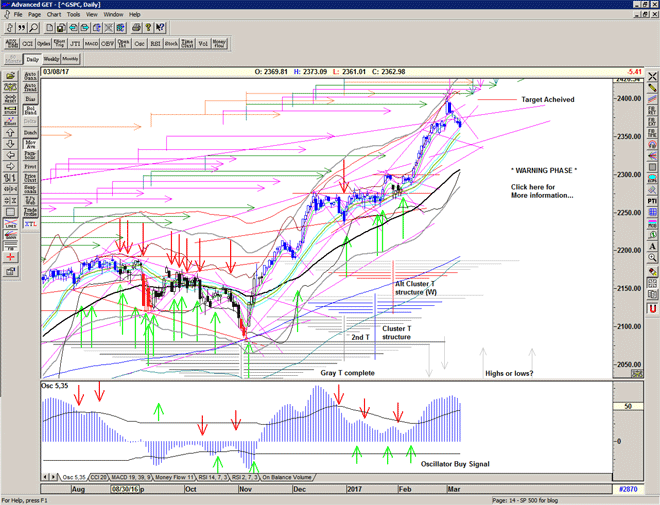
Market playing catch up within the higher range, still in response to the echo high and the end of the large T structure.
Game remains on but more resolution is required.

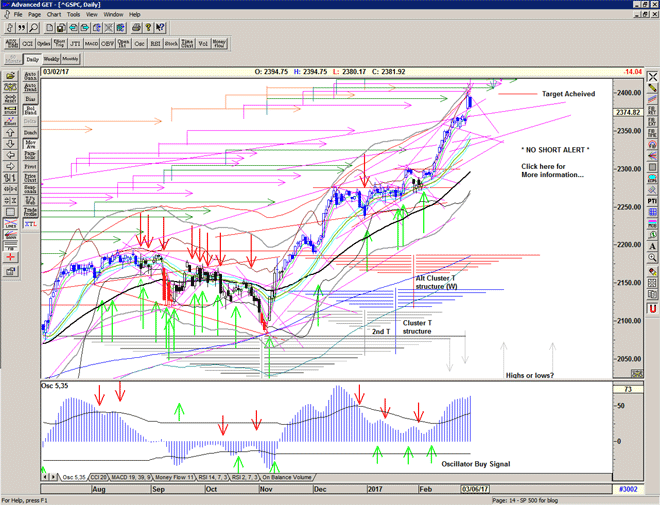
Chart of S&P 500 for 06 March 2017

Be prepared: To receive detailed daily analysis, guidance and the updated daily Buy / Sell trigger levels being generated by the system before the market opens, and intraday alerts when appropriate, please become a Member and Sign up for Alerts & Observations – includes access to Members Area and the Explanatory Notes which explain how this system works.

Disclaimer: This is the diary of a personal trading system, its methodology and the signals that it is producing. You are welcome to follow along but please understand that the information presented here is for educational purposes only. No recommendations are being made to buy, or sell stocks, options or futures contracts. Please consult your own financial advisor before making any investment decisions.


Somewhere

"Would you tell me, please, which way I ought to go from here?'
'That depends a good deal on where you want to get to,' said the Cat.
'I don't much care where -' said Alice.
'Then it doesn't matter which way you go,' said the Cat.
'- so long as I get SOMEWHERE,' Alice added as an explanation.
'Oh, you're sure to do that,' said the Cat, 'if you only walk long enough."

– Lewis Carroll, Alice in Wonderland, 1865

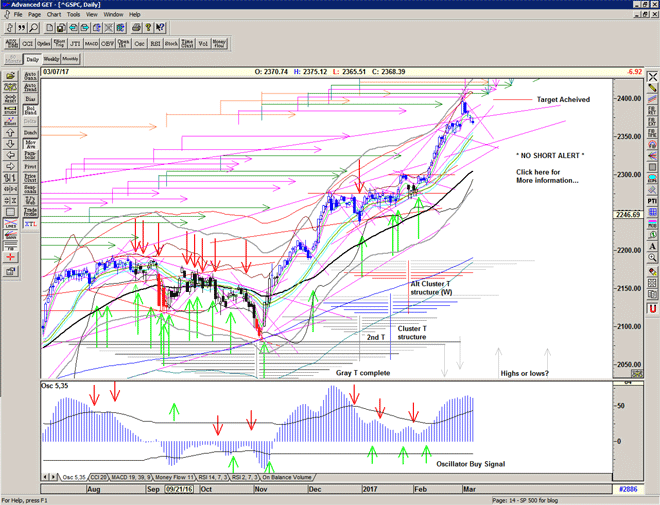
Yesterday's move certainly fits in with an ending of the Large Gray T structure and the Echo high, as the light selling in the morning just kept going all day.

Unfortunately, this also questions the validity of the extended arms of Cluster T structures as the T volume oscillator drops back below zero. The Buy Signal is still active due to the high level of price relative to the signal levels, but cautious.

A visit to the gap seems likely, and how we negociate that will be quite revealing…

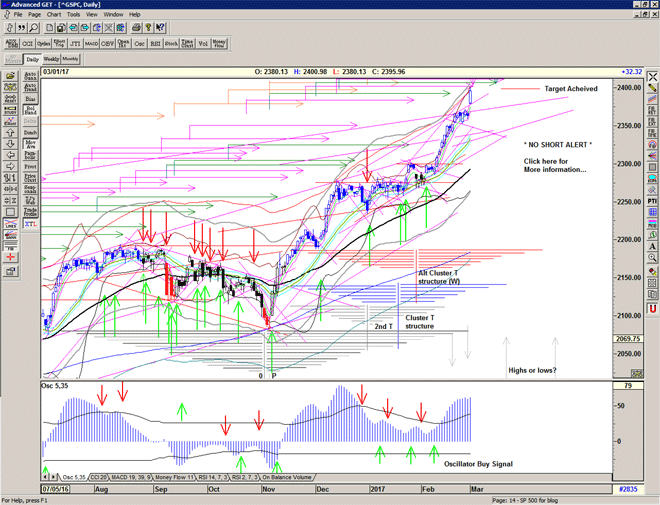
Chart of S&P 500 for 03 March 2017

Be prepared: To receive detailed daily analysis, guidance and the updated daily Buy / Sell trigger levels being generated by the system before the market opens, and intraday alerts when appropriate, please become a Member and Sign up for Alerts & Observations – includes access to Members Area and the Explanatory Notes which explain how this system works.

Disclaimer: This is the diary of a personal trading system, its methodology and the signals that it is producing. You are welcome to follow along but please understand that the information presented here is for educational purposes only. No recommendations are being made to buy, or sell stocks, options or futures contracts. Please consult your own financial advisor before making any investment decisions.


Some more tea

"Take some more tea," the March Hare said to Alice, very earnestly.
"I've had nothing yet," Alice replied in an offended tone, "so I can't take more."
"You mean you can't take less," said the Hatter: "it's very easy to take more than nothing."
"Nobody asked your opinion," said Alice.”

Lewis Carroll, Alice in Wonderland,1865

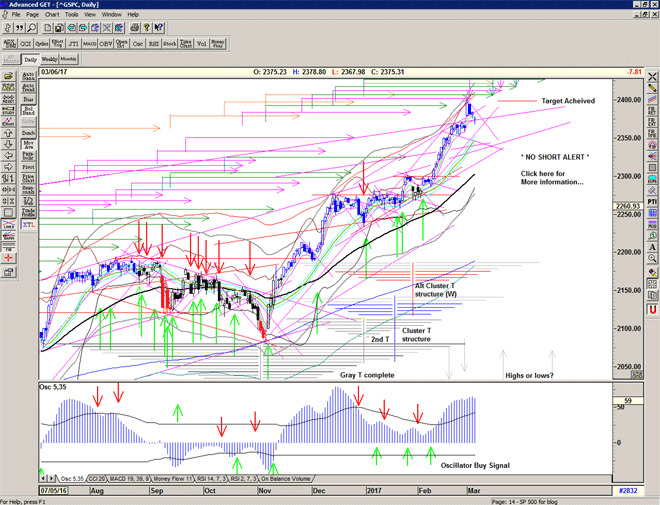
A gap and go day and the market never looked back as it breaks out above the long term projection from the February 2015 high.
The T volume oscillator responds and returns to the zero level removing the previous cautious note from the previous days, and re-confirming the Cluster T structures.

This is potentially an important event for long term reference as it is suggesting another shift is occurring in the market similar to June 2014.

Of course, the market is now rather overbought, and at some extreme levels within the various channels, and so some form of consolidation would be normal but not necessarily essential – that was a formidable and urgent move yesterday and is, I beleive,  telling us something important.

We should also be aware that yesterday is inline with the end of the Large gray T structure (+1 day) and if we see a rapid retreat from this level it would be explainable as the blow-off at the end of a large and powerful T structure. Interesting days ahead.

Chart of S&P 500 for 02 March 2017

Be prepared: To receive detailed daily analysis, guidance and the updated daily Buy / Sell trigger levels being generated by the system before the market opens, and intraday alerts when appropriate, please become a Member and Sign up for Alerts & Observations – includes access to Members Area and the Explanatory Notes which explain how this system works.

Disclaimer: This is the diary of a personal trading system, its methodology and the signals that it is producing. You are welcome to follow along but please understand that the information presented here is for educational purposes only. No recommendations are being made to buy, or sell stocks, options or futures contracts. Please consult your own financial advisor before making any investment decisions.


Target acheived, but what’s next?

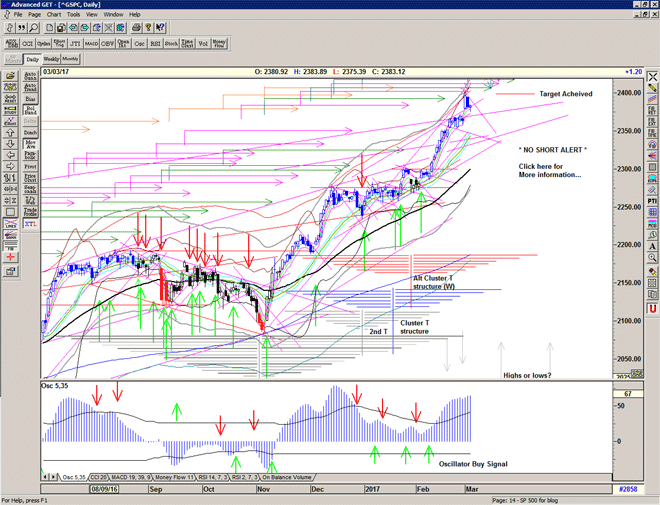
What a different day? Looks like a lot of players positioned short and got badly burnt.

With the market bubbling about at 2400, we have reached yet another interesting numerical target.

Very close to my upper gray channel and also at the upper Extreme level which suggests that further gains might be limited. And with an Echo high scheduled for tomorrow we might see some profit-taking.

Is this the final thrust of the Large gray T structure, or is this confirming the possibility of further strength into late March as projected by the Cluster T structures?

Under the Hood

The Large gray T structure from the Election low is now complete (but with a possible 1-2 extra, maybe) and we could now see a significant reduction in buying power.

T volume oscillator makes a significant move down confirming that under the hood the market is entering a distribution phase.

The longer arms of the Cluster T structures are now under threat.

It wouldn't be surprising to see the market open out its range, perhaps make a token new high and also mark out a new lower range suggested by the descending line from the small gap at 2351.

In the meantime the averages are also playing catch up, and significant support lies at the rising lines from the previous consolidation period.

Chart of S&P 500 for 01 March 2017

Be prepared: To receive detailed daily analysis, guidance and the updated daily Buy / Sell trigger levels being generated by the system before the market opens, and intraday alerts when appropriate, please become a Member and Sign up for Alerts & Observations – includes access to Members Area and the Explanatory Notes which explain how this system works.

Disclaimer: This is the diary of a personal trading system, its methodology and the signals that it is producing. You are welcome to follow along but please understand that the information presented here is for educational purposes only. No recommendations are being made to buy, or sell stocks, options or futures contracts. Please consult your own financial advisor before making any investment decisions.


Feeling some Heat

Nothing much yet but today's action is showing the slowing of momentum and a slight lack of buying power inline with the end of the T structure. Yesterday the T volume oscillator rose to -3 and it would have been good to see it above zero today, but this suggests more deterioration under the hood than price is indicating.

As we have a window of 2-3 days for peak we could see the market struggling to hold up but frustrating the bears at the same time. Think choppy and toppy.

Swing pretty girl, Swing

She is an imaginary girl, A fiction
I am a dog on a chain, A prisoner
When I see her walk To and Fro
My teeth grope on
All reason goes
Swing pretty girl, Swing
It ain't real anyway
Fields so blue, All drenched in red
Clouds up in the sun, I feel so dead

Imaginary Girl, David Lynch, 2007

Another grind higher, feels familiar huh?
T volume oscillator recovers somewhat and back close to zero

Is that a small megaphone pattern forming at the highs, I wonder… see if we come down and test the lower line in a few days or so.
Otherwise move along please, nothing to see here, bulls still buying the dips…

Chart of S&P 500 for 28 February 2017

Be prepared: To receive detailed daily analysis, guidance and the updated daily Buy / Sell trigger levels being generated by the system before the market opens, and intraday alerts when appropriate, please become a Member and Sign up for Alerts & Observations – includes access to Members Area and the Explanatory Notes which explain how this system works.

Disclaimer: This is the diary of a personal trading system, its methodology and the signals that it is producing. You are welcome to follow along but please understand that the information presented here is for educational purposes only. No recommendations are being made to buy, or sell stocks, options or futures contracts. Please consult your own financial advisor before making any investment decisions.


Feel the Heat

Don't let yourself get attached to anything you are not willing to walk out on in 30 seconds flat if you feel the heat around the corner.
Heat, 1995, Dir: Michael Mann

Market heats up and the Bulls take control again in late afternoon trade to close the week in style, and remind us that this is a bull market, baby…

Expect the choppy and toppy grind away higher to continue until we get a cover signal.

We have an important peak projection for a high scheduled for 28 February inline with the end of the Large gray Election low T structure (+ possibly 1-2 days because the oscillator low is 2 days prior to the price low, and we have seen this reflected at previous peaks in the T structure).

We also have an important Echo high sheduled for 2 March.

Chart of S&P500 for 27 February 2017

Be prepared: To receive detailed daily analysis, guidance and the updated daily Buy / Sell trigger levels being generated by the system before the market opens, and intraday alerts when appropriate, please become a Member and Sign up for Alerts & Observations – includes access to Members Area and the Explanatory Notes which explain how this system works.

Disclaimer: This is the diary of a personal trading system, its methodology and the signals that it is producing. You are welcome to follow along but please understand that the information presented here is for educational purposes only. No recommendations are being made to buy, or sell stocks, options or futures contracts. Please consult your own financial advisor before making any investment decisions.


Endgame?

As mentioned in my last report, we had a final peak projection for the Large gray Election low T structure for 27 February – actually 28 February because I forgot about President's Day. At that time it was unclear whether the market would selloff a bit first, but a linear move was expected into the endgame of the Large T structure.

On 9 February we saw the market break upwards through the previous peak at 2300 and accelerate towards a series of projected resistance lines at the upper extreme of the trading channel and this target has now been acheived during the last few days.

I pointed out to my readers that the 9 February move was creating what I refer to as a Cluster T Structure because the T volume oscillator was breaking upwards through a cash-build up line and generating a strong Buy Signal. The Cluster T structure is created by a series of similar lows in both price and oscillator and creates a number of different possible projections. I have drawn the red and blue possibilities but other positions are possible. Interestingly this situation produced the possibility for an extension of the large T structure into March and April.

Chart of S&P 500 for 25 February 2017

We are now peaking in line with the final days of the Large gray T structure, and this could mean a top occurs in the market on 28 February or thereabouts (+ 2 days – the oscillator low is 2 days before the price low and recent peaks have reflected this).

During the last 2-3 days we have seen some significant weakness developing in the oscillator and this represents a reduction in the Buying Power within the market. This is also hinting that we may be close to an important peak and we should watch it carefully because it is potentially cancelling out the extended arms of the Cluster T structures.

In my mind there are 2 possibilities to consider:

Either the market is about to peak inline with the end of the gray T structure and then turn down into a new important low before making a completely new T structure at some point in the future. In this case the Cluster T structures are no longer active and the oscillator continues to drop and price makes a Cover Signal.

Or the market finds renewed strength and continues to move higher inline with the Cluster T structure(s), perhaps after a few days of weakness associated with the end of the Large gray T structure. In this case the oscillator starts to recover, and price continues on a Buy Signal.

We watch the oscillator for clues, but we use price as the leading indicator.

Be prepared for what is coming next.

For more detailed ongoing analysis of the developments in the S&P500 index on a daily basis, please Sign up for daily Alerts & Observations – includes access to Members Area and Explanatory Notes.