Light shines on

I was blind, now I can see…
you made a believer out of me…

I'm moving on up now, getting out of the darkness…
My light shines on, my light shines on, my light shines on…

Primal Scream, Moving on Up, 1991

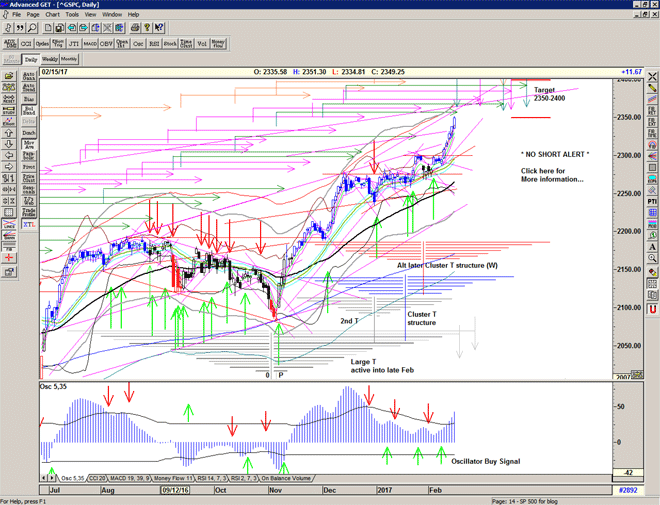
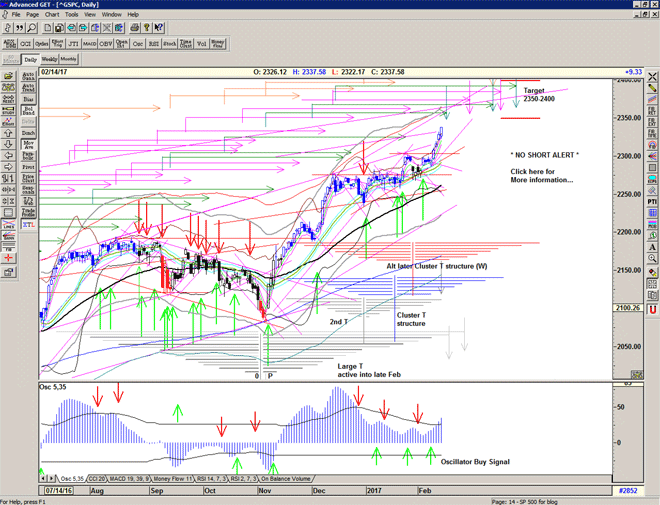
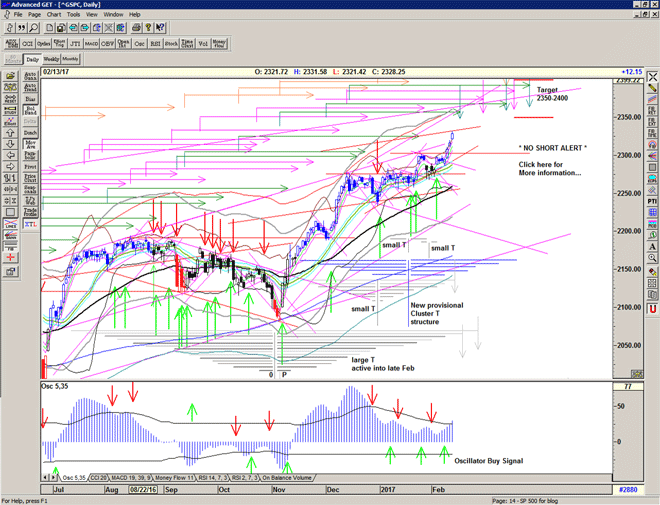
Moving on up and breaking out again.

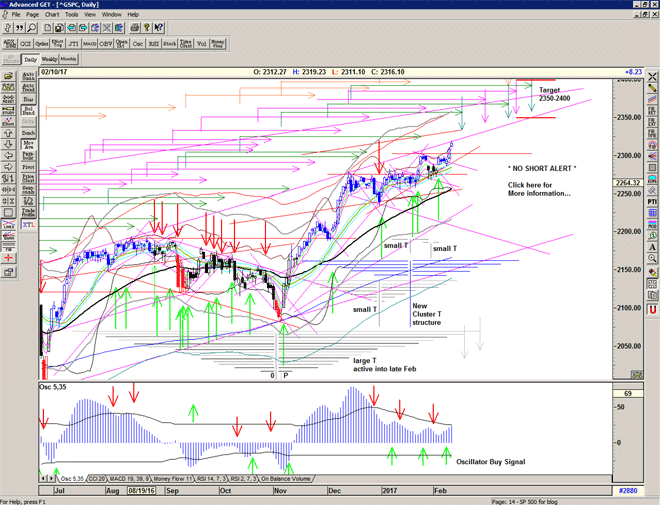
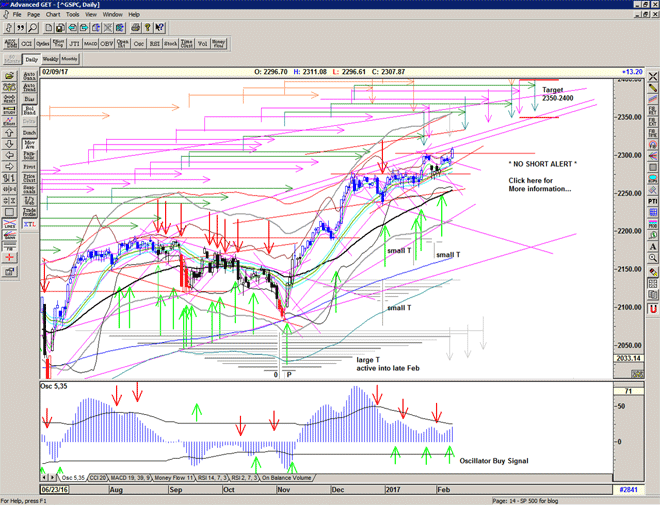
Of course, this might be a top, and we do have an arm of the T structure projecting to February 8 (and the previous major arm was 1 or 2 days late), so we could also certainly expect to see a peak hereabouts.

BUT we are also potentially seeing a re-emergence of the bullish strength that lifted the market up from November, and I am seeing another cash-build up ready to be used, and I am seeing momentum to the upside increasing.

I think that yesterday may have been an important break proving the Bulls' aggressive intentions and we might be looking at a runaway breakaway situation into a blow off top.

The T volume oscillator is close to breaking a large cash build up line.

We watch the oscillators for clues and price is the leading indicator.

Chart of S&P 500 for 10 February 2017

Be prepared: To receive detailed daily analysis, guidance and the updated daily Buy / Sell trigger levels being generated by the system before the market opens, and intraday alerts when appropriate, please become a Member and Sign up for Alerts & Observations – includes access to Members Area and the Explanatory Notes which explain how this system works.

Disclaimer: This is the diary of a personal trading system, its methodology and the signals that it is producing. You are welcome to follow along but please understand that the information presented here is for educational purposes only. No recommendations are being made to buy, or sell stocks, options or futures contracts. Please consult your own financial advisor before making any investment decisions.


Back in the Jetstream

Having had a little bit of a wobble, in late January – just after our expectation of a peak on 24 January associated with the end of a major arm of the current large T structure – we find ourselves back in the Jetstream and making new all time highs today.

As you can see from the chart below, we have a further out projection for a final peak in this T structure on 27 February or therabouts. Lets give it 2 days extra because there is a 2 day descrepancy in the position of the centrepost of the T structure – the oscillator low is 2 days prior to the price low – giving it a slight shadow.

Chart of S&P 500 for 09 February 2017

As mentioned in the previous free report the oscillator drop from +80 is extremely linear and so my expectation is for a fairly linear move up into the final peak at the end of February, followed by some kind of pause or pullback.

But, as you can see there is already a significant cash-build up occurrring in the T volume oscillator during the Trump rally and the cluster of recent lows could soon become a centre-post for a new T structure IF or WHEN the downward sloping cash build up line is broken to the upside.

We watch the oscillator for clues, but we use price as the leading indicator.

Be prepared for what is coming next.

For more detailed ongoing analysis of the developments in the S&P500 index on a daily basis, please Sign up for daily Alerts & Observations – includes access to Members Area and Explanatory Notes.


Apollonia

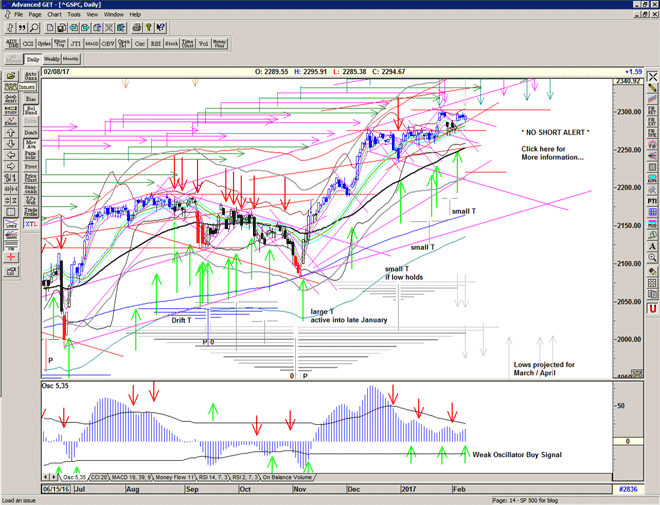
Another strong bounce off the rising gann line from the New Years Eve low and continuing to test the descending resistance from the recent all time highs (at 2294-97).

We will have to break one of these lines soon, perhaps a probe higher to 2315, or a drop down to take a look-see at the 55 Ema, currently at 2253.

Chart of S&P 500 for 09 February 2017

Be prepared: To receive detailed daily analysis, more clarity and explanations, larger images and the updated daily Buy / Sell trigger levels being generated by the system before the market opens, and intraday alerts when appropriate, please become a Member and Sign up for Alerts & Observations – includes access to Members Area and Explanatory Notes.

Disclaimer: This is the diary of a personal trading system, its methodology and the signals that it is producing. You are welcome to follow along but please understand that the information presented here is for educational purposes only. No recommendations are being made to buy, or sell stocks, options or futures contracts. Please consult your own financial advisor before making any investment decisions.


Grind away

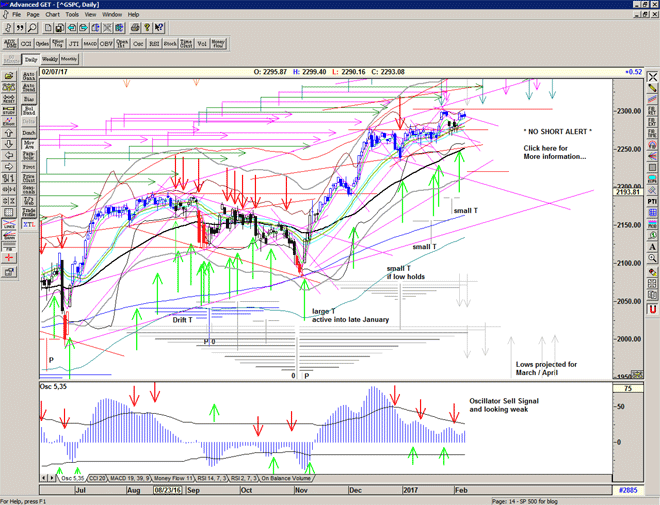
Grind away continues with another rejection at 2300, as the market continues to try to creep higher, in what is becoming a familiar re-test of each significant peak. And re-inforces the current descending resistance line.

A significant break of the range will bring in additional buyers or sellers, but in the meantime we need to remain patient.

Possible turn today/tomorrow with another major arm of the T structure expiring.

Price is still 'on a Buy Signal' but the T volume oscillator refuses to confirm any strength, yet.

Chart of S&P 500 for 08 February 2017

Be prepared: To receive detailed daily analysis, more clarity and explanations, larger images and the updated daily Buy / Sell trigger levels being generated by the system before the market opens, and intraday alerts when appropriate, please become a Member and Sign up for Alerts & Observations – includes access to Members Area and Explanatory Notes.

Disclaimer: This is the diary of a personal trading system, its methodology and the signals that it is producing. You are welcome to follow along but please understand that the information presented here is for educational purposes only. No recommendations are being made to buy, or sell stocks, options or futures contracts. Please consult your own financial advisor before making any investment decisions.


Under pressure

It's the terror of knowing
What this world is about
Watching some good friends
Screaming let me out
Pray tomorrow gets me higher higher high

Under Pressure, Queen & David Bowie, 1982

And sparking on vapors.

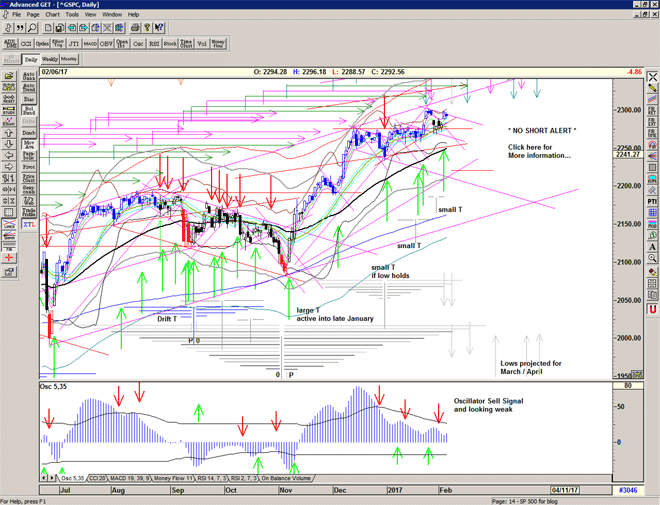
Buy Signal under pressure already due to the strong descending resistance at 2295.
And the T volume oscillator turns back down below zero

Market continues the squeeze and tease, maybe we get a few more pops, and short-covering rallies, but this is the Trump T endgame.

Chart of S&P 500 for 07 February 2017

Be prepared: To receive detailed daily analysis, more clarity and explanations, larger images and the updated daily Buy / Sell trigger levels being generated by the system before the market opens, and intraday alerts when appropriate, please become a Member and Sign up for Alerts & Observations – includes access to Members Area and Explanatory Notes.

Disclaimer: This is the diary of a personal trading system, its methodology and the signals that it is producing. You are welcome to follow along but please understand that the information presented here is for educational purposes only. No recommendations are being made to buy, or sell stocks, options or futures contracts. Please consult your own financial advisor before making any investment decisions.


Squeeze play

Having played all week with the idea of selling, Mr Market decides to re-visit the all time highs with a squeeze play from the perfect 10 position on thursday.

Assuming that this isn't just a pop and drop (which it could be) then we have the possibility of strength into the next arm of the T structure on February 8, but we have significant resistance here to negociate.

This period is very reminiscent of the final few weeks of the the previous T structure associated with the Brexit low in late September – a very choppy and confusing market indeed.

Chart of S&P 500 for 6 February 2017

Be prepared: To receive detailed daily analysis, more clarity and explanations, larger images and the updated daily Buy / Sell trigger levels being generated by the system before the market opens, and intraday alerts when appropriate, please become a Member and Sign up for Alerts & Observations – includes access to Members Area and Explanatory Notes.

Disclaimer: This is the diary of a personal trading system, its methodology and the signals that it is producing. You are welcome to follow along but please understand that the information presented here is for educational purposes only. No recommendations are being made to buy, or sell stocks, options or futures contracts. Please consult your own financial advisor before making any investment decisions


Libra

“There's always more to it.
This is what history consists of.
It is the sum total of the things they aren't telling us.”

Don DeLillo, Libra (1988)

Market sits at a perfect 10 and ready for a squeeze – balanced at the 10 day ema in a tight triangle with the averages compressing. Hmm what gives? Expect some volatility soon.

Chart of S&P 500 for 03 February 2017

Be prepared: To receive detailed daily analysis, more clarity and explanations, larger images and the updated daily Buy / Sell trigger levels being generated by the system before the market opens, and intraday alerts when appropriate, please become a Member and Sign up for Alerts & Observations – includes access to Members Area and Explanatory Notes.

Disclaimer: This is the diary of a personal trading system, its methodology and the signals that it is producing. You are welcome to follow along but please understand that the information presented here is for educational purposes only. No recommendations are being made to buy, or sell stocks, options or futures contracts. Please consult your own financial advisor before making any investment decisions


Pop n Drop

As suspected the market ran from Sell trigger level to Buy trigger level at 2288 and reversed at the descending resistance line.
This is Chopshop behaviour and occurs when the balance of forces are too equal and the market is in the Mid-channel area
This may continue for a while but ultimately a volatile exit will occur because this sets up a squeeze.

Yesterday another arm of the large T structure expired adding credence to a peak, and the OSC oscillator gives up its recent strength.

And at the moment 2288 looks like a gap close and good bye to the island above.
Damage done.

It won't take much to push this vulnerable market over now.

Chart of S&P 500 for 02 February 2017

Be prepared: To receive detailed daily analysis, more clarity and explanations, larger images and the updated daily Buy / Sell trigger levels being generated by the system before the market opens, and intraday alerts when appropriate, please become a Member and Sign up for Alerts & Observations – includes access to Members Area and Explanatory Notes.

Disclaimer: This is the diary of a personal trading system, its methodology and the signals that it is producing. You are welcome to follow along but please understand that the information presented here is for educational purposes only. No recommendations are being made to buy, or sell stocks, options or futures contracts. Please consult your own financial advisor before making any investment decisions.


Holding on

I know what this is…
I have seen one before, many many years ago.
It belonged to a man in a half-remembered dream.
A man possessed of some radical notion.

Inception (2010), Dir. Christopher Nolan

Another short-covering rally off the important 2268 level, and back in the chopshop.
Another important arm of the T structure expires today, and the beginnings of a descending resistance line forming.
But holding onto the short term rising support line, for now.

Chart of S&P 500 for 01 February 2017

Be prepared: To receive detailed daily analysis, more clarity and explanations, larger images and the updated daily Buy / Sell trigger levels being generated by the system before the market opens, and intraday alerts when appropriate, please become a Member and Sign up for Alerts & Observations – includes access to Members Area and Explanatory Notes.

Disclaimer: This is the diary of a personal trading system, its methodology and the signals that it is producing. You are welcome to follow along but please understand that the information presented here is for educational purposes only. No recommendations are being made to buy, or sell stocks, options or futures contracts. Please consult your own financial advisor before making any investment decisions.