Waiting for a Train

I'll tell you a riddle.
You're waiting for a train…
A train that will take you far away. ..
You know where you hope this train will take you…
but you don't know for sure…
But it doesn't matter.
How can it not matter to you where that train will take you?
… Because you'll be together.

Inception (2010), Dir. Christopher Nolan

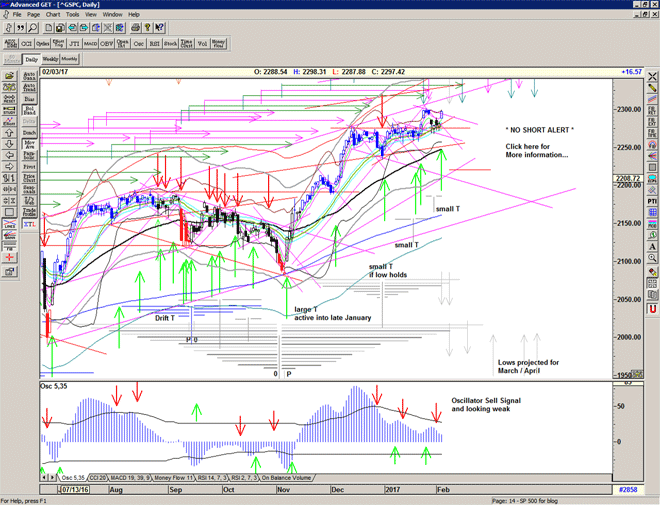
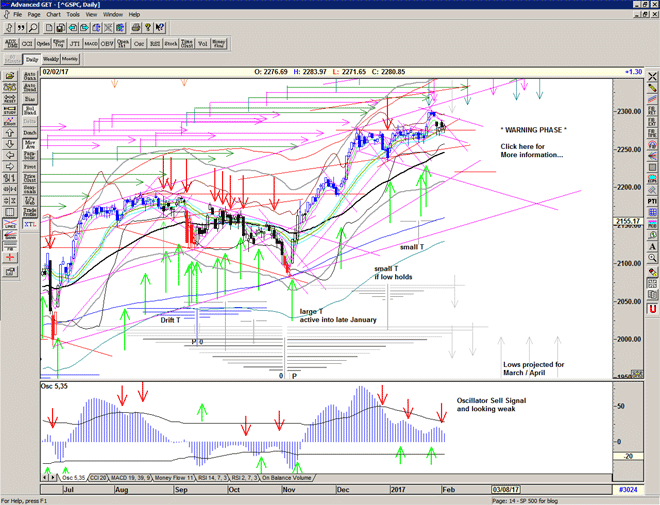
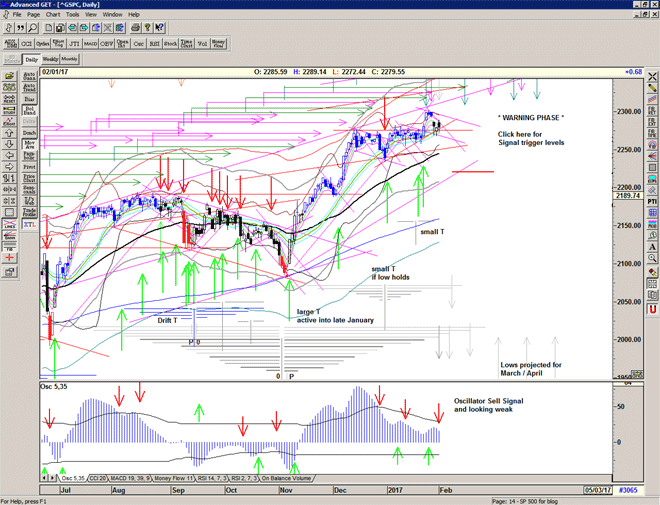
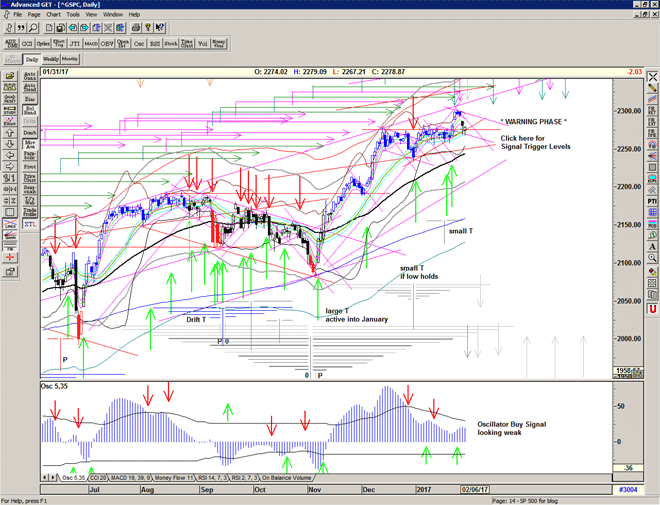
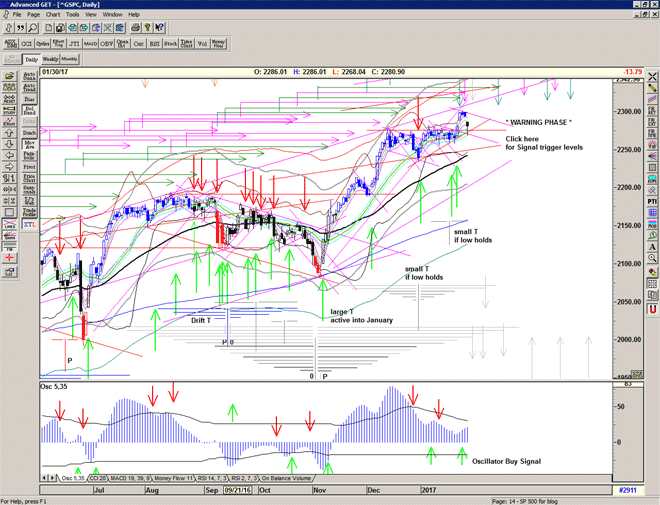
Cover Signal yesterday due to the move below 2283, and now we await the next Signal.
Strong short-covering rally off the short term support line, but the market has been significantly weakened.

Chart of S&P 500 for 31 January 2017

Be prepared: To receive detailed daily analysis, more clarity and explanations, larger images and the updated daily Buy / Sell trigger levels being generated by the system before the market opens, and intraday alerts when appropriate, please become a Member and Sign up for Alerts & Observations – includes access to Members Area and Explanatory Notes.

Disclaimer: This is the diary of a personal trading system, its methodology and the signals that it is producing. You are welcome to follow along but please understand that the information presented here is for educational purposes only. No recommendations are being made to buy, or sell stocks, options or futures contracts. Please consult your own financial advisor before making any investment decisions.


Echo high indeed

A lovely start to the week with a drop down to potential support at 2274, inline with the Echo High and a gap down lower suggesting that we did see the end of the major arm of the T structure

Watch out for a short term bounce here, but at the moment those highs look a bit lonely like an island reversal.

Are we there yet?

A good question and one that many will be asking as the Dow finds itself above 20k and the S&Ps near 2300.
And so now is a good time to check the major T structure.

As you can see there was an expectation to move into a peak around the 24-25 January but because of the choppy behaviour in mid January and the movement through and below the important rising gann line from the low, it seemed a long time coming and uncertain.

Looking at the previous bull run off the 'Brexit' low a similar thing happened just after the major arm (from the previous major peak) of the T structure expired. On that occasion, the market attempted to recover and then subsequently collapsed. A kiss good bye of the rising line, if you will.

Chart of S&P 500 for 29 January 2017

Unfortunately the T volume oscillator seems to be struggling at a similar juncture, leading me to think that we may be about to see a similar pattern of behaviour, and further weakness in price and/or the oscillator would give that more credence.

Of course we still have a final projection for the T structure for late February and the oscillator drop from the peak (at +80) is steep and linear, indicating consistent selling at that time. That would suggest a linear move into the late February peak.

Whether we get a significant drop here or not remains to be seen, and that will determine whether the final peak is a higher high or a lower high.

We watch the oscillator for clues, but we use price as the leading indicator.

Be prepared for whatever comes next.

For more detailed ongoing analysis of the developments in the S&P500 index on a daily basis, please Sign up for daily Alerts & Observations – includes access to Members Area and Explanatory Notes.

Echo high?

Battle to hold 2295 as market takes a little bit of a breather, and looking like we are close to another major turn on (or near to) the Echo high.

Chart of S&P500 for 28 January 2017

Be prepared: To receive detailed daily analysis, more clarity and explanations, larger images and the updated daily Buy / Sell trigger levels being generated by the system before the market opens, and intraday alerts when appropriate, please become a Member and Sign up for Alerts & Observations – includes access to Members Area and Explanatory Notes.

Disclaimer: This is the diary of a personal trading system, its methodology and the signals that it is producing. You are welcome to follow along but please understand that the information presented here is for educational purposes only. No recommendations are being made to buy, or sell stocks, options or futures contracts. Please consult your own financial advisor before making any investment decisions.


Pause to digest

“… how important it is in life not necessarily to be strong but to feel strong,
to measure yourself at least once, to find yourself at least once…”
Primo Levi

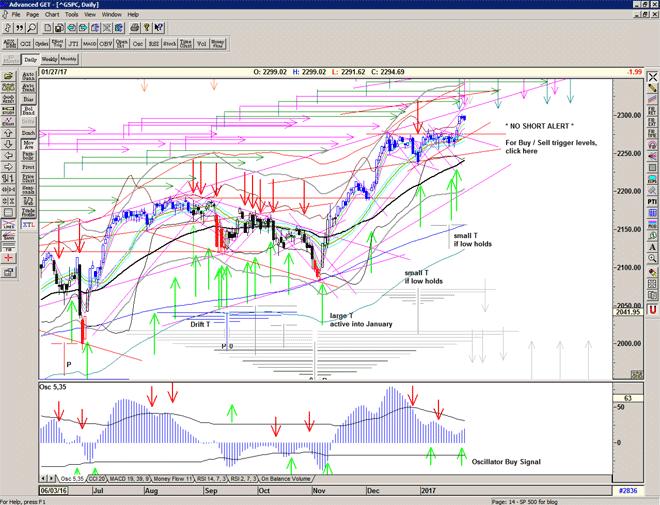
A pause to digest the recent move to new highs and make a decision whether to continue higher or to re-visit the previous range first.
Strong resistance just above and scheduled highs to negociate.

Chart of S&P 500 for 27 January 2017

Be prepared: To receive detailed daily analysis, more clarity and explanations, larger images and the updated daily Buy / Sell trigger levels being generated by the system before the market opens, and intraday alerts when appropriate, please become a Member and Sign up for Alerts & Observations – includes access to Members Area and Explanatory Notes.

Disclaimer: This is the diary of a personal trading system, its methodology and the signals that it is producing. You are welcome to follow along but please understand that the information presented here is for educational purposes only. No recommendations are being made to buy, or sell stocks, options or futures contracts. Please consult your own financial advisor before making any investment decisions.

Gap and go

A lovely gap open and rally into the close. Lots of cheers for Dow at 20k and S&Ps at 2299.

Very close to the underneath of the rising line so any failure here has the potential to be a kiss good bye, and also very close to the long term rising trend line from April and August of 2016.

That being said the market looks in great shape with a powerful squeeze underway and the T structure very much alive.

We will keep alert for signs of a turn.

Enjoy your slice of Trump pie while it lasts.

Chart of S&P 500 for 26 January 2017

Be prepared: To receive detailed daily analysis, more clarity and explanations, larger images and the updated daily Buy / Sell trigger levels being generated by the system before the market opens, and intraday alerts when appropriate, please become a Member and Sign up for Alerts & Observations – includes access to Members Area and Explanatory Notes.

Disclaimer: This is the diary of a personal trading system, its methodology and the signals that it is producing. You are welcome to follow along but please understand that the information presented here is for educational purposes only. No recommendations are being made to buy, or sell stocks, options or futures contracts. Please consult your own financial advisor before making any investment decisions.


Way to go

S/T Buy Signal re-confirmed with move out of the chopshop and congestion of the past few days, and the rise in the T volume oscillator confirms the possibility of a small T with potential into the end of the month.

The conflict of course is the arm of the larger T structure that expired yesterday, and a cluster of scheduled highs today into Friday, and so it remains to be seen whether this has a major or minor effect – a turnaround or a choppy grind higher.

Chart of S&P 500 for 25 January 2017

Be prepared: To receive detailed daily analysis, more clarity and explanations, larger images and the updated daily Buy / Sell trigger levels being generated by the system before the market opens, and intraday alerts when appropriate, please become a Member and Sign up for Alerts & Observations – includes access to Members Area and Explanatory Notes.

Disclaimer: This is the diary of a personal trading system, its methodology and the signals that it is producing. You are welcome to follow along but please understand that the information presented here is for educational purposes only. No recommendations are being made to buy, or sell stocks, options or futures contracts. Please consult your own financial advisor before making any investment decisions.

Chopshop

Straight back down and playing with the Sell Signal level, for another bounce, maybe short term.

We've been here before and this is what seems to happen when the short term channel combines with the the mid-channel area – the market forces become too stable and therefore directionless, lets call this phenomenon Chopshop.

Of course, this phenomenon is also a squeeze in the making.

So watch out for an exit from the mid-channel sometime soon – above 2277 or below 2255 for signs of a strong directional move.

Chart of S&P 500 for 24 January 2017

Be prepared: To receive detailed daily analysis, more clarity and explanations, larger images and the updated daily Buy / Sell trigger levels being generated by the system before the market opens, and intraday alerts when appropriate, please become a Member and Sign up for Alerts & Observations – includes access to Members Area and Explanatory Notes.

Disclaimer: This is the diary of a personal trading system, its methodology and the signals that it is producing. You are welcome to follow along but please understand that the information presented here is for educational purposes only. No recommendations are being made to buy, or sell stocks, options or futures contracts. Please consult your own financial advisor before making any investment decisions.


Weak Buy Signal

Buy Signal triggered in early trade at 2274, but quickly under threat from descending resistance.
Held above important support but triangulating now, outsized move coming up soon.

There is the possibilty of some follow through into several scheduled peaks early next week, but it does seem likely that there is a significant correction coming soon.

SKEW remains elevated indicating the prescence of fear and possibility of an unexpected event, a black swan.
I suspect that this is related to comments regarding the strength of the dollar.
Keep an eye on this – it is flashing a big red warning.

Chart of S&P 500 for 23 January 2017


Be prepared: To receive detailed daily analysis, more clarity and explanations, larger images and the updated daily Buy / Sell trigger levels being generated by the system before the market opens, and intraday alerts when appropriate, please become a Member and Sign up for Alerts & Observations – includes access to Members Area and Explanatory Notes.

Disclaimer: This is the diary of a personal trading system, its methodology and the signals that it is producing. You are welcome to follow along but please understand that the information presented here is for educational purposes only. No recommendations are being made to buy, or sell stocks, options or futures contracts. Please consult your own financial advisor before making any investment decisions.