Three Kings presents

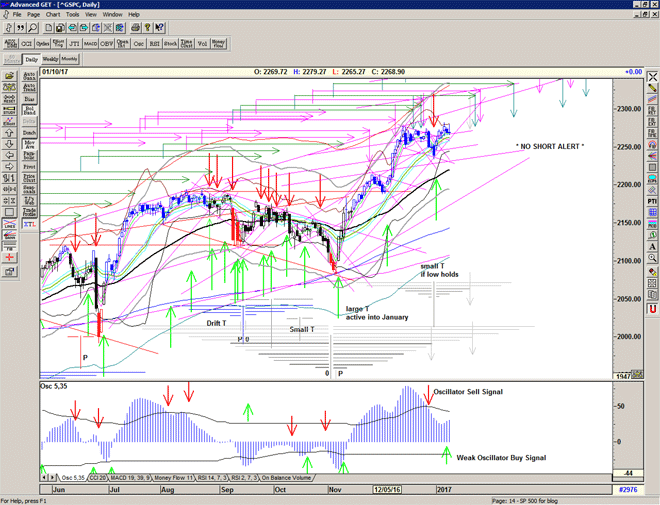
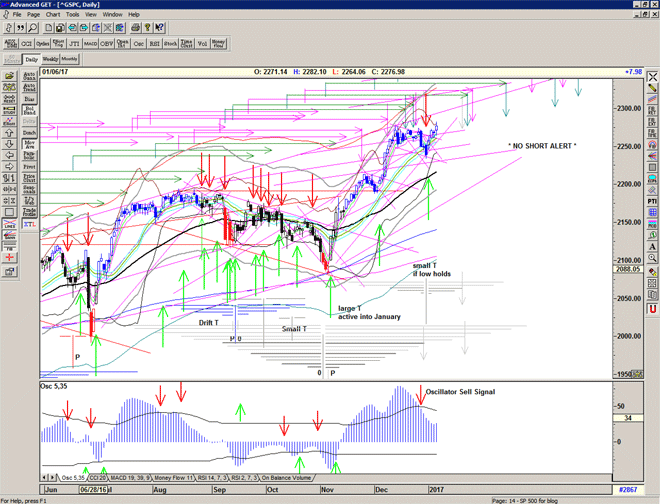
Three Kings presents the Dow to 20k (well near enough for rock n roll), and aside from a push outside of the bollinger I cant see any good reason to sell. The structure is looking good for a climb into MLK and into the Inauguration to complete the next major arms of the T structure.

If the strength continues, the immediate target is 2293-5, and then a Fibonacci extension of the last rally, in line with the previous one, projects 2320s.

Having said that, lots of selling on Friday under the hood as indicated by the T volume oscillator's drop back to near zero, so we should keep an eye on this for any hints of a failure.

Chart of S&P 500 for 09 January 2017

Be prepared: To receive detailed analysis, more clarity and the updated daily Buy / Sell levels being generated by the system before the market opens, please Sign up for Alerts & Observations – includes access to Members Area and Explanatory Notes

Disclaimer: This is the diary of a personal trading system, its methodology and the signals that it is producing. You are welcome to follow along but please understand that the information presented here is for educational & entertainment purposes only. No recommendations are being made to buy, or sell stocks, options or futures contracts. Please consult your own financial advisor before making any investment decisions.


Three Kings

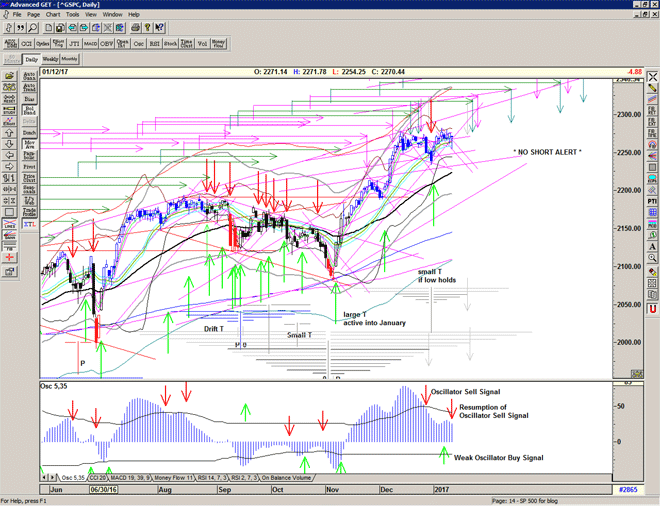
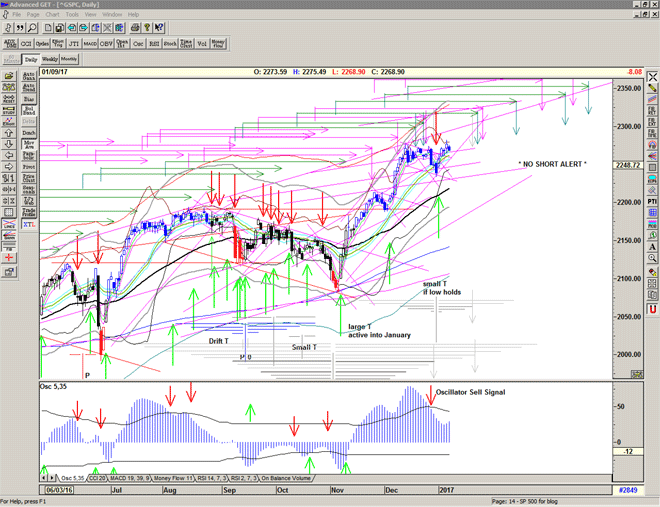
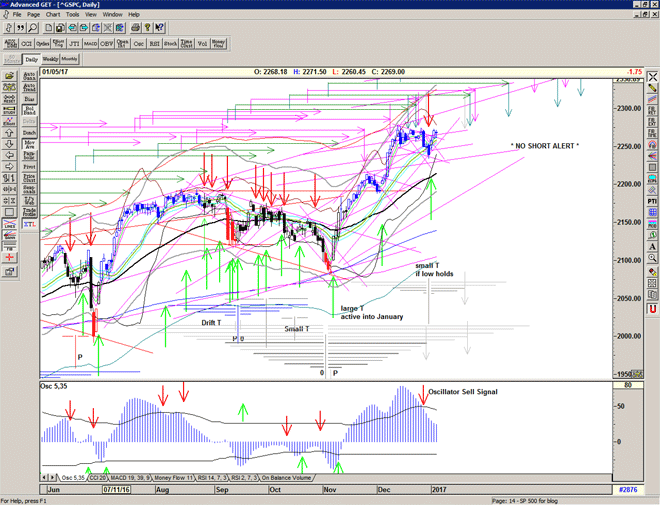
No follow through and an inside day, and tightening bollinger bands as the market sits just below all time highs.
No reason to complain just yet but the oscillator Sell Signal is still active and this is still suggesting that the market may struggle to go higher in the short term, and so the next scheduled highs may not be much higher.

Chart of S&P 500 for 06 January 2016

Be prepared: To receive detailed analysis, more clarity and the updated daily Buy / Sell levels being generated by the system before the market opens, please Sign up for Alerts & Observations – includes access to Members Area and Explanatory Notes

Disclaimer: This is the diary of a personal trading system, its methodology and the signals that it is producing. You are welcome to follow along but please understand that the information presented here is for educational & entertainment purposes only. No recommendations are being made to buy, or sell stocks, options or futures contracts. Please consult your own financial advisor before making any investment decisions.


Twelfth Night

If music be the food of love, play on.

William Shakepeare, Twelfth Night

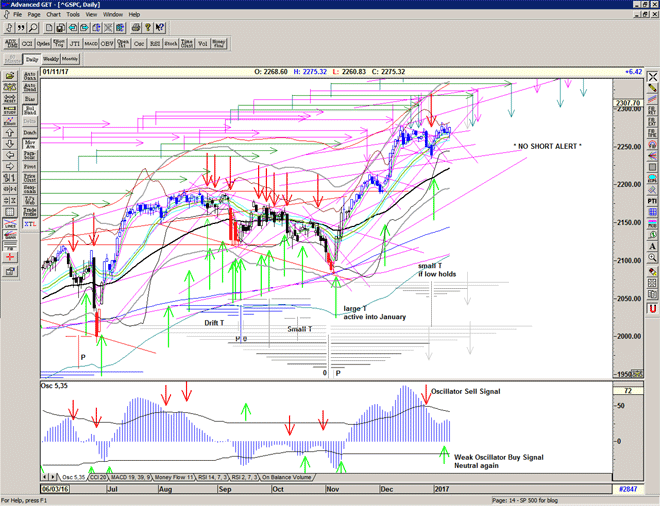
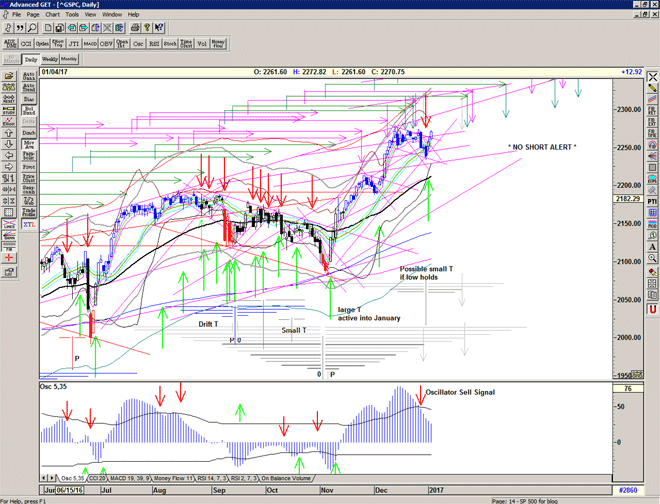
A strong move up above the descending resistance and now at the horizontal.
T volume oscillator turns positive and further confirms the small T into the Inauguration which now looks like another high..

Chart of S&P 500 for 05 January 2017

Be prepared: To receive detailed analysis, more clarity and the updated daily Buy / Sell levels being generated by the system before the market opens, please Sign up for Alerts & Observations – includes access to Members Area and Explanatory Notes

Disclaimer: This is the diary of a personal trading system, its methodology and the signals that it is producing. You are welcome to follow along but please understand that the information presented here is for educational & entertainment purposes only. No recommendations are being made to buy, or sell stocks, options or futures contracts. Please consult your own financial advisor before making any investment decisions.


Hopscotch

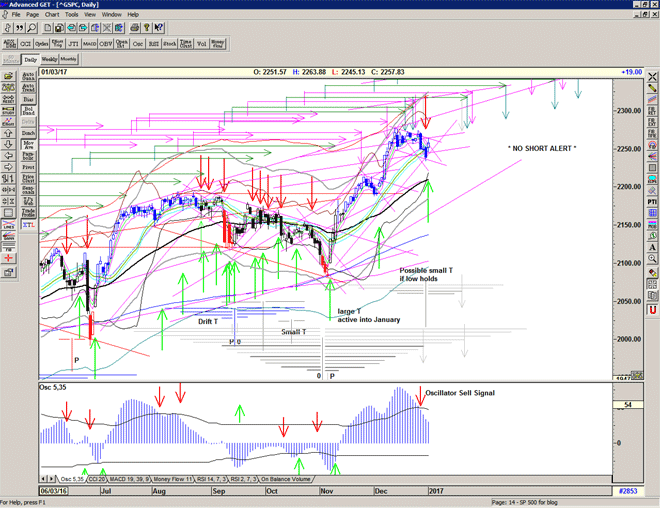
Technically a significant improvement yesterday as the market lifts out of the Short Alert.

The small T drawn has been activated by the T volume oscillator and should use the cash-build up from the December oscillator peaks, and this projects highs for MLK and the Inauguration, in line with the larger T structure.

However we are not clear of the descending resistance line (yet), and so we should keep an open mind as any further weakness would reactivate the previous short signal.

Chart of S&P 500 for 04 January 2017

Be prepared: To receive detailed analysis, more clarity and the updated daily Buy / Sell levels being generated by the system before the market opens, please Sign up for Alerts & Observations – includes access to Members Area and Explanatory Notes

Disclaimer: This is the diary of a personal trading system, its methodology and the signals that it is producing. You are welcome to follow along but please understand that the information presented here is for educational & entertainment purposes only. No recommendations are being made to buy, or sell stocks, options or futures contracts. Please consult your own financial advisor before making any investment decisions.


Fireworks for the New Year

Sent to my readers prior to the open:

And a very warm welcome to 2017

As mentioned, the first test would be last week's pullback to the rising Gann line at 2135 and as we can see the Futures are indicating a strong open and a successful test.

Very Short Term bullish above 2244, and an S/T Buy Signal is confirmed above 2256.

Ideally we also would like to see the T volume oscillator move above zero to activate a small T with strength into MLK.

And so an S/T Buy Signal at the open at 2256.
Market fizzled but held onto the Buy Signal (and above the Sell signal level) into the close


Entrance

All the world’s a stage,
And all the men and women merely players;
They have their exits and their entrances,
And one man in his time plays many parts,
His acts being seven ages…

– William Shakespeare, As You Like It

Enter a New Year full of excitement, complexity and high speed trading.
Market pushed down into the rising Gann line from the November 4 low and held.
This is the first test for 2017.

A bounce here would potentially project new all time highs at the next cluster of highs scheduled for 21-26 January.
If the market continues lower then we may meet the 55 ema at about 2210 – previous resistance now possible support.

Either way we are now looking for a low and a small T to take us into the next series of peaks.

Chart of S&P 500 for 01 January 2017
 

Be prepared: To receive detailed analysis, more clarity and the updated daily Buy / Sell levels being generated by the system before the market opens, please Sign up for Alerts & Observations – includes access to Members Area and Explanatory Notes

Disclaimer: This is the diary of a personal trading system, its methodology and the signals that it is producing. You are welcome to follow along but please understand that the information presented here is for educational & entertainment purposes only. No recommendations are being made to buy, or sell stocks, options or futures contracts. Please consult your own financial advisor before making any investment decisions.


Two Thousand Seventeen

In the last report, which was just prior to the Fed meeting I discussed the current T structure and the expectation of highs associated with ends of the various arms of the T scheduled for the week of December 13 and then New Year, and then late January and possibly late February. Possibly higher highs but not necessarily.

As we can see, we did indeed get an important high at the end of the 2nd major arm of the T on December 13 and we have now seen the 3rd major arm complete yesterday, and with the declining momentum since then we have found the market struggling to make new highs.

Chart of S&P500 for 31 December 2016

Although the market peaked on December 13, after numerous warnings from the Arms index, Put Call ratios and Relative Strength, price didn't actually make a formal 'Cover' Signal until December 28, and didn't yet make a Sell Signal, as it plays in the vicinity of what I call the Mid-Channel – an important bull/bear line for short term direction.

And so moving into an exciting New Year full of new expectations due to all of the political changes associated with the Trump election.

I am looking for a stabilisation period to be resolved before the next move higher as the market re-charges after that exuberant move in early December. As we can see from the T Structure projecting further highs in January (13th and 21st) and in February (16th and 24th), and also from the prescence of a cash-build up from the recent oscillator highs that can form a small T structure that could project into those same time frames. These may be highs but not necessarily higher highs, especially given the noticeable drag on momentum since December 13.

Be prepared for whatever comes next.

For more detailed ongoing analysis of the developments in the S&P500 index on a daily basis, please Sign up for daily Alerts & Observations – includes access to Members Area and Explanatory Notes.

Wishing you all a 'Very' New Year and much Prosperity.


Countdown into 2017

Last trading day of the year and getting ready for a party to bring in the New Year.

Market playing with the mid-point and getting ready for the next move – perhaps an early January attack at 2300 to salute Donald Trump's inauguration – that would fit in with the T structure.

Or if we fail the rising support at 2235-40 – perhaps a nervous look-see at the 55 ema in the 2210s and/or lower boundary in the upper 2170s before rising into the next scheduled highs around 21 January – and that would also fit in with the T structure.

A 'Very' New Year Everyone …

Chart of S&P 500 for 30 December 2016

To receive further analysis, more clarity and the updated daily Buy / Sell levels being generated by the system before the market opens, please Sign up for Alerts & Observations

Disclaimer: This is the diary of a personal trading system, its methodology and the signals that it is producing. You are welcome to follow along but please understand that the information presented here is for educational & entertainment purposes only. No recommendations are being made to buy, or sell stocks, options or futures contracts. Please consult your own financial advisor before making any investment decisions.


Cover at 2258

Cover Signal at 2258 as a lack of buyers at 2270 coincides with the decline in momentum and reinforced by OSC oscillator Sell Signal.

S/T Sell signal not yet triggered and we have strong rising support lines but according to the T structure this is the downdraft from the September 12 bounce and another arm of the T structure expires tomorrow suggesting that we may suffer a lack of buying power into New Year whilst the market stabilises.

Chart of S&P 500 for 29 December 2016

To receive further analysis, more clarity and the updated daily Buy / Sell levels being generated by the system before the market opens, please Sign up for Alerts & Observations

Disclaimer: This is the diary of a personal trading system, its methodology and the signals that it is producing. You are welcome to follow along but please understand that the information presented here is for educational & entertainment purposes only. No recommendations are being made to buy, or sell stocks, options or futures contracts. Please consult your own financial advisor before making any investment decisions.