Freeze it

“That's why we seize the moment try to freeze it and own it, squeeze it and hold it.”
Eminem

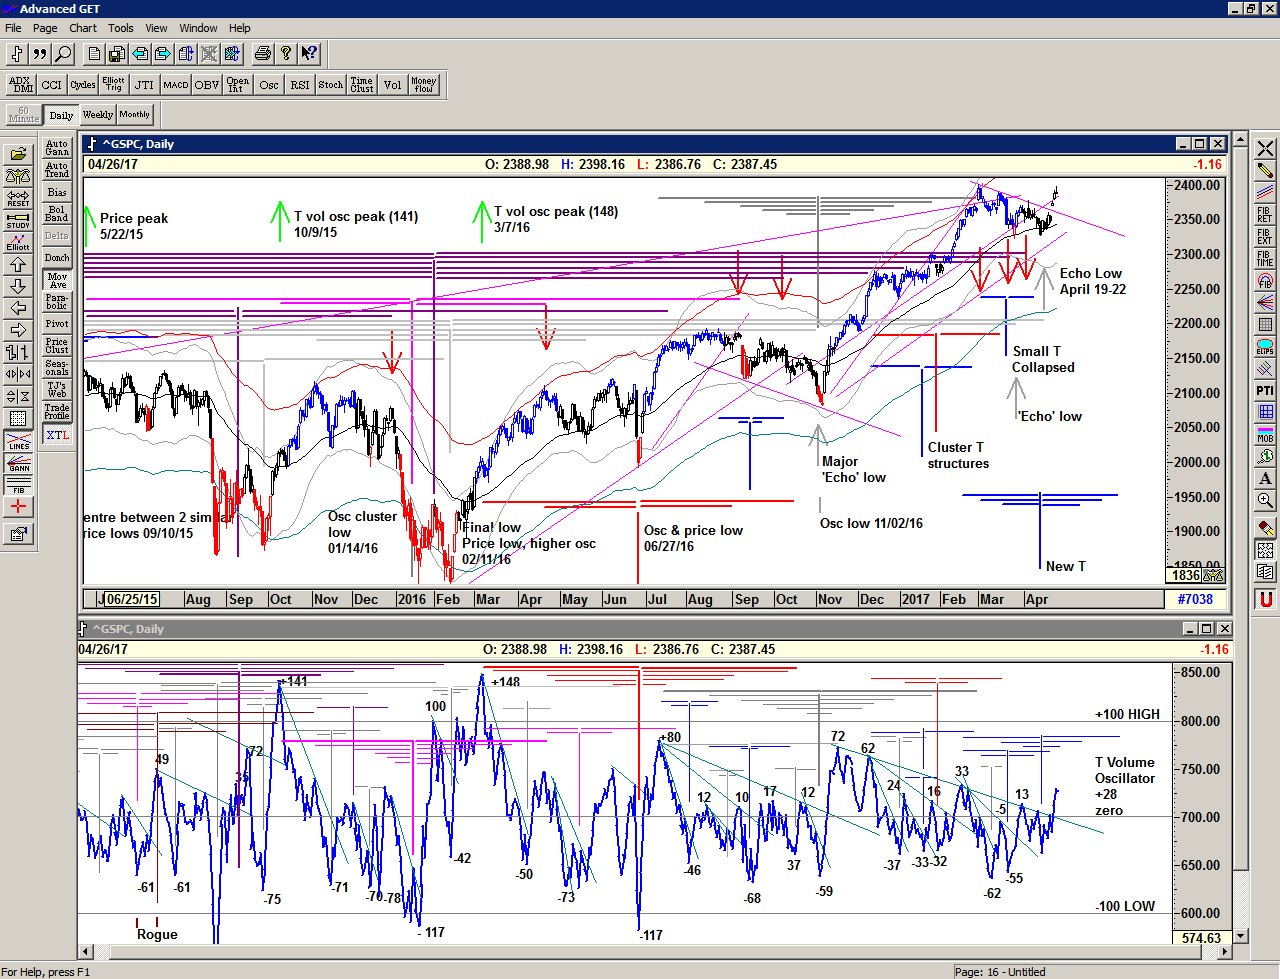
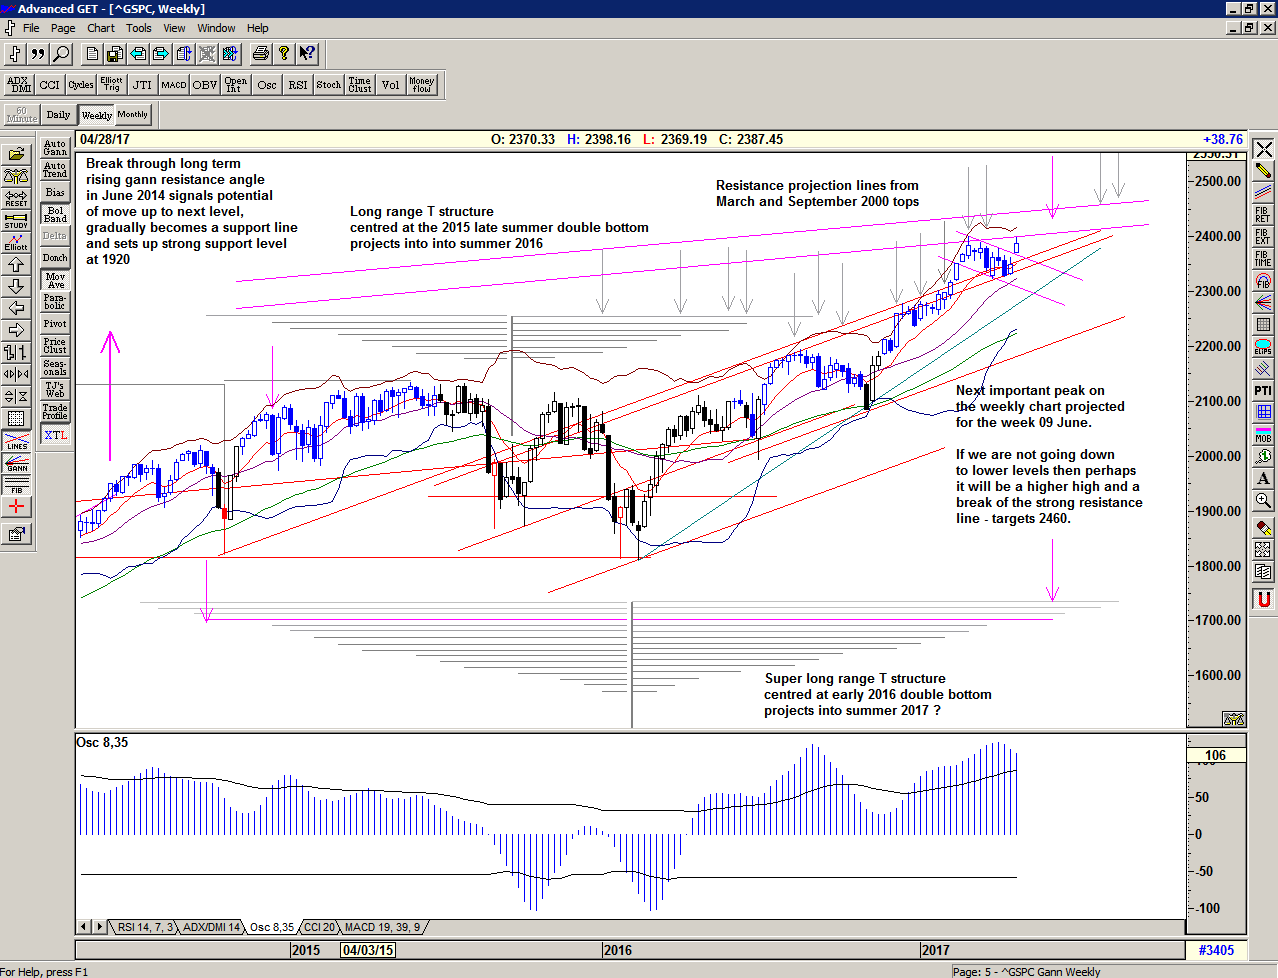
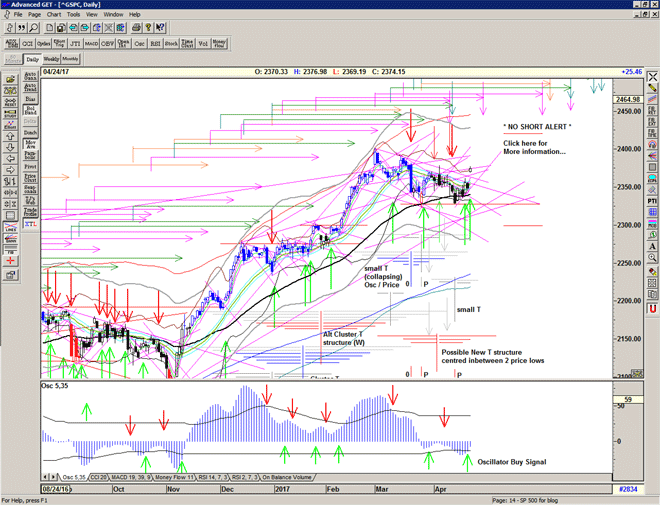
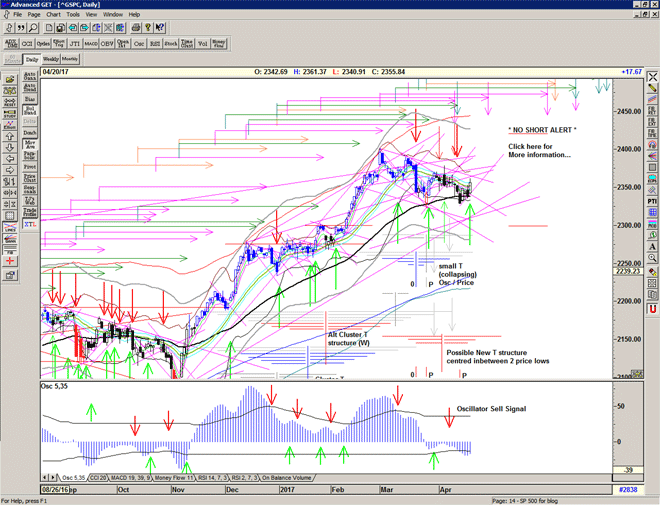
A short term Buy Signal as the squeeze and triangle pattern resolves to the upside, and at least for now, there is an attempt to move out of the descending channel.

Of course stiffer resistance lies above in the 2360s and 2370s, so this may be a short term move.

The T volume oscillator recovers back just above zero and continues to show bullish divergence in breadth.

The small collapsing T with the oscillator low at the 21 March drop and price low on 27 March expires today and this could present a high in the market. Further strength into May could be attributed to an amalgamation of the recent lows in price and oscillator but that remains to be seen.

Chart of S&P 500 for 21 April 2017

Be prepared for whatever comes next:

To receive detailed daily analysis, guidance and the updated daily Buy / Sell trigger levels being generated by the Trading the Line system before the market opens, and intraday alerts when appropriate, become a Member and Sign up for Alerts & Observations – includes access to Members Area and the Explanatory Notes for all of the concepts discussed.

Disclaimer: This is the diary of a personal trading system, its methodology and the signals that it is producing. You are welcome to follow along but please understand that the information presented here is for educational purposes only. No recommendations are being made to buy, or sell stocks, options or futures contracts. Please consult your own financial advisor before making any investment decisions.


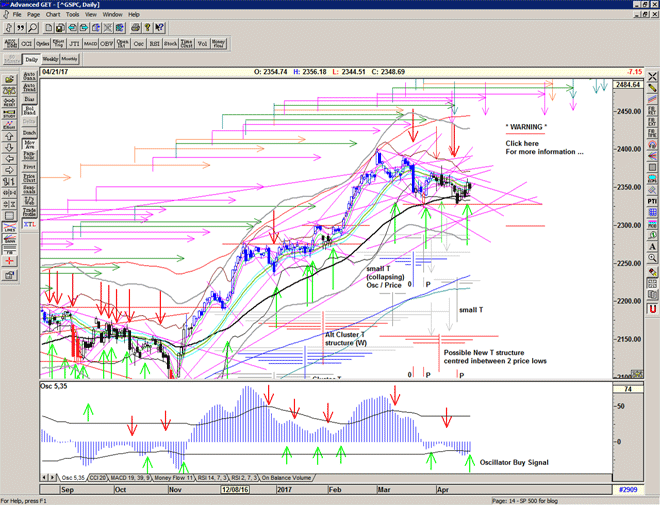
S/T BUY Signal above 2348

A nice strong push upwards off the support line at 2341 finds the market playing at the upper level again and IF the market holds onto the gains, we have a Buy Signal above 2348.

As with yesterday, if this is sold into it and the market is going to continue its choppy range-bound behaviour then a visit back down to the recent support levels may be in order.

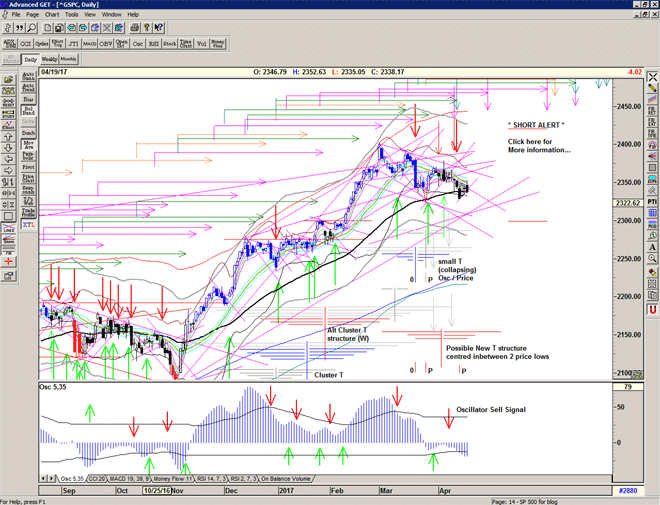
Gap up and down

Yet another failed Bull move as sellers take out the gap up and push it back down to the 55 ema.
Sell signal still very active.

Chart of S&P 500 for 20 April 2017

Be prepared for whatever comes next:

To receive detailed daily analysis, guidance and the updated daily Buy / Sell trigger levels being generated by the Trading the Line system before the market opens, and intraday alerts when appropriate, become a Member and Sign up for Alerts & Observations – includes access to Members Area and the Explanatory Notes for all of the concepts discussed.

Disclaimer: This is the diary of a personal trading system, its methodology and the signals that it is producing. You are welcome to follow along but please understand that the information presented here is for educational purposes only. No recommendations are being made to buy, or sell stocks, options or futures contracts. Please consult your own financial advisor before making any investment decisions.


Expeditus

No follow through on monday's relief rally, and an inside day holding up above the 55 and forming yet another triangle.

Tightening bollingers indicate a squeeze in process.

Chart of S&P 500 for 19 April 2017

Be prepared for whatever comes next:

To receive detailed daily analysis, guidance and the updated daily Buy / Sell trigger levels being generated by the Trading the Line system before the market opens, and intraday alerts when appropriate, become a Member and Sign up for Alerts & Observations – includes access to Members Area and the Explanatory Notes for all of the concepts discussed.

Disclaimer: This is the diary of a personal trading system, its methodology and the signals that it is producing. You are welcome to follow along but please understand that the information presented here is for educational purposes only. No recommendations are being made to buy, or sell stocks, options or futures contracts. Please consult your own financial advisor before making any investment decisions.


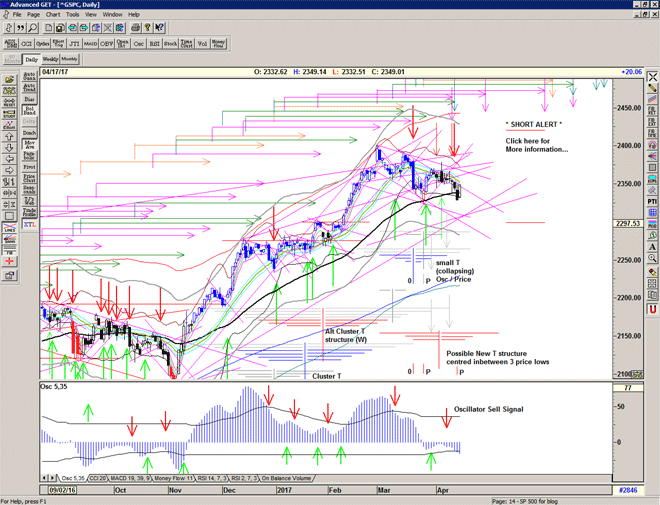
Amalgamation

A snapback rally, back to the Signal levels for a test of previous support from below.

Strength returning above the 55 ema is a positive, as the market aims to put in a double bottom and perhaps launch another attempt at the descending resistance.

It could be just the remains of the small collapsing T, or it could be the amalgamation of the 3 recent lows combining to produce a new possible T structure.

Chart of S&P 500 for 18 April 2017

Be prepared for whatever comes next:

To receive detailed daily analysis, guidance and the updated daily Buy / Sell trigger levels being generated by the Trading the Line system before the market opens, and intraday alerts when appropriate, become a Member and Sign up for Alerts & Observations – includes access to Members Area and the Explanatory Notes for all of the concepts discussed.

Disclaimer: This is the diary of a personal trading system, its methodology and the signals that it is producing. You are welcome to follow along but please understand that the information presented here is for educational purposes only. No recommendations are being made to buy, or sell stocks, options or futures contracts. Please consult your own financial advisor before making any investment decisions.


Easter Falling

The market failed to hold onto the important 55 ema on thursday prior to the holiday weekend, opening up the possibility of a deeper correction. Unless we see a quick recovery the next major support level would be the rising lines at 2310.

Chart of S&P 500 for 17 April 2017

Be prepared for whatever comes next:

To receive detailed daily analysis, guidance and the updated daily Buy / Sell trigger levels being generated by the Trading the Line system before the market opens, and intraday alerts when appropriate, become a Member and Sign up for Alerts & Observations – includes access to Members Area and the Explanatory Notes for all of the concepts discussed.

Disclaimer: This is the diary of a personal trading system, its methodology and the signals that it is producing. You are welcome to follow along but please understand that the information presented here is for educational purposes only. No recommendations are being made to buy, or sell stocks, options or futures contracts. Please consult your own financial advisor before making any investment decisions.


Jefferson

“I'm a greater believer in luck, and I find the harder I work the more I have of it”
– Thomas Jefferson

An S/T Sell Signal below 2350 as gravity takes hold.

More fun again with the market breaking down in early trade and then bouncing off 2341, in a failed repeat rally.

Late afternoon confirmed the jittery feel to the day but 2342 was heavily defended into the close.

Chart of S&P 500 for 13 April 2017

Be prepared for whatever comes next:

To receive detailed daily analysis, guidance and the updated daily Buy / Sell trigger levels being generated by the Trading the Line system before the market opens, and intraday alerts when appropriate, become a Member and Sign up for Alerts & Observations – includes access to Members Area and the Explanatory Notes for all of the concepts discussed.

Disclaimer: This is the diary of a personal trading system, its methodology and the signals that it is producing. You are welcome to follow along but please understand that the information presented here is for educational purposes only. No recommendations are being made to buy, or sell stocks, options or futures contracts. Please consult your own financial advisor before making any investment decisions.


Columbia

Vix Volatility spikes higher on the pink moon and the market quickly sells off to the 55 ema for (only) its 2nd test since November.

A Sell Signal, yes, but cancelled in afternoon trade.

Market recovers, and closes back almost unscathed within the chopshop zone, with just a little extra help at the close.

A double dose of an echo high yesterday and a pulse high today,
and the T volume oscillator turns positive.

Fine entertainment – we should expect more fun today.

Chart of S&P 500 for 12 April 2017

Be prepared for whatever comes next:

To receive detailed daily analysis, guidance and the updated daily Buy / Sell trigger levels being generated by the Trading the Line system before the market opens, and intraday alerts when appropriate, become a Member and Sign up for Alerts & Observations – includes access to Members Area and the Explanatory Notes for all of the concepts discussed.

Disclaimer: This is the diary of a personal trading system, its methodology and the signals that it is producing. You are welcome to follow along but please understand that the information presented here is for educational purposes only. No recommendations are being made to buy, or sell stocks, options or futures contracts. Please consult your own financial advisor before making any investment decisions.


On the range

Oh, give me a home where the Buffalo roam
Where the Deer and the Antelope play;
Where seldom is heard a discouraging word,
And the sky is not cloudy all day.
Home, home on the range…

– Dr. Brewster Higley (1872)

Market very much trapped within the chopshop range, and yet another failed Buy Signal sold into.
Buy at the bottom of the channel and sell at the top until proven otherwise.
Vix moves up significantly. The oscillators improve a little.

Chart of S&P 500 for 11 April 2017

Be prepared for whatever comes next:

To receive detailed daily analysis, guidance and the updated daily Buy / Sell trigger levels being generated by the Trading the Line system before the market opens, and intraday alerts when appropriate, become a Member and Sign up for Alerts & Observations – includes access to Members Area and the Explanatory Notes for all of the concepts discussed.

Disclaimer: This is the diary of a personal trading system, its methodology and the signals that it is producing. You are welcome to follow along but please understand that the information presented here is for educational purposes only. No recommendations are being made to buy, or sell stocks, options or futures contracts. Please consult your own financial advisor before making any investment decisions.


Apprehension

It's either victory, or don't bother. The only thing worth doing is the impossible. Everything else is gray. You're born… as a man… with the nerves of a soldier, the apprehension of an angel, to lift a phrase, but there is no use for it. Here? Where's the use for it? You're set up to be a philosopher or a king or Shakespeare, and this is all they give you? This? Twenty- odd years of school which is all instruction in how to be ordinary…

The Gambler, 2014, Dir: Rupert Wyatt

Market desperately trying to hold onto rising support from the March 27 low and slip sliding into the close. The pattern of failed attempts at higher prices continues.

We also now have a series of projected highs for early next week along with the end of the Alt Cluster T Structure, and the current small T looking weak.

The T volume oscillator fails yet again to climb above zero, and the OSC oscillator rolls over and makes a Sell Signal.

Chart of S&P 500 for 10 April 2017

Be prepared for whatever comes next:

To receive detailed daily analysis, guidance and the updated daily Buy / Sell trigger levels being generated by the Trading the Line system before the market opens, and intraday alerts when appropriate, become a Member and Sign up for Alerts & Observations – includes access to Members Area and the Explanatory Notes for all of the concepts discussed.

Disclaimer: This is the diary of a personal trading system, its methodology and the signals that it is producing. You are welcome to follow along but please understand that the information presented here is for educational purposes only. No recommendations are being made to buy, or sell stocks, options or futures contracts. Please consult your own financial advisor before making any investment decisions.