May the Force be with you

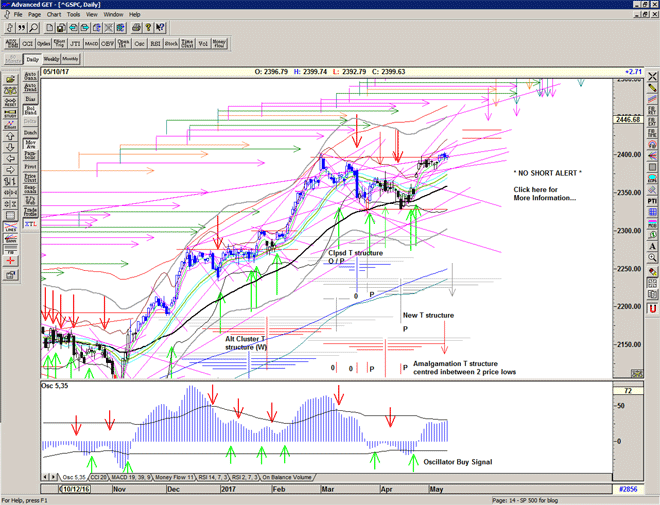
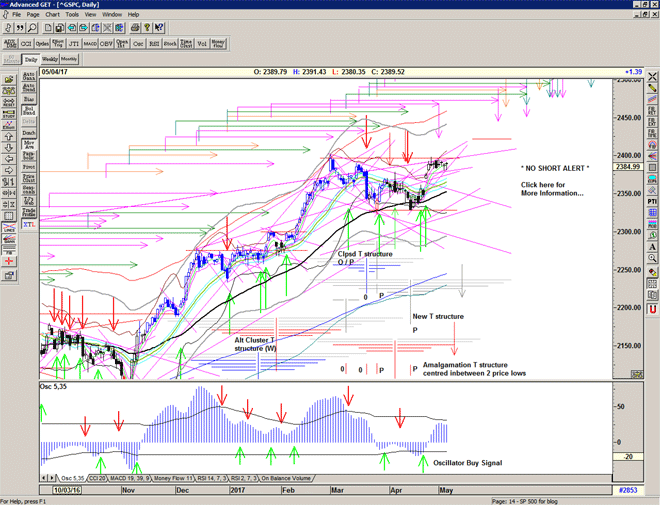
Market found support just above the rising line from the 13 April low and closed back within its recent range near the highs.
Still on a Buy signal and within character.

The oscillators appear to be moving lower now hinting that we may need to see some further downside before resolving to the upside.

Chart of S&P 500 for 04 May 2017

Be prepared for whatever comes next:

To receive detailed daily analysis, guidance and the updated daily Buy / Sell trigger levels being generated by the Trading the Line system before the market opens, and intraday alerts when appropriate, become a Member and Sign up for Alerts & Observations – includes access to Members Area and the Explanatory Notes for all of the concepts discussed.

Disclaimer: This is the diary of a personal trading system, its methodology and the signals that it is producing. You are welcome to follow along but please understand that the information presented here is for educational purposes only. No recommendations are being made to buy, or sell stocks, options or futures contracts. Please consult your own financial advisor before making any investment decisions.


The Third of May

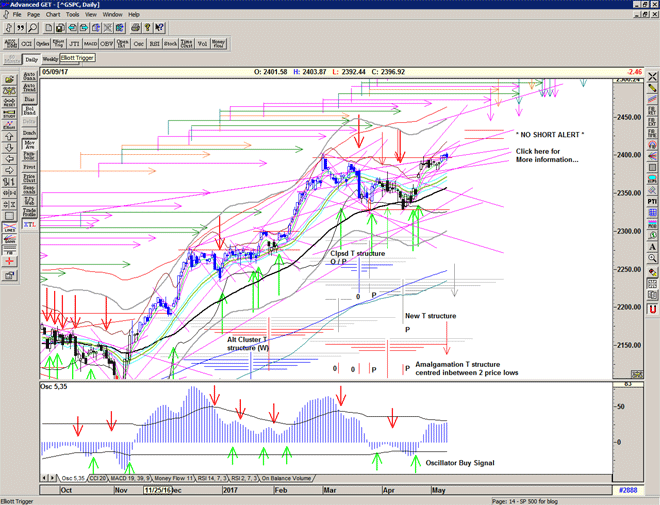
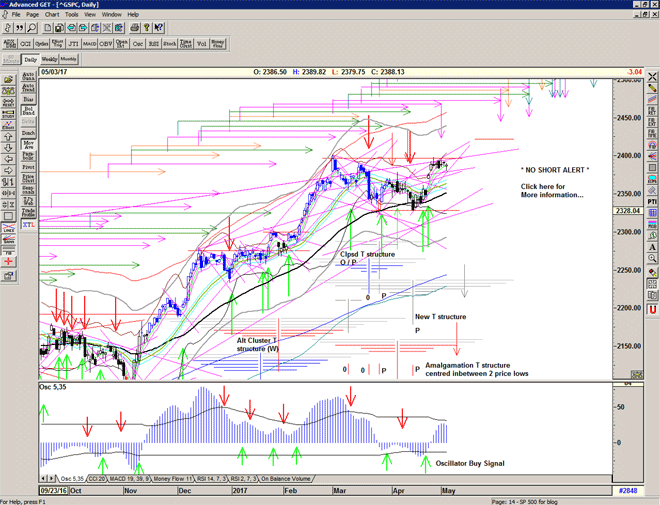
Holding steady on a quiet day, and waiting for direction.
Price pinned close to the highs, waiting for the next phase of the T structure, or the echo high to take effect.
OSc flattening off, and T volume oscillator neutral.

Chart of S&P 500 for 03 May 2017

Be prepared for whatever comes next:

To receive detailed daily analysis, guidance and the updated daily Buy / Sell trigger levels being generated by the Trading the Line system before the market opens, and intraday alerts when appropriate, become a Member and Sign up for Alerts & Observations – includes access to Members Area and the Explanatory Notes for all of the concepts discussed.

Disclaimer: This is the diary of a personal trading system, its methodology and the signals that it is producing. You are welcome to follow along but please understand that the information presented here is for educational purposes only. No recommendations are being made to buy, or sell stocks, options or futures contracts. Please consult your own financial advisor before making any investment decisions.


Dos de Mayo

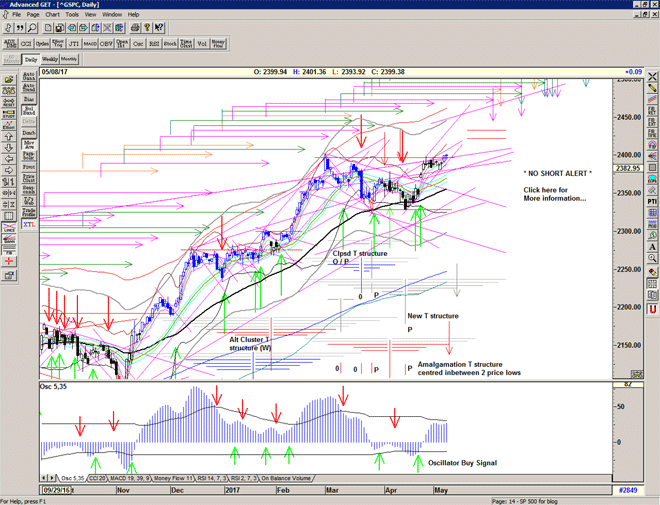
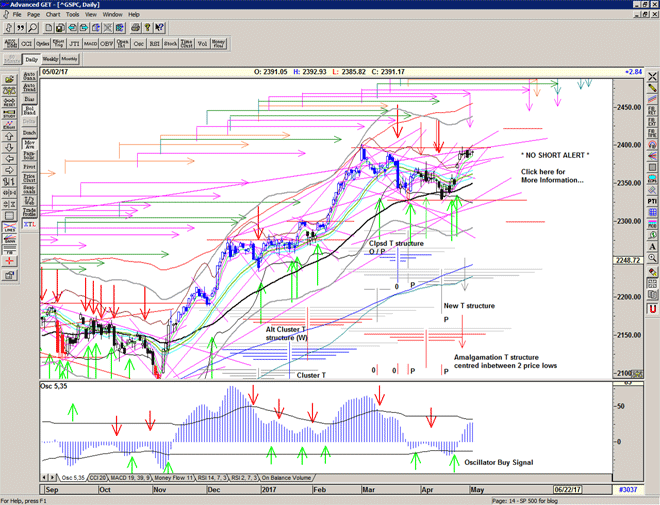
A gentle strike at resistance in 'holiday' trade on the echo high.
Still trapped below the long term resistance line but poised to take on the high.

Chart of S&P500 for 02 May 2017

Be prepared for whatever comes next:

To receive detailed daily analysis, guidance and the updated daily Buy / Sell trigger levels being generated by the Trading the Line system before the market opens, and intraday alerts when appropriate, become a Member and Sign up for Alerts & Observations – includes access to Members Area and the Explanatory Notes for all of the concepts discussed.

Disclaimer: This is the diary of a personal trading system, its methodology and the signals that it is producing. You are welcome to follow along but please understand that the information presented here is for educational purposes only. No recommendations are being made to buy, or sell stocks, options or futures contracts. Please consult your own financial advisor before making any investment decisions.


May Day

Shall I compare thee to a summer's day?
Thou art more lovely and more temperate:
Rough winds do shake the darling buds of May,
And summer's lease hath all too short a date:
Sometime too hot the eye of heaven shines,
And often is his gold complexion dimm'd;
And every fair from fair sometime declines,
By chance or nature's changing course untrimm'd;
But thy eternal summer shall not fade
Nor lose possession of that fair thou owest;
Nor shall Death brag thou wander'st in his shade,
When in eternal lines to time thou growest:
So long as men can breathe or eyes can see,
So long lives this and this gives life to thee.

William Shakespeare (Sonnet 18)


May Day, May Day…

A cry for help, or a traditional spring festival.

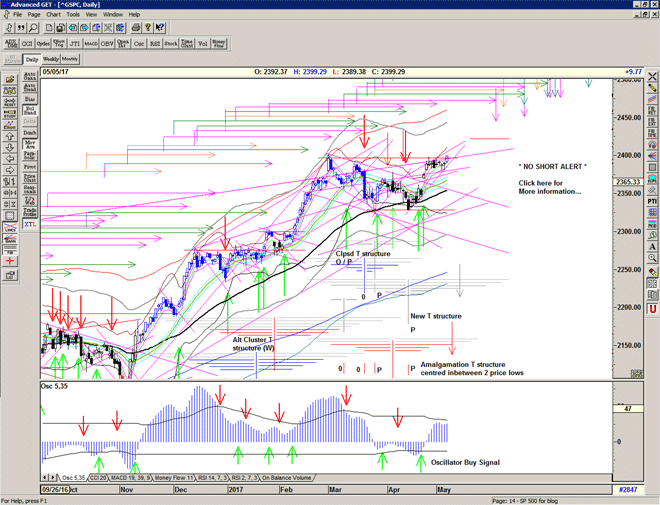
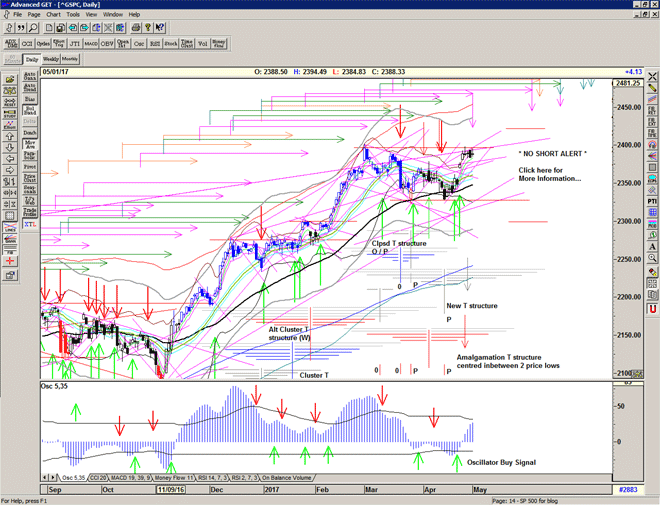
A day of steady but consistent selling (or profit-taking) as the market decides not to advance upon the high, just yet.

The T volume oscillator turns negative and we should keep one eye on this, as that is a potential sell warning signal.
SKEW advances higher indicating the continued prescence of event risk.

The market seems slightly hesitant about moving higher, and so a gentle pullback may be needed first, but so long as we hold onto the rising line from the recent low, and stay above the Mid-channel, it would seem to be just a matter of time before advancing beyond 2400 – it is a bull market.

Chart of S&P 500 for 29 April 2017

Be prepared for whatever comes next:

To receive detailed daily analysis, guidance and the updated daily Buy / Sell trigger levels being generated by the Trading the Line system before the market opens, and intraday alerts when appropriate, become a Member and Sign up for Alerts & Observations – includes access to Members Area and the Explanatory Notes for all of the concepts discussed.

Disclaimer: This is the diary of a personal trading system, its methodology and the signals that it is producing. You are welcome to follow along but please understand that the information presented here is for educational purposes only. No recommendations are being made to buy, or sell stocks, options or futures contracts. Please consult your own financial advisor before making any investment decisions.

Orpheus

Orpheus with his lute made trees,
And the mountain tops that freeze,
Bow themselves when he did sing:
To his music plants and flowers
Ever sprung; as sun and showers
There had made a lasting spring.
Every thing that heard him play,
Even the billows of the sea,
Hung their heads, and then lay by.
In sweet music is such art,
Killing care and grief of heart
Fall asleep, or hearing, die.

William Shakespeare (from Henry VIII)

Some consolidation at the recent high as the market pauses for contemplation of a breakout (or not).
Nothing here to see, move along now…

Chart of S&P 500 for 28 April 2017

Be prepared for whatever comes next:

To receive detailed daily analysis, guidance and the updated daily Buy / Sell trigger levels being generated by the Trading the Line system before the market opens, and intraday alerts when appropriate, become a Member and Sign up for Alerts & Observations – includes access to Members Area and the Explanatory Notes for all of the concepts discussed.

Disclaimer: This is the diary of a personal trading system, its methodology and the signals that it is producing. You are welcome to follow along but please understand that the information presented here is for educational purposes only. No recommendations are being made to buy, or sell stocks, options or futures contracts. Please consult your own financial advisor before making any investment decisions.


Macronite

Time for an update on the S&P 500.

In my last report, I mused upon the question: is it about to get unpleasant, as the market squeezed, gently, downwards.

I pointed out that the next Echo low projected by the extremely long range T structure associated with the early 2016 double bottom was expected to be around the 19 – 22 April.

At the time the market was triangulating and displaying bullish divergence in the oscillator, whilst at the same time respecting the defined downward trend channel.

Chart of S&P 500 for 27 April 2017

Prior to the recent French Election, the market displayed volatility warnings not disimilar to those prior to Brexit and the US Election.

A few votes later and we have a huge volatility crush and markets open up well above the previously defined channel. Markets held firm and quickly rallied above the initial pop and headed for the 2400 level.

The result:

An S/T (short term) Buy Signal and a strong move of the (Magic) T Volume oscillator up through the long cash build up line marked in green.
This in turn produces a new large T structure drawing power from the cash-build up line and projecting strength forward in time equal to the amount of time that the market has been declining (as described by the oscillator). Each wave down in the oscillator has the potential for producing a wave upwards equal in time.
Arms of this new T structure project forward into May and potentially into June.

The caveat:

With such a rapid move back towards the 2400 level, there is always the possibility of failure, and it is true that the market has recently been in a mode of selling the strength and buying weakness. It is entirely possible that we see a short-term double top, and a pullback here. If this occurs, it will require a new low in price and oscillator to significantly change the bullish outlook.

Chart of S&P 500 for 27 April 2017

Zooming out to my weekly chart, the super large T structure centred on the early 2016 double bottom still seems alive and well. There isn't an obvious projection for another major peak until the week of 09 June, as the T structure still seems to be drawing power from the mid 2014 declines – from prices above those of the 2016 lows.

However we should acknowledge the strong 'resistance' apparent at the current highs due to the long term gann projections from the 2000 March and September tops. Movement above these levels will open up the possibility of considerably higher prices.

The market reveals its intentions one day at a time and reserves the right to change its mind on a moments notice.

We watch the oscillator for clues, but we use price as the leading indicator.

Be prepared for what is coming next.

For more detailed ongoing analysis of the developments in the S&P500 index on a daily basis, please Sign up for daily Alerts & Observations – includes access to Members Area and Explanatory Notes.


Rosa d’Abril

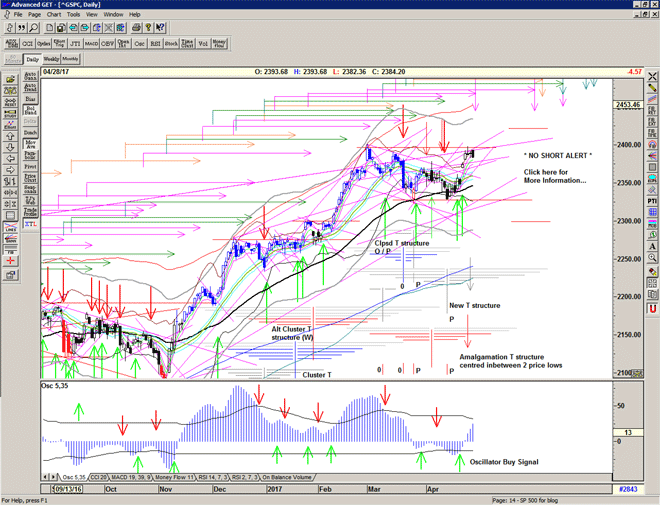
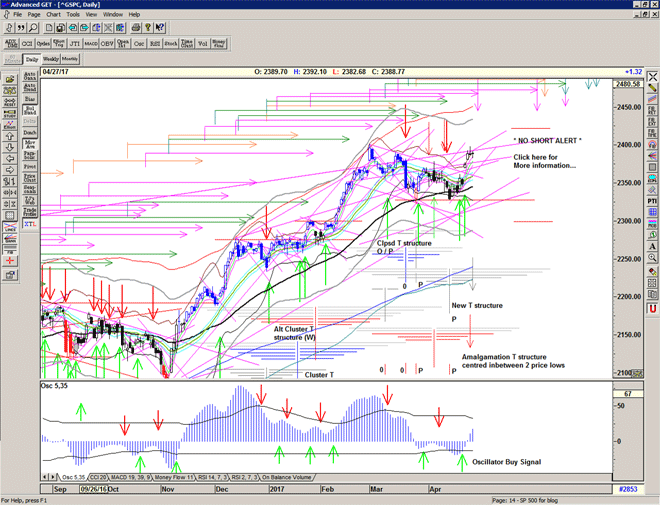
A push higher within pennies of the all time high is met with stiff horizontal resistance, and above the 2 important rising lines, as the market loses some of its power (for now) and looks to take a well earned pause in its climb back.

Yesterday we reached the end of an arm of the amalgamation T, and today we reach an arm of the New T structure, and so a pause for consolidation or pull-back would be likely. Perhaps another test of resistance at 2398 first.

If we do see a retracement, watch for support before a decision is made about higher prices.

Of course, strength above 2400 will push directly higher into the echo high scheduled for 1st May.

Chart of S&P 500 for 27 April 2017

Be prepared for whatever comes next:

To receive detailed daily analysis, guidance and the updated daily Buy / Sell trigger levels being generated by the Trading the Line system before the market opens, and intraday alerts when appropriate, become a Member and Sign up for Alerts & Observations – includes access to Members Area and the Explanatory Notes for all of the concepts discussed.

Disclaimer: This is the diary of a personal trading system, its methodology and the signals that it is producing. You are welcome to follow along but please understand that the information presented here is for educational purposes only. No recommendations are being made to buy, or sell stocks, options or futures contracts. Please consult your own financial advisor before making any investment decisions.


Aldobrandesca

Another gap and a push higher into the long term 'resistance' line at 2392.

The strength of this week's move has taken the T volume oscillator up through a long cash-build up line – at least back to the previous all time high – and so we can draw a new large T structure from the most recent low on April 13. Initial strength projects the first arm this week and projects further strength into mid and late May.

The amalgamation T structure centred inbetween the 2 lows also projects initial highs for yesterday and further strength into May. The prescence of the 2 oscillator lows prior to the price lows may have some further influence, but had been 'warning' of the bullish nature of the market throughout the recent correction.

Chart of S&P 500 for 26 April 2017

Be prepared for whatever comes next:

To receive detailed daily analysis, guidance and the updated daily Buy / Sell trigger levels being generated by the Trading the Line system before the market opens, and intraday alerts when appropriate, become a Member and Sign up for Alerts & Observations – includes access to Members Area and the Explanatory Notes for all of the concepts discussed.

Disclaimer: This is the diary of a personal trading system, its methodology and the signals that it is producing. You are welcome to follow along but please understand that the information presented here is for educational purposes only. No recommendations are being made to buy, or sell stocks, options or futures contracts. Please consult your own financial advisor before making any investment decisions.


A crush on you

The market pops up on the French election news, and holds steady for the day, well above the Buy Signal level.

Volatility as measured by the VIX is crushed.

The small T centred on the most recent low projected its first arm for yesterday, as does the possible amalgamation T structure (red), and so some kind of pause or pullback here would make sense – perhaps a quick spike down into the 60s.

The market found support at 2369 yesterday and so below this we may see some selling in the next few days.

Chart of S&P 500 for 25 April 2017

Be prepared for whatever comes next:

To receive detailed daily analysis, guidance and the updated daily Buy / Sell trigger levels being generated by the Trading the Line system before the market opens, and intraday alerts when appropriate, become a Member and Sign up for Alerts & Observations – includes access to Members Area and the Explanatory Notes for all of the concepts discussed.

Disclaimer: This is the diary of a personal trading system, its methodology and the signals that it is producing. You are welcome to follow along but please understand that the information presented here is for educational purposes only. No recommendations are being made to buy, or sell stocks, options or futures contracts. Please consult your own financial advisor before making any investment decisions.


Troy

Do not trust the horse, Trojans.
Whatever it is, I fear the Greeks even when they bring gifts.
Virgil, in the Aeneid (c. 29 – 19 BC), II, 4

Market backs away from the Buy Signal on Thursday and it will need re-confirming as the choppy recent nature of the market returns to add yet another layer of resistance.

The T volume oscillator fails at the zero line (again), but the Osc oscillator appears to be in recovery.

SKEW heads higher to extreme levels, reflecting the perceived event risk to markets, financials and currency related to the French election etc

Expect a volatile week ahead.

Futures currently indicating a very strong start to the week and a huge move up well above the Buy Signal level, looking like we will be negotiating the resistance levels in the 2370s, 2380s and 2390s. The small T drawn at the most recent low gives strength for a high today, and an extension into the 27th.

How the market deals with today's expected 'pop' will be quite revealing.

Chart of S&P 500 for 24 April 2017

Be prepared for whatever comes next:

To receive detailed daily analysis, guidance and the updated daily Buy / Sell trigger levels being generated by the Trading the Line system before the market opens, and intraday alerts when appropriate, become a Member and Sign up for Alerts & Observations – includes access to Members Area and the Explanatory Notes for all of the concepts discussed.

Disclaimer: This is the diary of a personal trading system, its methodology and the signals that it is producing. You are welcome to follow along but please understand that the information presented here is for educational purposes only. No recommendations are being made to buy, or sell stocks, options or futures contracts. Please consult your own financial advisor before making any investment decisions.