Turtles

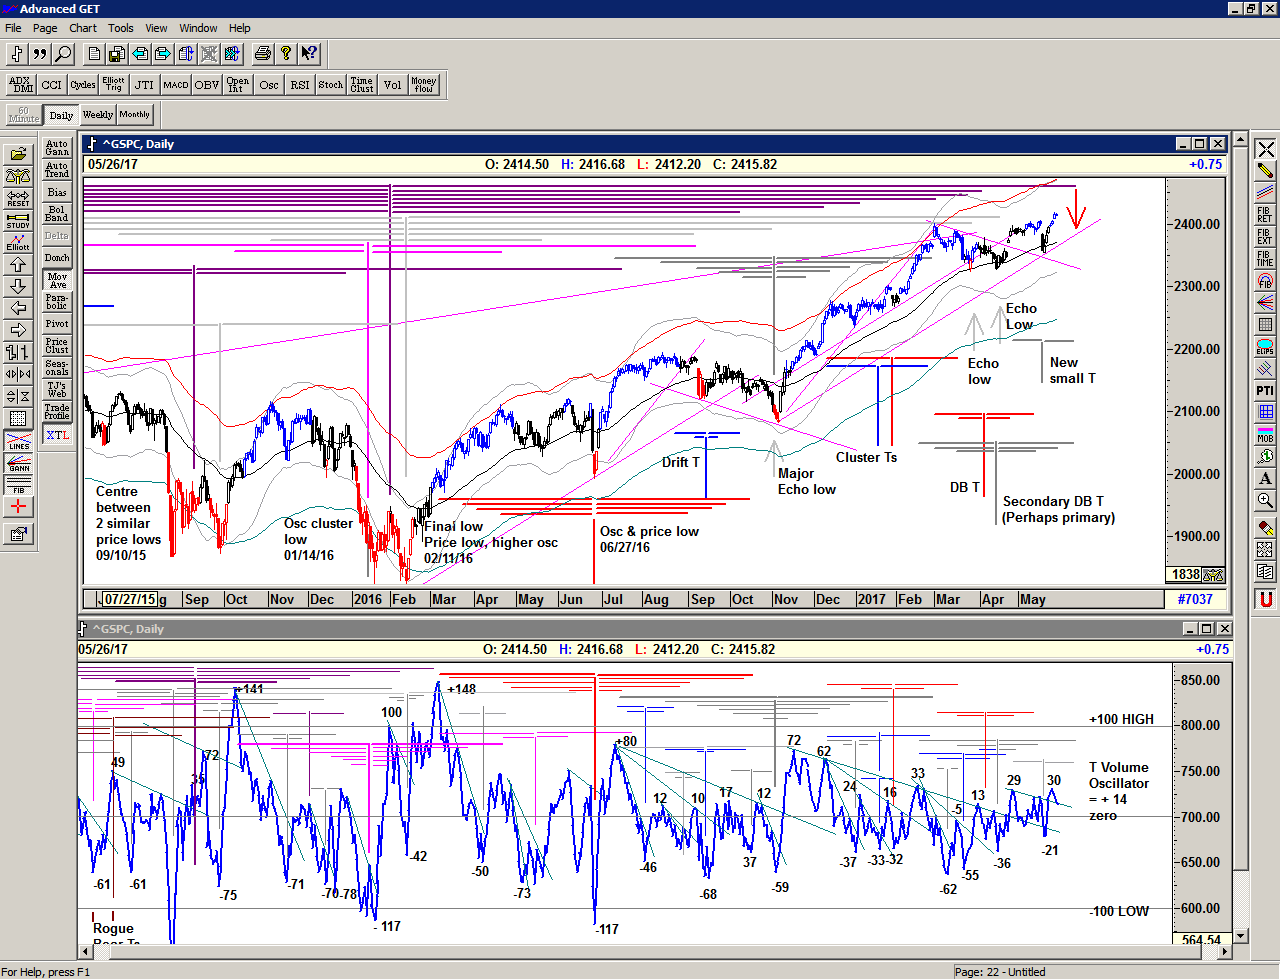
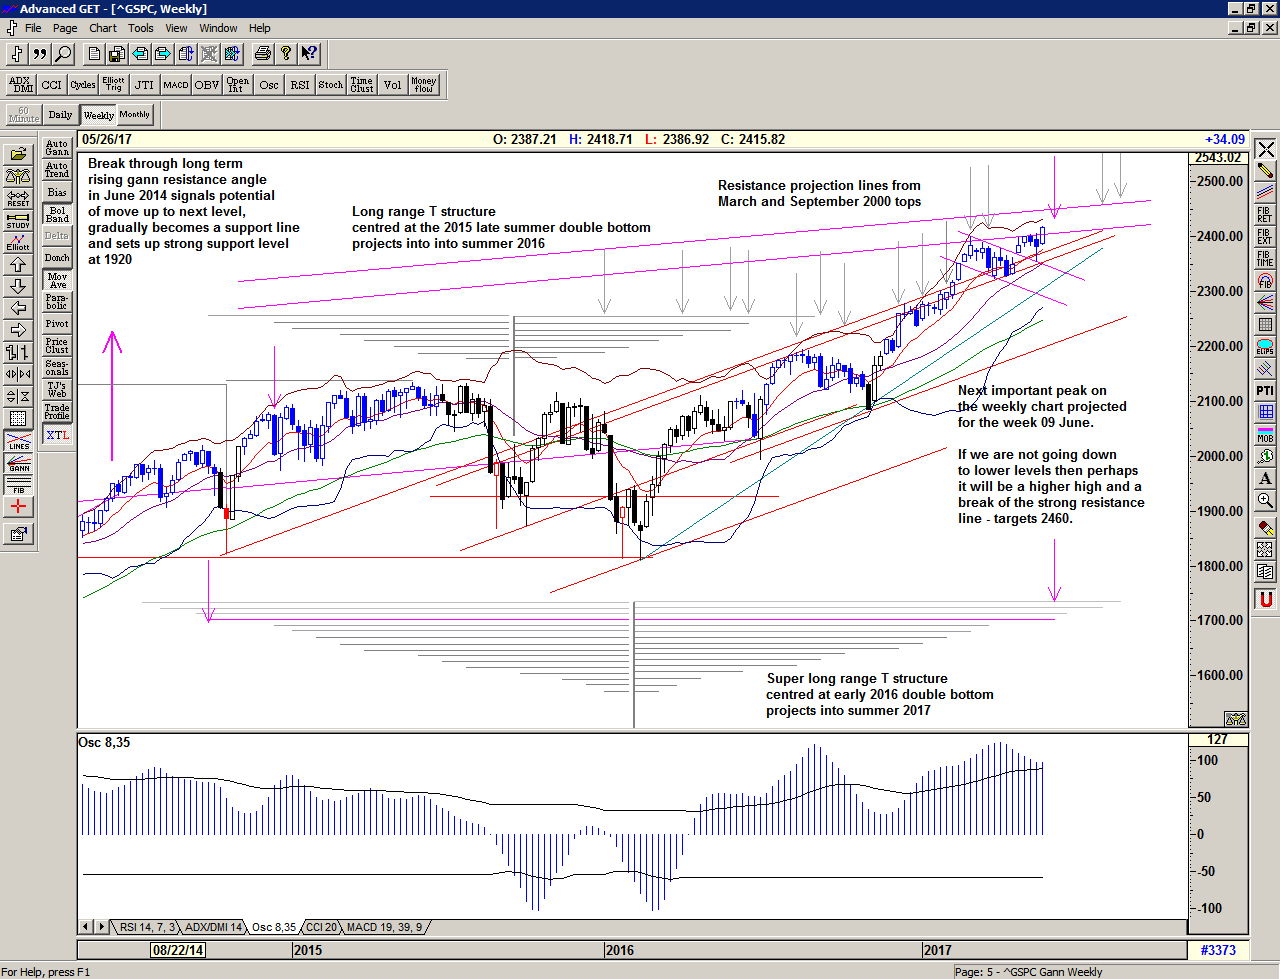
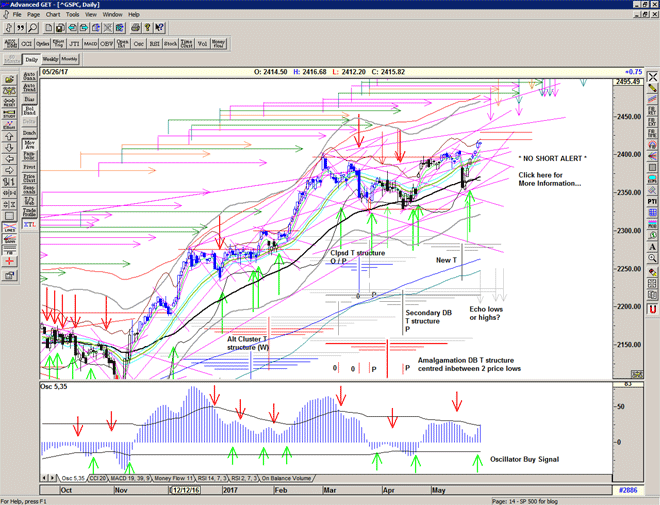
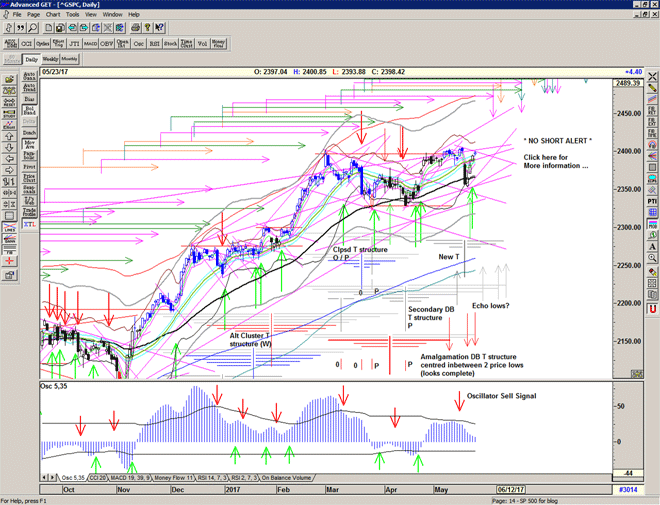
Market recovers all of wednesday's losses and heads into what may well of course be resistance at 2400 at the end of the red Amalgamation DB T structure. A pause or pullback here would be consistent with that, and would also test the strength of the move that is the New small T with its first main arm projecting into Friday for the holiday weekend. However the continued rise of the T volume oscillator gives credence to the new small T and increases the possibility that this is a bigger structure, now potentially drawing power from the 1 March high.

Chart of S&P 500 for 24 May 2017

Be prepared for whatever comes next:

To receive detailed daily analysis, guidance and the updated daily Buy / Sell trigger levels being generated by the Trading the Line system before the market opens, and intraday alerts when appropriate, become a Member and Sign up for Alerts & Observations – includes access to Members Area and the Explanatory Notes for all of the concepts discussed.

Disclaimer: This is the diary of a personal trading system, its methodology and the signals that it is producing. You are welcome to follow along but please understand that the information presented here is for educational purposes only. No recommendations are being made to buy, or sell stocks, options or futures contracts. Please consult your own financial advisor before making any investment decisions.


Humility

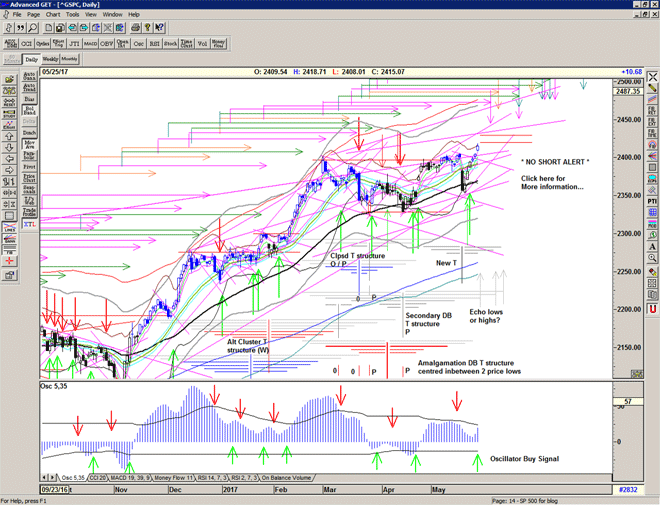
Market triggers a second Buy Signal at the open and is confirmed by the close above 2385.
It appears that the market is in a hurry to correct last week's drop and get back to the all time highs with a slingshot move.

Today is the endgame of the DB T structure, and the T volume oscillator has recovered to the point that gives strength to the New small T and projects towards the cluster of scheduled highs in the first week of June.

Chart of S&P 500 for 23 May 2017

Be prepared for whatever comes next:

To receive detailed daily analysis, guidance and the updated daily Buy / Sell trigger levels being generated by the Trading the Line system before the market opens, and intraday alerts when appropriate, become a Member and Sign up for Alerts & Observations – includes access to Members Area and the Explanatory Notes for all of the concepts discussed.

Disclaimer: This is the diary of a personal trading system, its methodology and the signals that it is producing. You are welcome to follow along but please understand that the information presented here is for educational purposes only. No recommendations are being made to buy, or sell stocks, options or futures contracts. Please consult your own financial advisor before making any investment decisions.


Momentia

“There is surely nothing other than the single purpose of the present moment.
A man's whole life is a succession of moment after moment.
There will be nothing else to do, and nothing else to pursue.
Live being true to the single purpose of the moment.”

– Tsunetomo Yamamoto, Hagakure: The Book of the Samurai

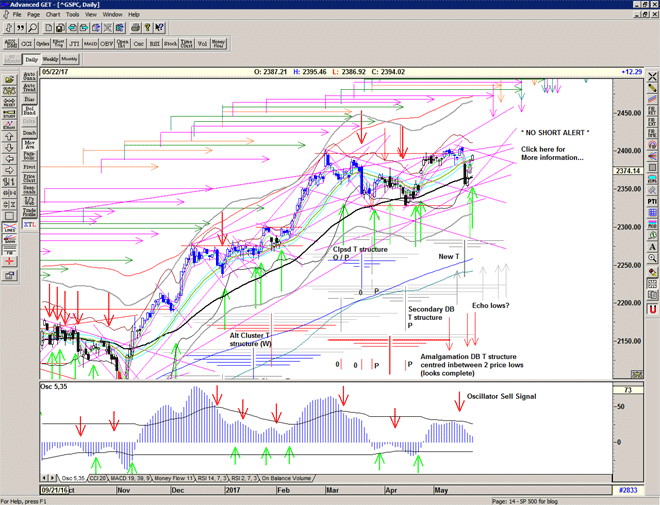
A strong gap and go up into and above the Buy Signal line, but couldn't hold onto all of the gains into the close, cancelling the Buy Signal for now. Failure occurred at the mid-channel line.

The T volume oscillator improves considerably showing strong breadth behind yesterday's rally, and supports the possibility that we have a new small T structure – if the low holds.

Chart of S&P 500 for 22 May 2017

Be prepared for whatever comes next:

To receive detailed daily analysis, guidance and the updated daily Buy / Sell trigger levels being generated by the Trading the Line system before the market opens, and intraday alerts when appropriate, become a Member and Sign up for Alerts & Observations – includes access to Members Area and the Explanatory Notes for all of the concepts discussed.

Disclaimer: This is the diary of a personal trading system, its methodology and the signals that it is producing. You are welcome to follow along but please understand that the information presented here is for educational purposes only. No recommendations are being made to buy, or sell stocks, options or futures contracts. Please consult your own financial advisor before making any investment decisions.


Sell Signal cancelled

Back at the previous Sell Signal level and so cancelling out above here with an S/T Buy Signal above at 2384.

With such a quick move up it is always possible that the market stalls here.

Vigilence required.

Monkey’s Paw

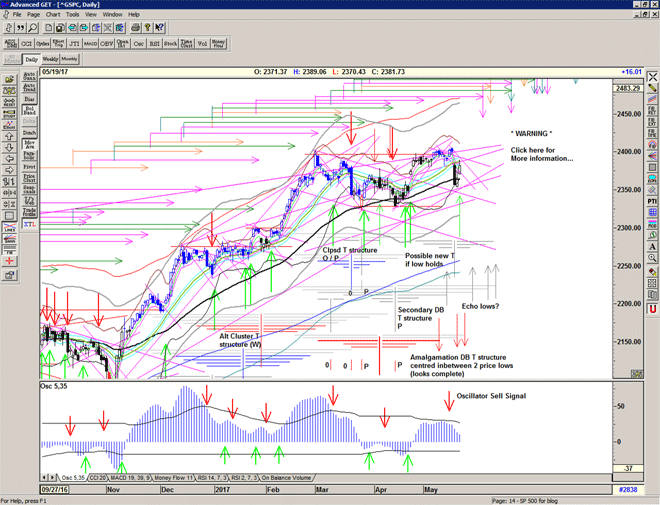
A strong rally off the lows but fails at the 2375 level.

If the low holds then we have a small T with possible strength into early June and the next scheduled echo high.
However the short signal is still active and further 'stabilisation' or downside may be required.

Interestingly the market closed right on the 55 ema – direction uncertain.

A move up through 2375 would obviously be important, as would a break down lower than yesterday's low at 2352.

SKEW moves up indicating the prescence of possible further event risk in Trump town.

Chart of S&P 500 for 19 May 2017

Be prepared for whatever comes next:

To receive detailed daily analysis, guidance and the updated daily Buy / Sell trigger levels being generated by the Trading the Line system before the market opens, and intraday alerts when appropriate, become a Member and Sign up for Alerts & Observations – includes access to Members Area and the Explanatory Notes for all of the concepts discussed.

Disclaimer: This is the diary of a personal trading system, its methodology and the signals that it is producing. You are welcome to follow along but please understand that the information presented here is for educational purposes only. No recommendations are being made to buy, or sell stocks, options or futures contracts. Please consult your own financial advisor before making any investment decisions.


Worms

A dramatic gap down to the Sell Signal level and a short signal triggered in early trade.
A late morning bounce failed at lunchtime and selling resumed.

Potential support lies just below on a rising line from the Election low, but with such a strong sell signal we might expect to see some stabilisation before the next bullish move.

We should now consider the current T structures complete, although we may see some echoes from the secondary structure, and we should be looking for a new low to form and to set up the next large T structure.

Chart of S&P 500 for 18 May 2017

Be prepared for whatever comes next:

To receive detailed daily analysis, guidance and the updated daily Buy / Sell trigger levels being generated by the Trading the Line system before the market opens, and intraday alerts when appropriate, become a Member and Sign up for Alerts & Observations – includes access to Members Area and the Explanatory Notes for all of the concepts discussed.

Disclaimer: This is the diary of a personal trading system, its methodology and the signals that it is producing. You are welcome to follow along but please understand that the information presented here is for educational purposes only. No recommendations are being made to buy, or sell stocks, options or futures contracts. Please consult your own financial advisor before making any investment decisions.


Cover Signal below SPX 2392

Pre-market:

Heavy selling overnight will place the market below the cover signal level and within easy reach of the ST Sell Signal level.

Yes, a short-term bounce may occur especially at 2380 – the site of recent bounces – but the fact that this is occuring during the endgame of the red T structure is strongly suggesting that we take a short signal, if it occurs, seriously.