Overlord

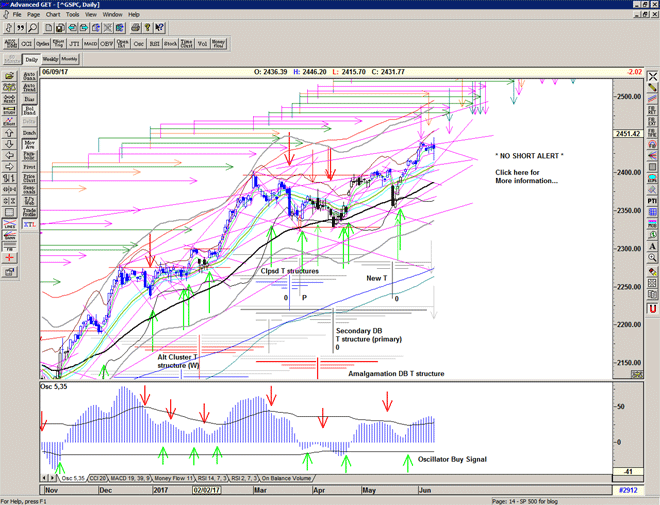
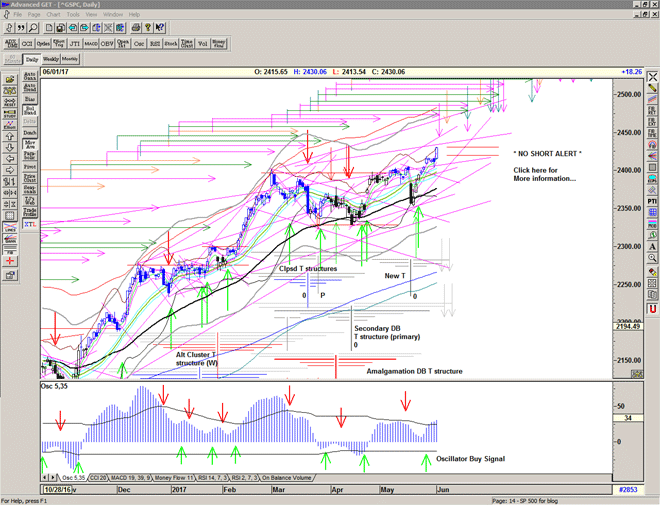
A pause for thought at the echo high.

Penultimate arm of 'Secondary DB' T structure today.

Chart of S&P 500 for 06 June 2017

Be prepared for whatever comes next:

To receive detailed daily analysis, guidance and the updated daily Buy / Sell trigger levels being generated by the Trading the Line system before the market opens, and intraday alerts when appropriate, become a Member and Sign up for Alerts & Observations – includes access to Members Area and the Explanatory Notes for all of the concepts discussed.

Disclaimer: This is the diary of a personal trading system, its methodology and the signals that it is producing. You are welcome to follow along but please understand that the information presented here is for educational purposes only. No recommendations are being made to buy, or sell stocks, options or futures contracts. Please consult your own financial advisor before making any investment decisions.


Torch

You know that it would be untrue
You know that I would be a liar
If I was to say to you
Girl, we couldn't get much higher

Come on baby, light my fire
Try to set the night on fire

– The Doors, Light my Fire, 1967

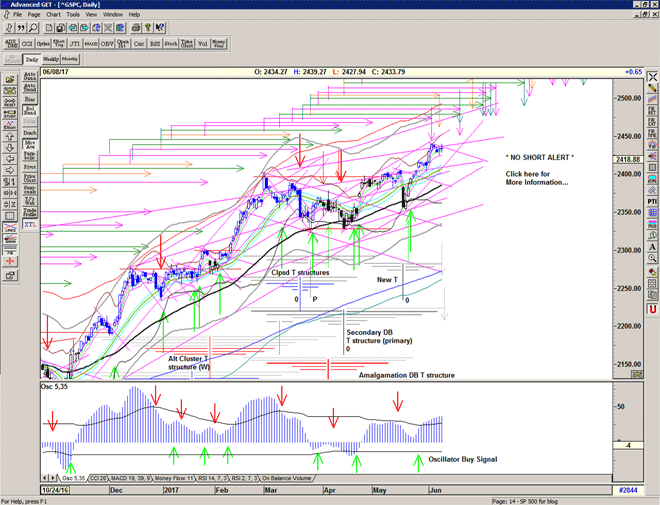
An impressive push into new territory near the end of the current T structures.
Market in 'Hurry up' mode.

Chart of S&P 500 for 05 June 2017

Be prepared for whatever comes next:

To receive detailed daily analysis, guidance and the updated daily Buy / Sell trigger levels being generated by the Trading the Line system before the market opens, and intraday alerts when appropriate, become a Member and Sign up for Alerts & Observations – includes access to Members Area and the Explanatory Notes for all of the concepts discussed.

Disclaimer: This is the diary of a personal trading system, its methodology and the signals that it is producing. You are welcome to follow along but please understand that the information presented here is for educational purposes only. No recommendations are being made to buy, or sell stocks, options or futures contracts. Please consult your own financial advisor before making any investment decisions.


Elmo’s fire

St. Elmo's fire is a weather phenomenon in which luminous plasma is created by a coronal discharge from a sharp or pointed object in a strong electric field in the atmosphere (such as those generated by thunderstorms or created by a volcanic eruption).

St. Elmo's fire is named after St. Erasmus of Formia (also called St. Elmo), the patron saint of sailors. The phenomenon sometimes appeared on ships at sea during thunderstorms and was regarded by sailors with religious awe for its glowing ball of light, accounting for the name. Sailors considered St. Elmo's fire as a good omen (as a sign of the presence of their patron saint).

– Wickipedia

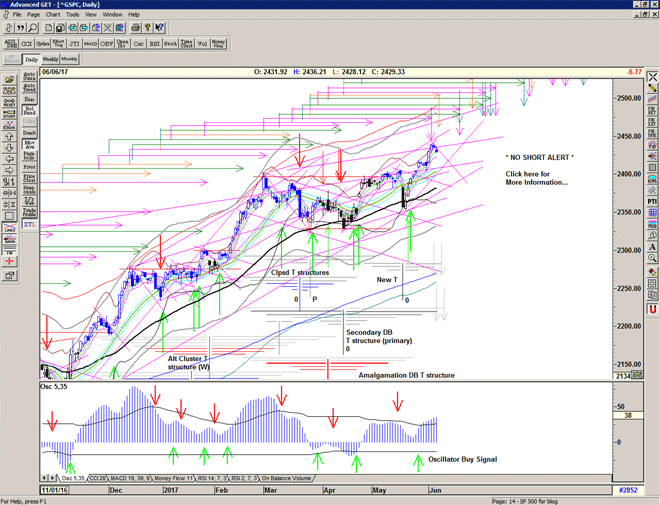
Another short term target acheived, opening up the possibility of higher prices.

Echo high today, endgame of major and minor T structures early next week.

Significant improvement in the T volume oscillator which removes the previous warning and if it continues could unlock further sections of the cash-build up line.

Chart of S&P 500 for 02 June 2017

Be prepared for whatever comes next:

To receive detailed daily analysis, guidance and the updated daily Buy / Sell trigger levels being generated by the Trading the Line system before the market opens, and intraday alerts when appropriate, become a Member and Sign up for Alerts & Observations – includes access to Members Area and the Explanatory Notes for all of the concepts discussed.

Disclaimer: This is the diary of a personal trading system, its methodology and the signals that it is producing. You are welcome to follow along but please understand that the information presented here is for educational purposes only. No recommendations are being made to buy, or sell stocks, options or futures contracts. Please consult your own financial advisor before making any investment decisions.


Milk

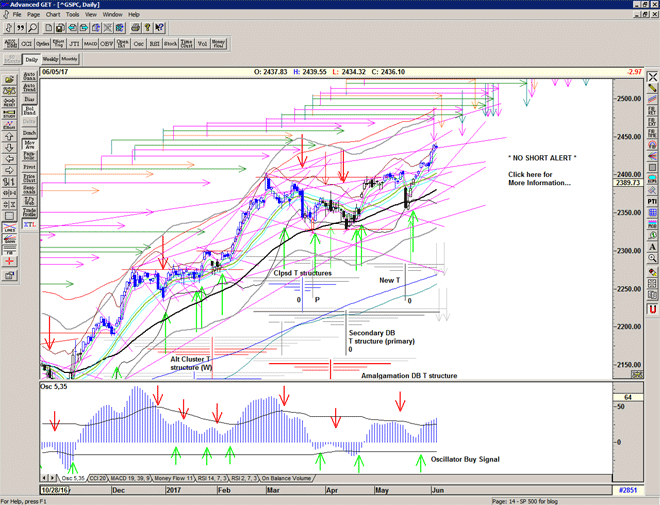
Altitude sickness and a probe down towards the Buy Signal level, just a look see, picked up in late trade.

A warning with the T volume oscillator dropping below zero, some distribution going on.

Echo high tomorrow.

Chart of S&P 500 for 1 June 2017

Be prepared for whatever comes next:

To receive detailed daily analysis, guidance and the updated daily Buy / Sell trigger levels being generated by the Trading the Line system before the market opens, and intraday alerts when appropriate, become a Member and Sign up for Alerts & Observations – includes access to Members Area and the Explanatory Notes for all of the concepts discussed.

Disclaimer: This is the diary of a personal trading system, its methodology and the signals that it is producing. You are welcome to follow along but please understand that the information presented here is for educational purposes only. No recommendations are being made to buy, or sell stocks, options or futures contracts. Please consult your own financial advisor before making any investment decisions.


Petronilla

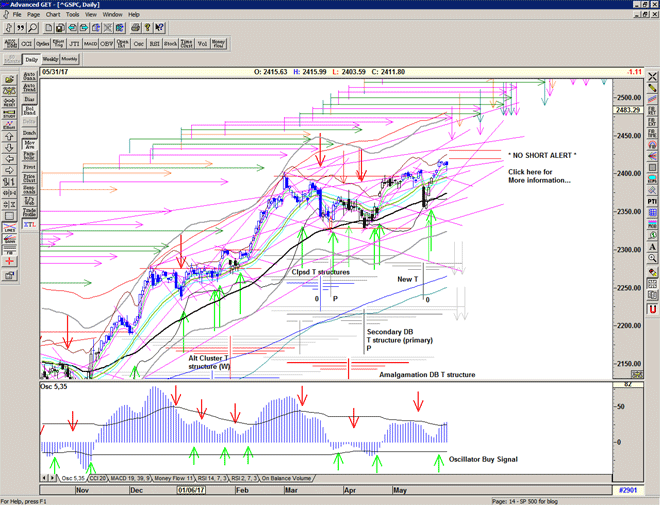
A gentle decline in-line with the main arm of the Secondary DB T structure.
T volume oscillator pulls back close to zero.
Osc oscillator looks strong.

A push upwards into the next scheduled echo high, and the endgame of the Secondary DB T structure, and the end of the New small T still to be expected.

Chart of S&P 500 for 31 May 2017

Be prepared for whatever comes next:

To receive detailed daily analysis, guidance and the updated daily Buy / Sell trigger levels being generated by the Trading the Line system before the market opens, and intraday alerts when appropriate, become a Member and Sign up for Alerts & Observations – includes access to Members Area and the Explanatory Notes for all of the concepts discussed.

Disclaimer: This is the diary of a personal trading system, its methodology and the signals that it is producing. You are welcome to follow along but please understand that the information presented here is for educational purposes only. No recommendations are being made to buy, or sell stocks, options or futures contracts. Please consult your own financial advisor before making any investment decisions.


Of Princes

“Not marble nor the gilded monuments
Of princes, shall outlive this powerful rhyme,
But you shall shine more bright in these contents
Than unswept stone, besmeared with sluttish time.
When wasteful war shall statues overturn
And broils roots out the work of masonry,
Nor mars his sword nor war's quick fire shall burn
The living record of your memory.
'Gainst death and all-oblivious enmity
Shall you pace forth; your praise shall still find room
Even in the eyes of all posterity
That wear this world out to the ending doom.
So, till judgement that yourself arise,
You in this, and dwell in lovers eyes.”

William Shakespeare, Sonnet 55

Market takes a slight breather in its pursuit of new highs and we move into the long memorial weekend.

The market looks 'strong' having taken out the recent resistance at 2400 and higher prices are to be expected, with the oscillator supporting the new small T centred on the 17 May low and projecting a peak on the 8 June, also inline with projections from the Secondary DB T Structure which may be the primary structure.

Chart of S&P 500 for 27 May 2017

Be prepared for whatever comes next:

To receive detailed daily analysis, guidance and the updated daily Buy / Sell trigger levels being generated by the Trading the Line system before the market opens, and intraday alerts when appropriate, become a Member and Sign up for Alerts & Observations – includes access to Members Area and the Explanatory Notes for all of the concepts discussed.

Disclaimer: This is the diary of a personal trading system, its methodology and the signals that it is producing. You are welcome to follow along but please understand that the information presented here is for educational purposes only. No recommendations are being made to buy, or sell stocks, options or futures contracts. Please consult your own financial advisor before making any investment decisions.


Memorandum

Time for an update on the S&P 500.

In my last report, I discussed the new T structure as the market popped up on the 'certainty' of the French Election and proceeded to attack the 2400 level. At that time it seemed likely that a pullback might occur due to the strong resistance at 2400 and the prescence of a large gap.

The one day sell-off last week closed that gap, price made a quick sell signal and headed for a long term rising trend line that originates at the Election low. That support line was never quite reached as the market headed straight back up to the highs generating a new Buy signal in the process, and a new small T.

Chart of S&P 500 for 27 May 2017

During this time I have also reflected upon the T structures that have been created in March and April due to the series of oscillator and price lows. It is complex – there are several higher lows in the oscillator lows and 2 similar price lows, followed by the recent higher low.

The first oscillator low & price of 9 March creates a very small simple T with the lower high.

The second oscillator low of 21 March which drops into the lower (opening) price low of 27 March sets up a collapsing T structure, and a shadow T structure centred on the price low.

The third oscillator & price low of 13 April sets up a double bottom, and this provides 2 possible T structures – a double bottom DB T structure centred inbetween the 2 lows and a second(ary) DB T structure centred on the final low.

The fourth oscillator & price low of 17 May creates a simple T projecting into 8 June.

Usually the Double bottom T structure would be more dominant and the secondary structure at the final low would project lows at its final arms rather than highs.

Interestingly the DB T structure and the Secondary DB T Structure have both recently produced highs at 9 and 15 May respectively, and this has led me to believe that the Secondary DB T Structure is actually the primary structure. This may be because the price low of 27 March was not a low that was sold into but rather that the market opened down significantly and rallied from that price.

Chart of S&P 500 for 27 May 2017

And so the question arises, what's next?

Late last week we reached the end of a major arm of the Secondary DB T structure and the first arm of the new T structure, and so a pause or pullback here could be expected. However, both of these structures also project highs into the 6-9 June period.

Looking at the super large T structure centred on the early 2016 double bottom we can see that there is the possibility of a high being projected from the 19 September 2014 peak – 342 days from high to low and back to high projects 8-9 June 2017. This is the purple arms at the top of the first chart.

Notice that the gray T structure drawn at the final low of that double bottom produces a series of Echo lows.

Be prepared for what is coming next:

For more detailed ongoing analysis of the developments in the S&P500 index on a daily basis, as well as my personal Buy and Sell Signal trigger levels, please Sign up for daily Alerts & Observations. This includes access to the Members Area for an archive of all of my alerts and updates and my Explanatory Notes pdf which gives detailed explanations on all of the concepts being discussed.


Feel like flying

A gap up and go day into new highs, with the next minimum target of 2420-30 looking acheivable.

An Osc Buy Signal.

Perhaps a small speed bump here, after six days of gapping up, and at the first arm of the New T structure, and at a major arm of the secondary DB structure..

Next major echo high scheduled for early June, in conjunction with the New T structure.

I am noticing that the 'secondary DB structure' appears to be supportative of this move, and so may indeed be the primary structure – it also points to highs in the same period of 6 – 9 June.

Chart of S&P500 for 26 May 2017

Be prepared for whatever comes next:

To receive detailed daily analysis, guidance and the updated daily Buy / Sell trigger levels being generated by the Trading the Line system before the market opens, and intraday alerts when appropriate, become a Member and Sign up for Alerts & Observations – includes access to Members Area and the Explanatory Notes for all of the concepts discussed.

Disclaimer: This is the diary of a personal trading system, its methodology and the signals that it is producing. You are welcome to follow along but please understand that the information presented here is for educational purposes only. No recommendations are being made to buy, or sell stocks, options or futures contracts. Please consult your own financial advisor before making any investment decisions.


Africa

Poised at all time highs with the first arm of the small New T projecting an initial high for today.
Osc oscillator turning around and close to a buy signal.

Chart of S&P 500 for 25 May 2017

Be prepared for whatever comes next:

To receive detailed daily analysis, guidance and the updated daily Buy / Sell trigger levels being generated by the Trading the Line system before the market opens, and intraday alerts when appropriate, become a Member and Sign up for Alerts & Observations – includes access to Members Area and the Explanatory Notes for all of the concepts discussed.

Disclaimer: This is the diary of a personal trading system, its methodology and the signals that it is producing. You are welcome to follow along but please understand that the information presented here is for educational purposes only. No recommendations are being made to buy, or sell stocks, options or futures contracts. Please consult your own financial advisor before making any investment decisions.