San Gennaro

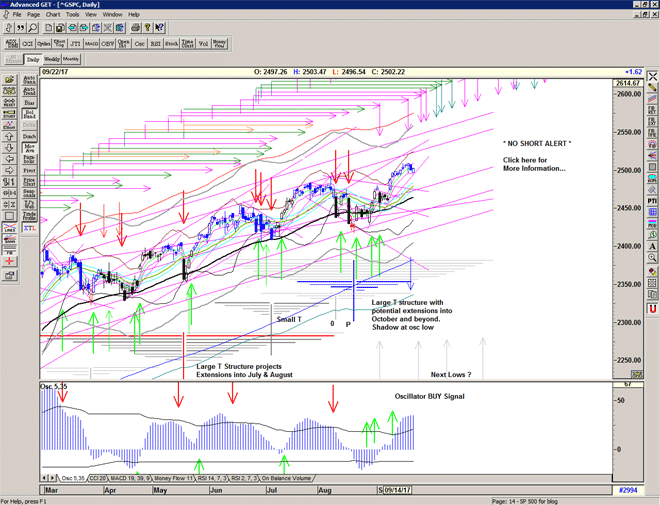
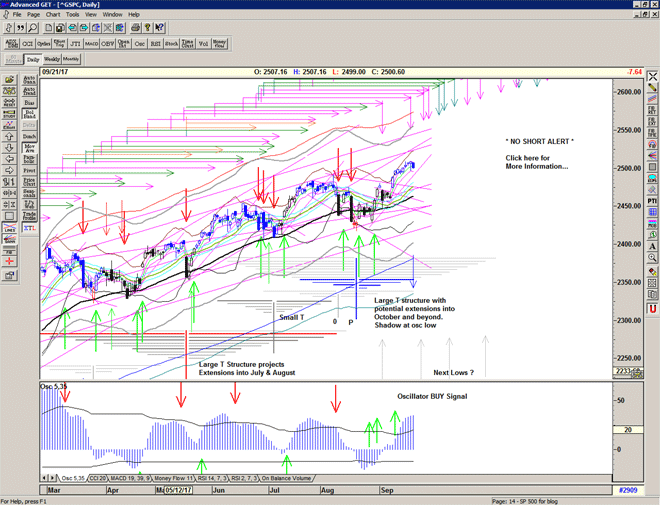
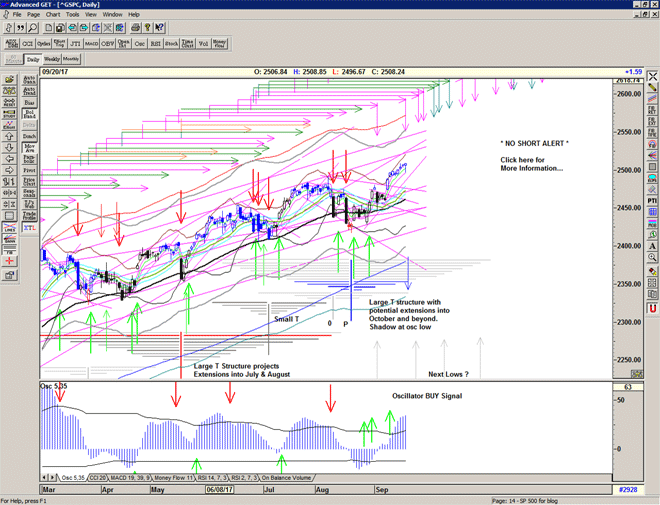
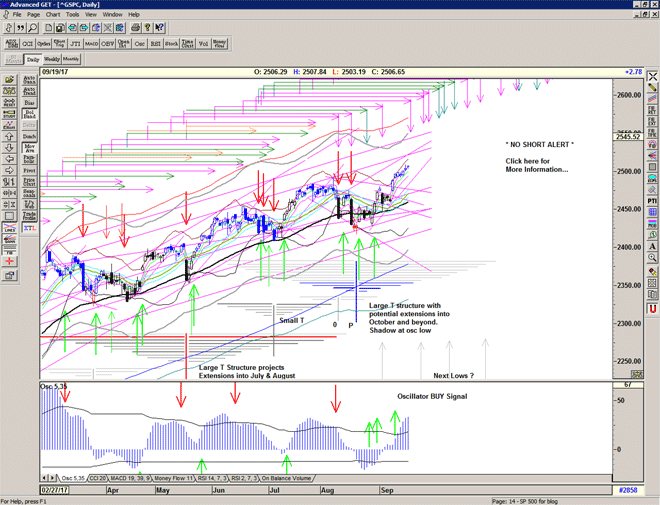
Market takes a go look-see above 2500.

It looks like we may be starting to establish a new range, perhaps 2490 – 2510.

Be prepared for the possibility of some strong selling in line with the upcoming scheduled echo high, and the next arm of the current T structure as drawn from the price momentum peak on 20 July.

Chart of S&P 500 for 19 September 2107

Be prepared for whatever comes next:

To receive detailed daily analysis, guidance and the updated daily Buy / Sell trigger levels being generated by the Trading the Line system before the market opens, and intraday alerts when appropriate, please become a Member and Sign up for Alerts & Observations – includes access to Members Area and the Explanatory Notes for all of the concepts discussed.

Disclaimer: This is the diary of a personal trading system, its methodology and the signals that it is producing. You are welcome to follow along but please understand that the information presented here is for educational purposes only. No recommendations are being made to buy, or sell stocks, options or futures contracts. Please consult your own financial advisor before making any investment decisions.


September Seventeen

Time for an update on the S&P 500.

An exciting start to the Fall and the S&Ps are now at 2500.

Is there more? or will the round number target present a problem moving forward?

Firstly, an interesting development in the T volume oscillator.

On the 22 August the market made a Short Term Buy Signal and defined a small T structure by cutting upwards through the descending cash-build up line of lower highs in the oscillator. After the initial hesitation related to the North Korean missile tests, another peak was produced on 1 September – slightly later than my original estimation for an important peak in the week of 25 August.

One day of weakness as traders came back from the Labour day holiday was all that was required, and in the process a re-test of strong suppport occurred. As soon as worries about missiles and hurricanes were put to one side the market moved quickly to new all time highs and here we are at 2500.

Notice now that since 11 September, the T volume oscillator is making new highs relative to all previous highs this year, and it is therefore cutting upwards through a very long cashbuild up line that takes us back to the December peaks in the oscillator. Notice also the classic 'W' pattern in the oscillator with bullish divergence – a telltale T Theory buy signal.
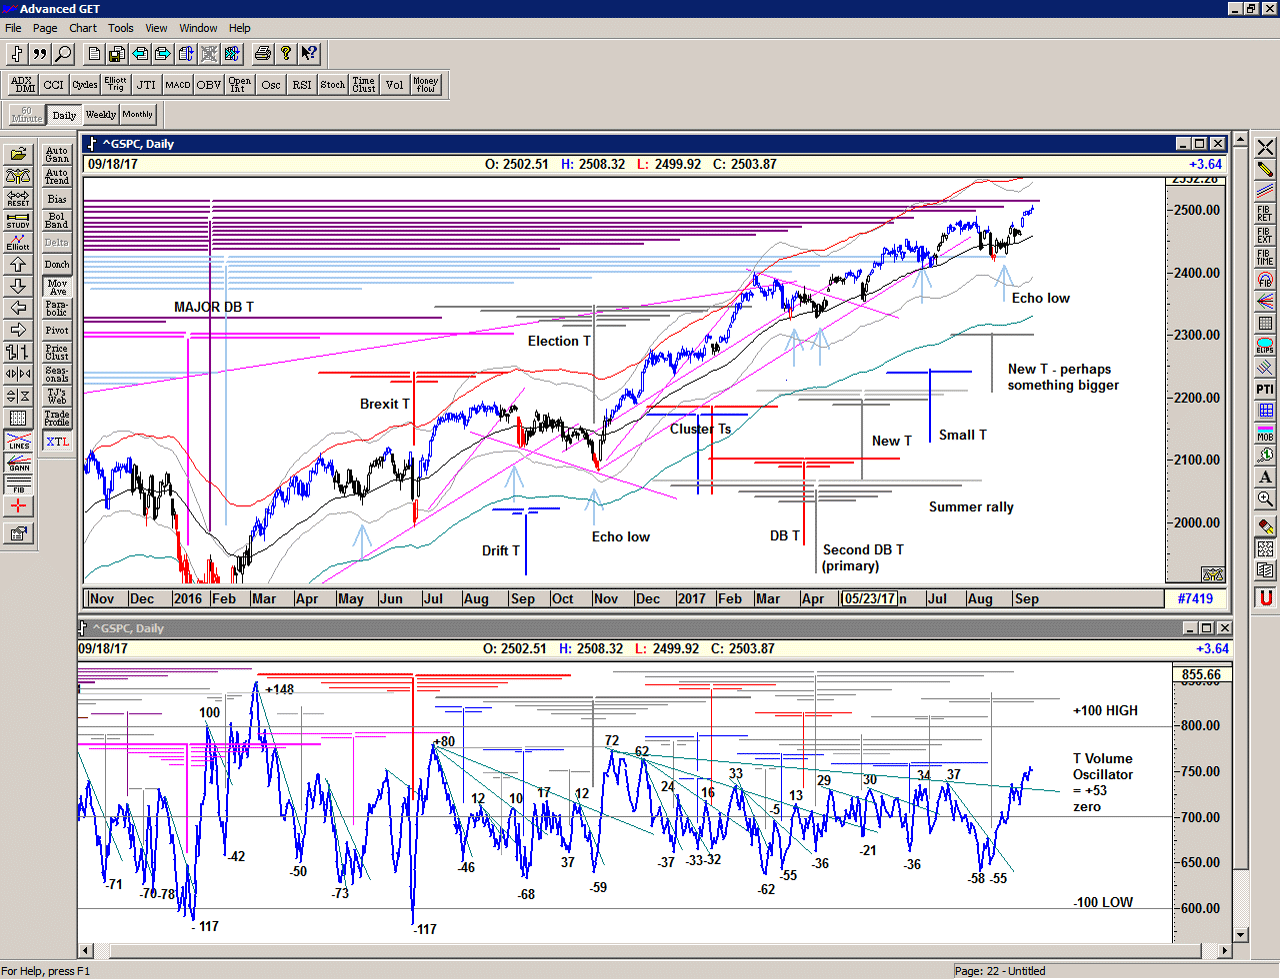
Chart of S&P 500 for 18 August 2017

The market is telling us something – that the August lows were an important successful test, and that the market has significant potential for an advance that could take us much higher. The market is potentially defining a much larger T structure at the recent lows and could draw strength from each of the previous peaks this year.

Initial projections for the current T structure are for later this week, and we may experience some strong selling because the super large double bottom structure of 2016 also projects another high – perhaps short term – for later this week.

How the market responds at this projected peak will be very telling moving forward.
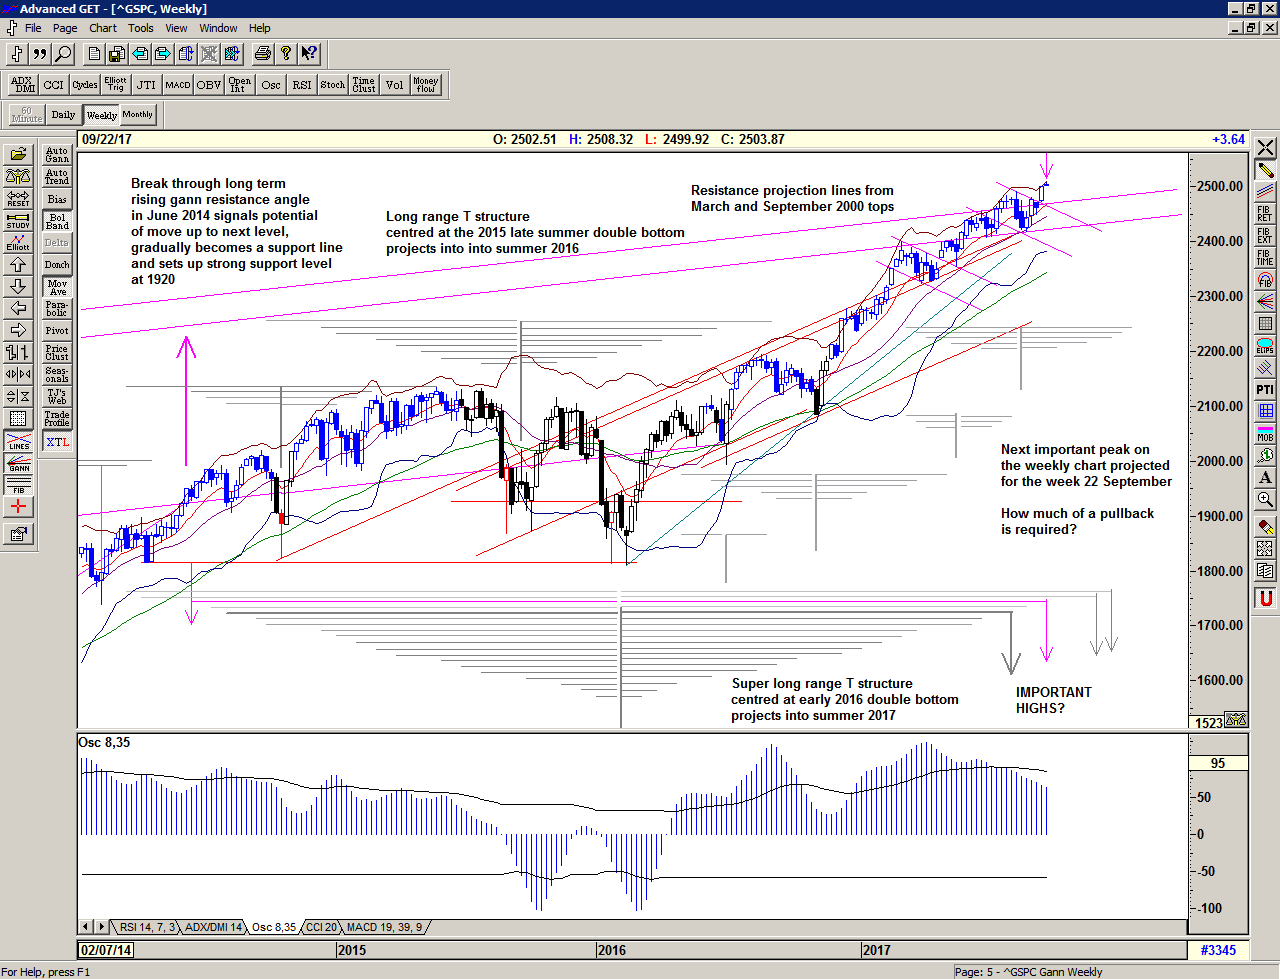
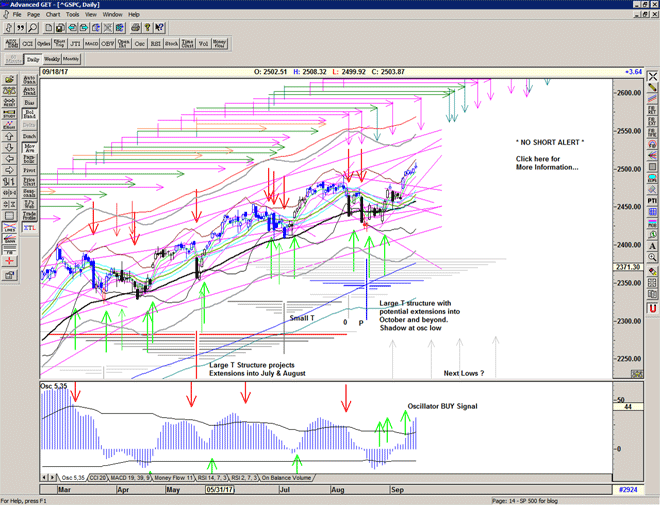
Chart of S&P 500 for 18 September 2017

The weekly chart above shows the full potential of the long range Double Bottom structure of early 2016 with the possibility of a an extension into December. My initial thought was that the projection for an early August high – projected from August 2014 – would be an important peak prior to an extensive bearish phase (see Trump Vs Kim ) but the market appears to have another idea:

– the super large T structure is complete, and we now have a new structure centred on the recent August lows with potential into the winter – higher highs and higher lows, and /or

– the super large structure continues to draw strength from the March and April 2014 declines and this also projects highs in early and late December 2017

But the alternative – which I think is looking less likely due to the reasons above – is that we haven't seen the drop, yet:

– the recent bullish move is a blow-off top extension to the super large T structure and the market is about to turn down into a more defined low in October.

We continue to watch the oscillators for clues, but allow price to be the leading indicator.


Be prepared for what is coming next:

For more detailed ongoing analysis of the developments in the S&P500 index on a daily basis, as well as my personal Buy and Sell Signal trigger levels, please Sign up for daily Alerts & Observations. This includes access to the Members Area for an archive of all of my alerts and updates and my Explanatory Notes pdf which gives detailed explanations on all of the concepts being discussed.

 

Twenty-five hundred

The Buy signal continues and the market closes at the important landmark 2500.

The next negotiation is the upcoming Echo high and the next arm of the current T structure, both scheduled for later this week.

Chart of S&P 500 for 18 September 2017

Be prepared for whatever comes next:

To receive detailed daily analysis, guidance and the updated daily Buy / Sell trigger levels being generated by the Trading the Line system before the market opens, and intraday alerts when appropriate, please become a Member and Sign up for Alerts & Observations – includes access to Members Area and the Explanatory Notes for all of the concepts discussed.

Disclaimer: This is the diary of a personal trading system, its methodology and the signals that it is producing. You are welcome to follow along but please understand that the information presented here is for educational purposes only. No recommendations are being made to buy, or sell stocks, options or futures contracts. Please consult your own financial advisor before making any investment decisions.


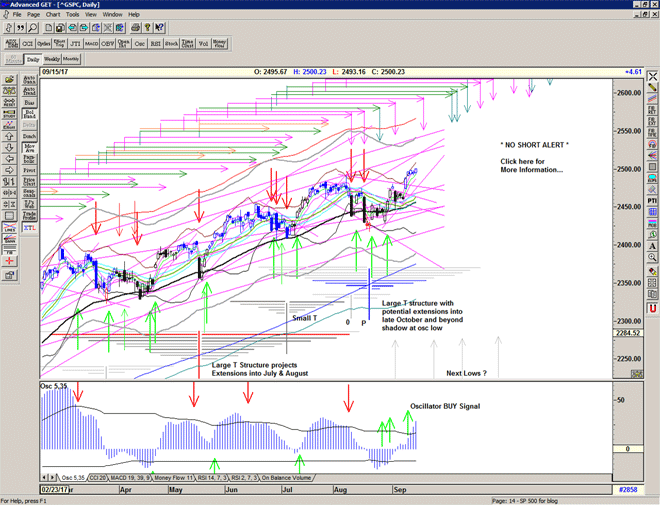
Dolores

Another arm of the current T structure acheived and the market makes time for a pause just below the important 2500 level.

Expect the usual expiration push and pull as traders re-position for October.

Chart of S&P 500 for 15 September 2017

Be prepared for whatever comes next:

To receive detailed daily analysis, guidance and the updated daily Buy / Sell trigger levels being generated by the Trading the Line system before the market opens, and intraday alerts when appropriate, please become a Member and Sign up for Alerts & Observations – includes access to Members Area and the Explanatory Notes for all of the concepts discussed.

Disclaimer: This is the diary of a personal trading system, its methodology and the signals that it is producing. You are welcome to follow along but please understand that the information presented here is for educational purposes only. No recommendations are being made to buy, or sell stocks, options or futures contracts. Please consult your own financial advisor before making any investment decisions.


Push the sky away

I got a feeling I just can’t shake
I got a feeling that just won’t go away
You’ve gotta just keep on pushing…
Push the sky away
Nick Cave and the Bad Seeds, Push the sky away, 2013

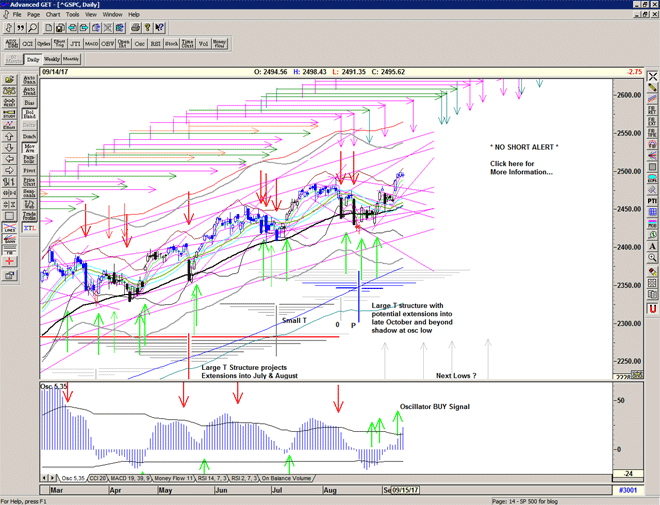
Pushing away at the highs, and the siege of 2500 begins.

Today we have the next major arm of the current T structure as drawn from the 27 July peak and drop – the point where the recent decline into the August low appears to have originated. You could also argue that this actually started a few days earlier on the 20 July and so we also have a projection for a peak next week. Prior to that, the T volume oscillator peaked on the 14-17 July and so you can also run a projection from there.

And so we could expect to see some kind of pause here, as the market absorbs the round number of 2500, and then a grind away (maybe higher) into a more significant peak at the next arms.

SPY dividend and September expiration tomorrow will add a little extra something to the mix.

Chart of S&P 500 for 14 September 2017

Be prepared for whatever comes next:

To receive detailed daily analysis, guidance and the updated daily Buy / Sell trigger levels being generated by the Trading the Line system before the market opens, and intraday alerts when appropriate, please become a Member and Sign up for Alerts & Observations – includes access to Members Area and the Explanatory Notes for all of the concepts discussed.

Disclaimer: This is the diary of a personal trading system, its methodology and the signals that it is producing. You are welcome to follow along but please understand that the information presented here is for educational purposes only. No recommendations are being made to buy, or sell stocks, options or futures contracts. Please consult your own financial advisor before making any investment decisions.


Epulum Jovis

reaching for the sky…

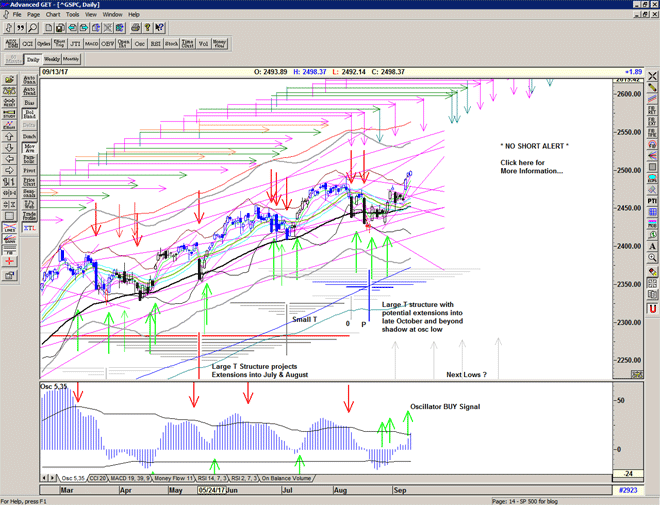
The market reaches out and upwards to new highs with yet another gap.

The resulting strength in the T volume oscillator (now at its 2017 high) increases the size and range of the current T structure potentially drawing power from the very long cash-build up since the previous peaks earlier in the year. This development suggests that the August lows were important and that we may now be at the beginning of another advance to significantly higher prices.

The current large T structure projects initial upcoming highs in September in blue, and a series of extensions from the previous decline projecting into October in gray. It is also now possible that this structure could draw strength from the previous declines projecting further into the winter. However what comes next is dictated by the unfolding of price at the next peaks…

Chart of S&P 500 for 13 September 2017

Be prepared for whatever comes next:

To receive detailed daily analysis, guidance and the updated daily Buy / Sell trigger levels being generated by the Trading the Line system before the market opens, and intraday alerts when appropriate, please become a Member and Sign up for Alerts & Observations – includes access to Members Area and the Explanatory Notes for all of the concepts discussed.

Disclaimer: This is the diary of a personal trading system, its methodology and the signals that it is producing. You are welcome to follow along but please understand that the information presented here is for educational purposes only. No recommendations are being made to buy, or sell stocks, options or futures contracts. Please consult your own financial advisor before making any investment decisions.


Marathon

Market pops to the upside with a gap and go and close near the highs day, proving that the current T structure is very much alive.
A strong move that is supported by the T volume oscillator and now suggesting the potential for significantly higher prices.

Chart of S&P 500 for 12 September 2017

Be prepared for whatever comes next:

To receive detailed daily analysis, guidance and the updated daily Buy / Sell trigger levels being generated by the Trading the Line system before the market opens, and intraday alerts when appropriate, please become a Member and Sign up for Alerts & Observations – includes access to Members Area and the Explanatory Notes for all of the concepts discussed.

Disclaimer: This is the diary of a personal trading system, its methodology and the signals that it is producing. You are welcome to follow along but please understand that the information presented here is for educational purposes only. No recommendations are being made to buy, or sell stocks, options or futures contracts. Please consult your own financial advisor before making any investment decisions.


Sea of Troubles

To be, or not to be: that is the question:
Whether 'tis nobler in the mind to suffer
The slings and arrows of outrageous fortune,
Or to take arms against a sea of troubles,
And by opposing end them? To die: to sleep;
No more; and by a sleep to say we end
The heart-ache and the thousand natural shocks
That flesh is heir to, 'tis a consummation
Devoutly to be wish'd. …
William Shakespeare
, Hamlet

Market stays within the recent range and holds just above the recent rising support line and the Buy signal line.
Still waiting for the catalyst amidst some reluctance to hold long positions into the weekend.

Not much change, but the 'warning' is re-iterated, and below here price deterioration will lead to more selling. The OSC oscillator which of course is a lagging indicator, also displays some weakness in the momentum and turns neutral.

However, lack of bad news over the weekend has raised the futures and we start the week with bullish expectations. IF the market can hold onto these gains we have the possibility of another upcoming peak projection from the small T structure.

We remember all those who suffered and all of those who lost their lives on 911.

Chart Of S&P 500 for 11 September 2017

Be prepared for whatever comes next:

To receive detailed daily analysis, guidance and the updated daily Buy / Sell trigger levels being generated by the Trading the Line system before the market opens, and intraday alerts when appropriate, please become a Member and Sign up for Alerts & Observations – includes access to Members Area and the Explanatory Notes for all of the concepts discussed.

Disclaimer: This is the diary of a personal trading system, its methodology and the signals that it is producing. You are welcome to follow along but please understand that the information presented here is for educational purposes only. No recommendations are being made to buy, or sell stocks, options or futures contracts. Please consult your own financial advisor before making any investment decisions.


Pledge

… liberty and justice for all.

A choppy day but still holding up above the Buy Signal level.

Chart of S&P 500 for 08 September 2017

Be prepared for whatever comes next:

To receive detailed daily analysis, guidance and the updated daily Buy / Sell trigger levels being generated by the Trading the Line system before the market opens, and intraday alerts when appropriate, please become a Member and Sign up for Alerts & Observations – includes access to Members Area and the Explanatory Notes for all of the concepts discussed.

Disclaimer: This is the diary of a personal trading system, its methodology and the signals that it is producing. You are welcome to follow along but please understand that the information presented here is for educational purposes only. No recommendations are being made to buy, or sell stocks, options or futures contracts. Please consult your own financial advisor before making any investment decisions.


Borodino

A gap up, stabilise and recovery day after Tuesday's Fall.
An inside day holding up above the rising support lines.

Chart of S&P 500 for 07 September 2017

Be prepared for whatever comes next:

To receive detailed daily analysis, guidance and the updated daily Buy / Sell trigger levels being generated by the Trading the Line system before the market opens, and intraday alerts when appropriate, please become a Member and Sign up for Alerts & Observations – includes access to Members Area and the Explanatory Notes for all of the concepts discussed.

Disclaimer: This is the diary of a personal trading system, its methodology and the signals that it is producing. You are welcome to follow along but please understand that the information presented here is for educational purposes only. No recommendations are being made to buy, or sell stocks, options or futures contracts. Please consult your own financial advisor before making any investment decisions.