Bagradas

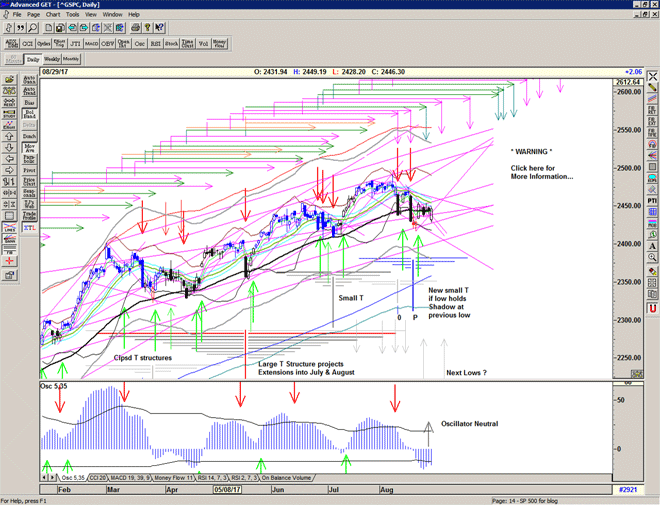
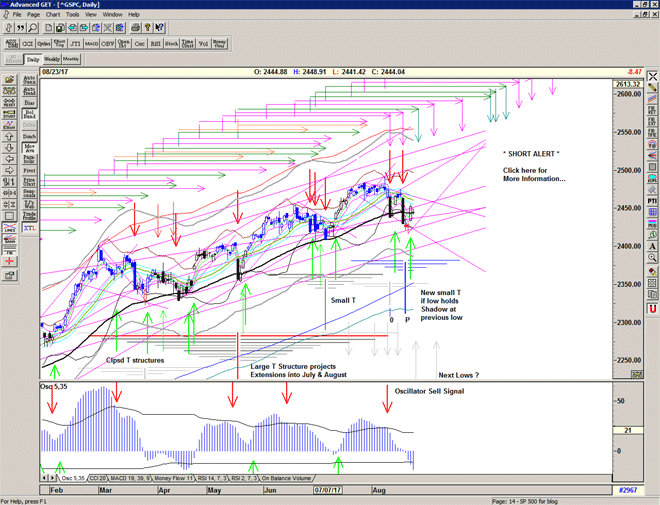
No follow through, yet. A re-test of the 55 ema and still on a Buy Signal, just.

The Warning phase moves up to a Short Alert, but curiously the T volume oscillator continues higher – some strength behind the new small T? Maybe.

Still looking for an attempt on the declining resistance, but another break lower remains a distinct possibility.
Be prepared and Hedge accordingly.

Chart of S&P 500 for 24 August 2017

Be prepared for whatever comes next:

To receive detailed daily analysis, guidance and the updated daily Buy / Sell trigger levels being generated by the Trading the Line system before the market opens, and intraday alerts when appropriate, please become a Member and Sign up for Alerts & Observations – includes access to Members Area and the Explanatory Notes for all of the concepts discussed.

Disclaimer: This is the diary of a personal trading system, its methodology and the signals that it is producing. You are welcome to follow along but please understand that the information presented here is for educational purposes only. No recommendations are being made to buy, or sell stocks, options or futures contracts. Please consult your own financial advisor before making any investment decisions.


Vulcanalia

“If you're going to try, go all the way. Otherwise, don't even start. This could mean losing girlfriends, wives, relatives and maybe even your mind. It could mean not eating for three or four days. It could mean freezing on a park bench. It could mean jail. It could mean derision. It could mean mockery–isolation. Isolation is the gift. All the others are a test of your endurance, of how much you really want to do it. And, you'll do it, despite rejection and the worst odds. And it will be better than anything else you can imagine. If you're going to try, go all the way. There is no other feeling like that. You will be alone with the gods, and the nights will flame with fire. You will ride life straight to perfect laughter. It's the only good fight there is.”

Charles Bukowski, Factotum, 1975

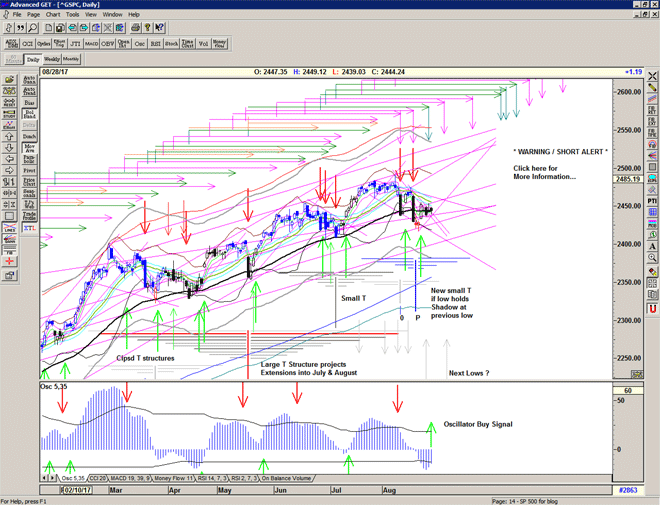
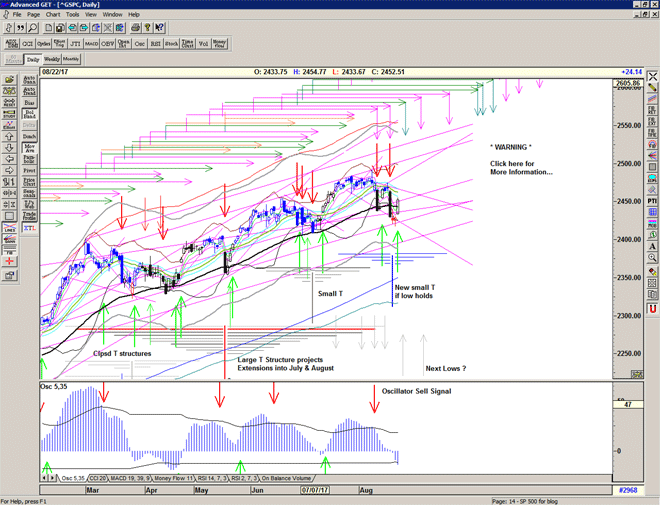
A strong upward thrust through the important 55 ema and a gap up and go day which closed near the high of the day.

A strong Buy Signal and the forming of a new small T structure which IF the low holds projects strength into late August and also into September.

Chart of S&P 500 for 23 August 2017

Be prepared for whatever comes next:

To receive detailed daily analysis, guidance and the updated daily Buy / Sell trigger levels being generated by the Trading the Line system before the market opens, and intraday alerts when appropriate, please become a Member and Sign up for Alerts & Observations – includes access to Members Area and the Explanatory Notes for all of the concepts discussed.

Disclaimer: This is the diary of a personal trading system, its methodology and the signals that it is producing. You are welcome to follow along but please understand that the information presented here is for educational purposes only. No recommendations are being made to buy, or sell stocks, options or futures contracts. Please consult your own financial advisor before making any investment decisions.


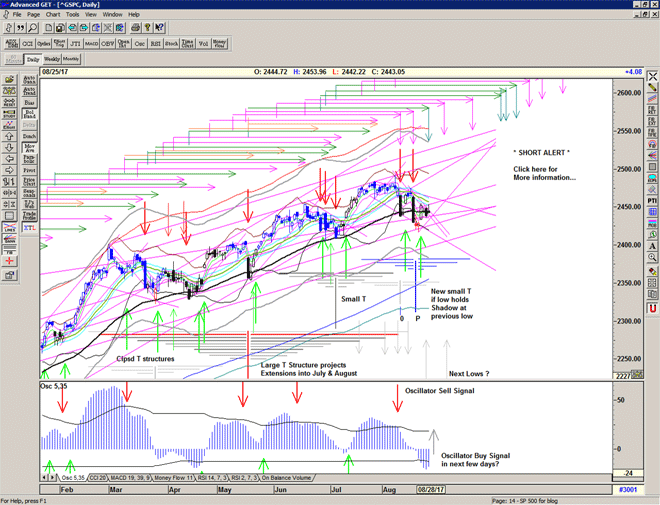
S/T Buy Signal at 2444

The market is in fine form again today and back at the important 55 ema at 2444.

As you know this is an important level and failure here would be continuation Sell Signal.

A close above 2444 is an S/T Buy Signal, with an expectation of an attempt on the descending resistance of the declining channel.


Bosworth

The market tests the downside but holds firm above the recent low with some signs of stabilisation apparent.

Chart of S&P 500 for 22 August 2017

Be prepared for whatever comes next:

To receive detailed daily analysis, guidance and the updated daily Buy / Sell trigger levels being generated by the Trading the Line system before the market opens, and intraday alerts when appropriate, please become a Member and Sign up for Alerts & Observations – includes access to Members Area and the Explanatory Notes for all of the concepts discussed.

Disclaimer: This is the diary of a personal trading system, its methodology and the signals that it is producing. You are welcome to follow along but please understand that the information presented here is for educational purposes only. No recommendations are being made to buy, or sell stocks, options or futures contracts. Please consult your own financial advisor before making any investment decisions.

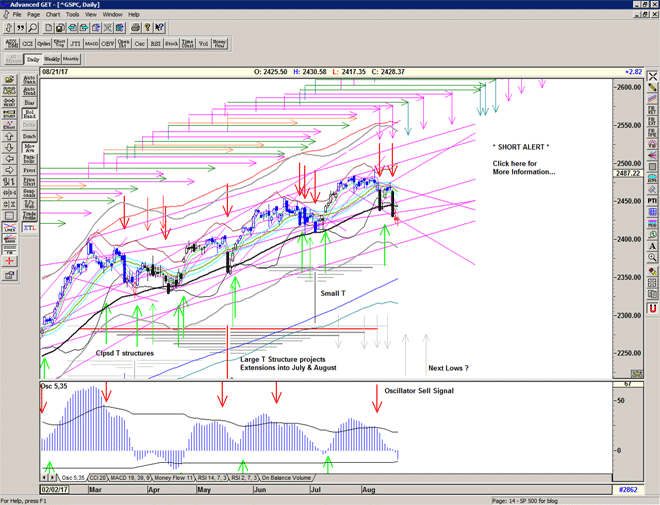
Eclipse

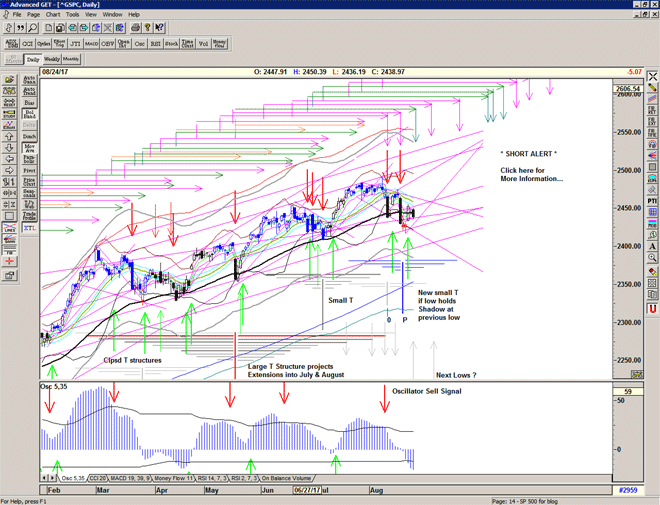
An attempt to recover the 55 ema stalls and the selling resumes into the week's close.

A visit to the lower reaches of the channel seems more and more likely as the market starts to stair-step downwards.

Chart of S&P 500 for 20 August 2017

Be prepared for whatever comes next:

To receive detailed daily analysis, guidance and the updated daily Buy / Sell trigger levels being generated by the Trading the Line system before the market opens, and intraday alerts when appropriate, please become a Member and Sign up for Alerts & Observations – includes access to Members Area and the Explanatory Notes for all of the concepts discussed.

Disclaimer: This is the diary of a personal trading system, its methodology and the signals that it is producing. You are welcome to follow along but please understand that the information presented here is for educational purposes only. No recommendations are being made to buy, or sell stocks, options or futures contracts. Please consult your own financial advisor before making any investment decisions.


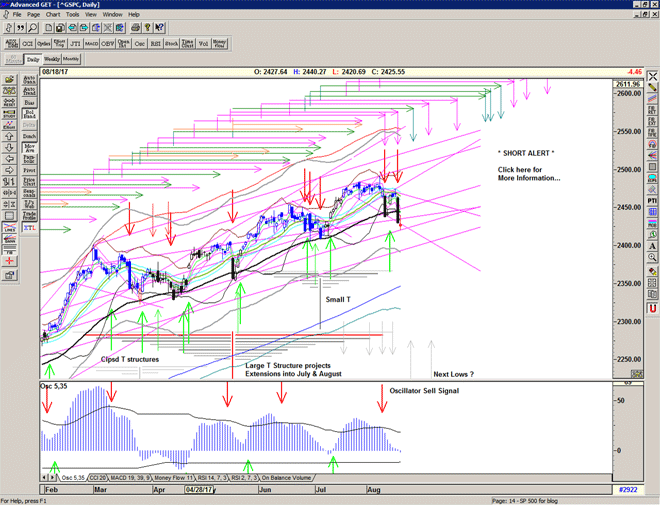
Gravelotte

Another Sell Signal at an Echo high after a short-lived Buy Signal, after another kiss good-bye, and a significant drop below the 55 ema as the market starts to define a descending channel.

Again, look for stabilisation in price and oscillators before the next advance, as the market looks to build a platform for the next large T structure.

Chart of S&P 500 for 18 August 2017

Be prepared for whatever comes next:

To receive detailed daily analysis, guidance and the updated daily Buy / Sell trigger levels being generated by the Trading the Line system before the market opens, and intraday alerts when appropriate, please become a Member and Sign up for Alerts & Observations – includes access to Members Area and the Explanatory Notes for all of the concepts discussed.

Disclaimer: This is the diary of a personal trading system, its methodology and the signals that it is producing. You are welcome to follow along but please understand that the information presented here is for educational purposes only. No recommendations are being made to buy, or sell stocks, options or futures contracts. Please consult your own financial advisor before making any investment decisions.


S/T Sell Signal at 2457

The Echo high provides a little fuel and confirms my suspicions that we saw a kiss good-bye of an important rising trend line yesterday.

Further failure at the 55 ema cancels the possible new T at last week's low and brings the possibility of a visit to the lower reaches of the channel as we look for a larger structure to form in the days or weeks to come.

Verneuil

An attempt to move higher is rejected at 2475 as the market finds declining resistance from the recent highs and meets the important rising line from the Election low – a kiss good-bye perhaps?

Still above the Buy Signal line but today is an Echo high which could add some fuel to any further selling.

Some improvements in the oscillators but not yet out of the woods.

Chart of S&P 500 for 17 August 2017

Be prepared for whatever comes next:

To receive detailed daily analysis, guidance and the updated daily Buy / Sell trigger levels being generated by the Trading the Line system before the market opens, and intraday alerts when appropriate, please become a Member and Sign up for Alerts & Observations – includes access to Members Area and the Explanatory Notes for all of the concepts discussed.

Disclaimer: This is the diary of a personal trading system, its methodology and the signals that it is producing. You are welcome to follow along but please understand that the information presented here is for educational purposes only. No recommendations are being made to buy, or sell stocks, options or futures contracts. Please consult your own financial advisor before making any investment decisions.


Trump vs Kim

There are two problems for our species' survival – nuclear war and environmental catastrophe – and we're hurtling towards them. Knowingly.

Noam Chomsky

Time for an update on the S&P 500.

In my last report I posed the question – was it time to rollover and die, or was it time for a summer rally? The answer came quickly and on 12 July the market gapped up above descending resistance on a clear Buy signal.

A good summer rally was had, and after several momentum and breadth warnings we had the exhaustion move to 2492 on the 8 August. I had been warning my readers of an expected peak in the early August timeframe but then someone mentioned missiles and we had the quick panic selloff last week.

Chart of S&P 500 for 16 August 2017

As you can see several of the recent T structures pointed to a possible August peak including the very large Double Bottom structure centred inbetween the 2 major lows of early 2016. (Top in purple)

The panic took the market straight down to the important 55 day exponential moving average, and this is an important inflection point and has been the site of many important recent lows.

The subsequent bounce has made a small T which looks to be confirmed today and projects a high in late August.

Interestingly the 2nd low of the large Double Bottom T structure projects a series of Echo lows (marked in pale blue) and, if correct, this suggests another important low coming up also in the late August timeframe.

Chart of S&P 500 for 16 August 2017

The weekly chart above shows the full potential range of the long range Double Bottom structure of early 2016. It now looks nearly complete. As you can see the market has been tackling the long term resistance lines that I have drawn from the March and September 2000 tops. I believe that because the market has moved upwards through these lines it has set up a significant move higher. I suspect that it may be similar to the June 2014 breakthrough, which wasn't straight up but followed a process of re-testing the previous significant low and building a platform. Perhaps 2350 and/or 2320-30 will become significant at future lows prior to the next major advance?

In the meantime it looks like the next important peak will be in the week of 25 August, with perhaps another significant peak in the week of 22 September. How much of a pullback is required first, and whether to expect higher or lower highs is unclear, and is dependent upon what happens next.

Beyond this it seems likely that we will need to see some type of corrective action that should set up another large T structure. Notice the momentum slowing on the oscillator has previously led to some significant corrections.

Perhaps Trump vs Kim after all.

Be prepared for what is coming next:

For more detailed ongoing analysis of the developments in the S&P500 index on a daily basis, as well as my personal Buy and Sell Signal trigger levels, please Sign up for daily Alerts & Observations. This includes access to the Members Area for an archive of all of my alerts and updates and my Explanatory Notes pdf which gives detailed explanations on all of the concepts being discussed.


Peterloo

Still on a Buy Signal, but finding some resistance at the declining angle from the recent highs.

The final arm of the Large T structure centred at the 17 May low expires, and this could produce another wave of selling.

IF not we have a small T which isn't confirmed by the oscillator (yet) but projects highs next week and/or prior to the labor day holiday.

Chart of S&P 500 for 16 August 2017

Be prepared for whatever comes next:

To receive detailed daily analysis, guidance and the updated daily Buy / Sell trigger levels being generated by the Trading the Line system before the market opens, and intraday alerts when appropriate, please become a Member and Sign up for Alerts & Observations – includes access to Members Area and the Explanatory Notes for all of the concepts discussed.

Disclaimer: This is the diary of a personal trading system, its methodology and the signals that it is producing. You are welcome to follow along but please understand that the information presented here is for educational purposes only. No recommendations are being made to buy, or sell stocks, options or futures contracts. Please consult your own financial advisor before making any investment decisions.