Mayflower

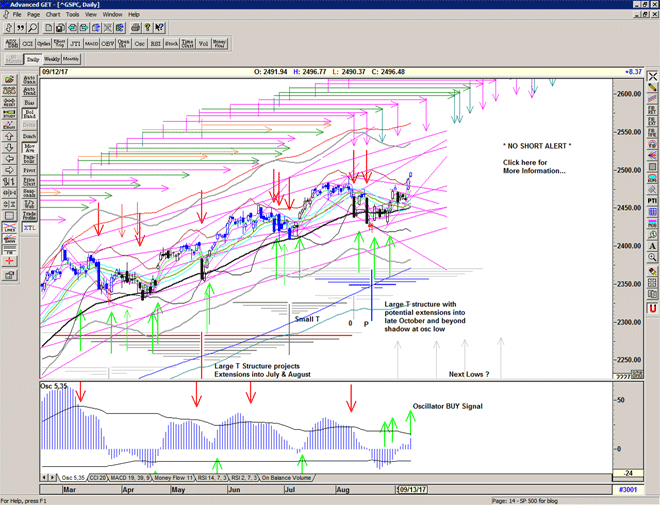
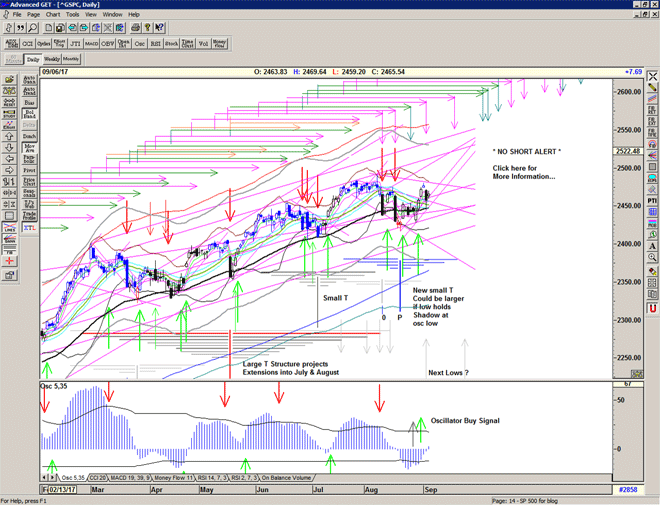
The echo high pushes down hard into the 55 ema for a bounce back to hold onto support just above the Buy Signal level.

Chart of S&P 500 for 06 September 2017

Be prepared for whatever comes next:

To receive detailed daily analysis, guidance and the updated daily Buy / Sell trigger levels being generated by the Trading the Line system before the market opens, and intraday alerts when appropriate, please become a Member and Sign up for Alerts & Observations – includes access to Members Area and the Explanatory Notes for all of the concepts discussed.

Disclaimer: This is the diary of a personal trading system, its methodology and the signals that it is producing. You are welcome to follow along but please understand that the information presented here is for educational purposes only. No recommendations are being made to buy, or sell stocks, options or futures contracts. Please consult your own financial advisor before making any investment decisions.


Bertin

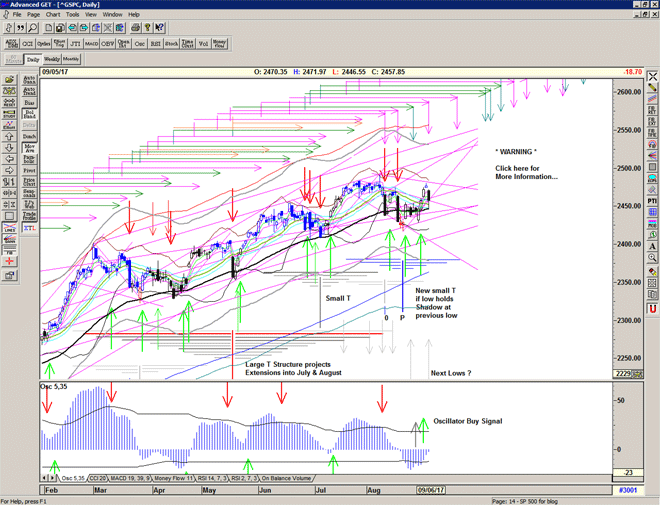
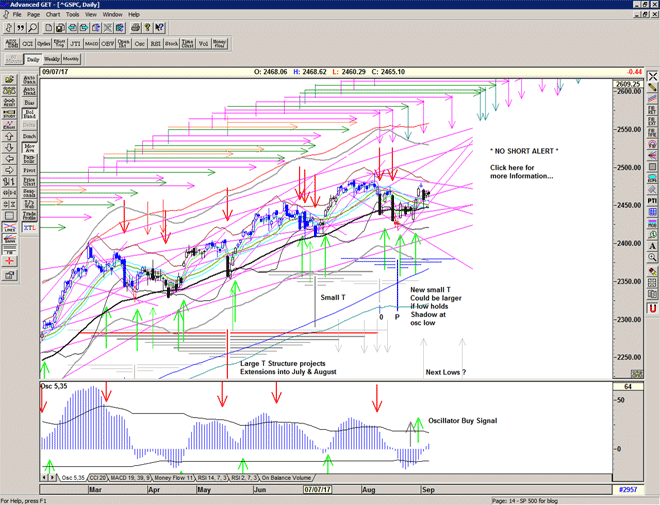
Back to work after the long weekend, and Kim fires another missile.

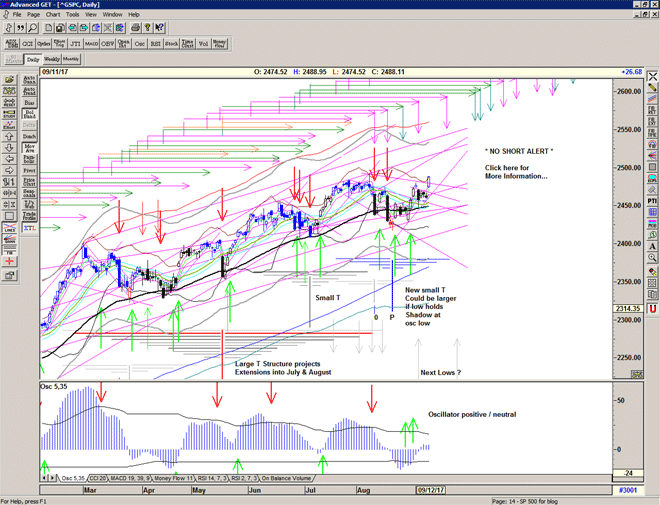
Last week was a nice strong linear move and a little re-tracement of that would make sense given that the first main arm of the small T  projected into Friday, and today is a scheduled pulse high.

Still on a Buy Signal with the possibility of a grind higher into a mid-September projection of the current T.

Chart of S&P 500 for 05 September 2017

Be prepared for whatever comes next:

To receive detailed daily analysis, guidance and the updated daily Buy / Sell trigger levels being generated by the Trading the Line system before the market opens, and intraday alerts when appropriate, please become a Member and Sign up for Alerts & Observations – includes access to Members Area and the Explanatory Notes for all of the concepts discussed.

Disclaimer: This is the diary of a personal trading system, its methodology and the signals that it is producing. You are welcome to follow along but please understand that the information presented here is for educational purposes only. No recommendations are being made to buy, or sell stocks, options or futures contracts. Please consult your own financial advisor before making any investment decisions.


Fall

The end of the summer and the first day of Fall – we shall see what delights it brings us all.

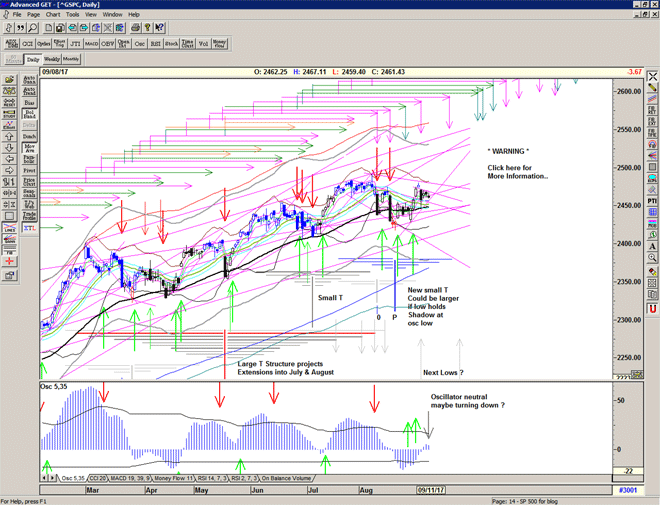
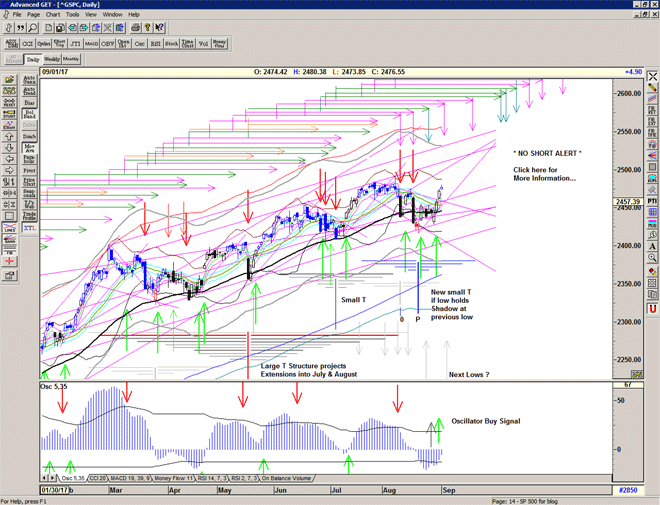
August comes to a close with a decisive move up above the declining resistance line and above the Mid-channel as the market heads back towards the all time highs.
Market in festive mood with the long weekend to look forward to.

An Echo high is scheduled for Tuesday.

Chart of S&P 500 for 01 September 2017

Be prepared for whatever comes next:

To receive detailed daily analysis, guidance and the updated daily Buy / Sell trigger levels being generated by the Trading the Line system before the market opens, and intraday alerts when appropriate, please become a Member and Sign up for Alerts & Observations – includes access to Members Area and the Explanatory Notes for all of the concepts discussed.

Disclaimer: This is the diary of a personal trading system, its methodology and the signals that it is producing. You are welcome to follow along but please understand that the information presented here is for educational purposes only. No recommendations are being made to buy, or sell stocks, options or futures contracts. Please consult your own financial advisor before making any investment decisions.


Solidarity

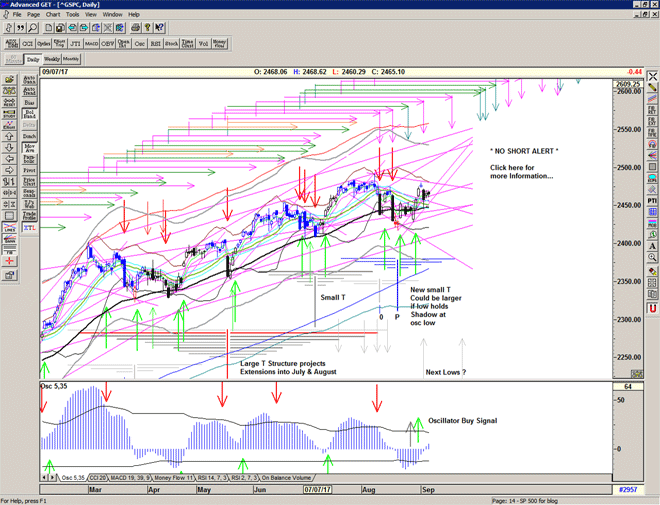
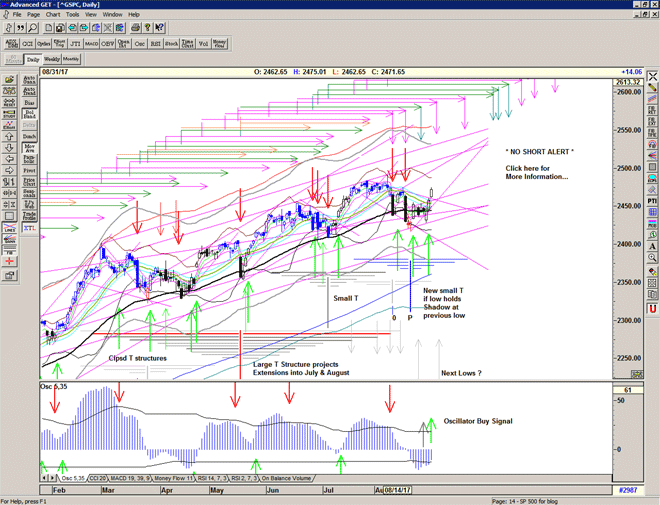
Market plays catch up quick and heads for the declining resistance line.
An S/T Buy Signal at 2450.
Oscillators improve but still at an inflection point.
Strength above here opens up the possibility of further price discovery.

Chart of S&P 500 for 31 August 2017

Be prepared for whatever comes next:

To receive detailed daily analysis, guidance and the updated daily Buy / Sell trigger levels being generated by the Trading the Line system before the market opens, and intraday alerts when appropriate, please become a Member and Sign up for Alerts & Observations – includes access to Members Area and the Explanatory Notes for all of the concepts discussed.

Disclaimer: This is the diary of a personal trading system, its methodology and the signals that it is producing. You are welcome to follow along but please understand that the information presented here is for educational purposes only. No recommendations are being made to buy, or sell stocks, options or futures contracts. Please consult your own financial advisor before making any investment decisions.


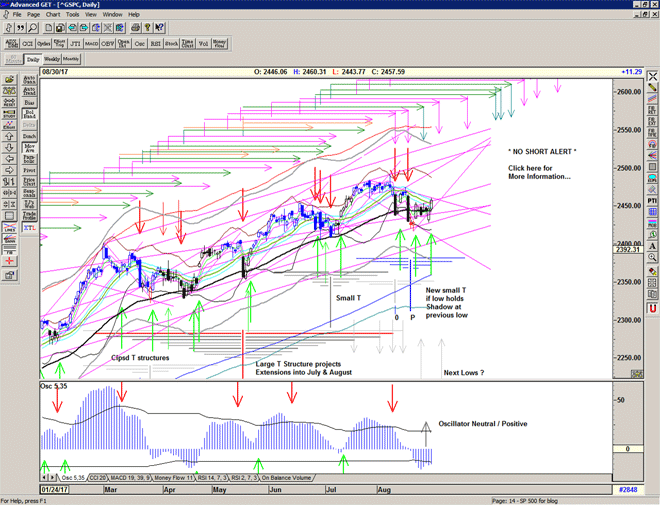
Discovery

Overnight / over-reaction to the missile event risk gives the market a welcome boost.
Back above that important 55 ema again, and close to a Buy Signal, but as we can see, the market has backed off from the Mid-channel recently and needs to push upwards through it if it is to make any progress.
Technically an improvement but the oscillators are still in neutral suggest the possibility of more chop ahead.

Chart of S&P500 for 30 August 2017

Be prepared for whatever comes next:

To receive detailed daily analysis, guidance and the updated daily Buy / Sell trigger levels being generated by the Trading the Line system before the market opens, and intraday alerts when appropriate, please become a Member and Sign up for Alerts & Observations – includes access to Members Area and the Explanatory Notes for all of the concepts discussed.

Disclaimer: This is the diary of a personal trading system, its methodology and the signals that it is producing. You are welcome to follow along but please understand that the information presented here is for educational purposes only. No recommendations are being made to buy, or sell stocks, options or futures contracts. Please consult your own financial advisor before making any investment decisions.


No missile crisis yet

Nothing much but buying this morning after the overnight 'missile crisis' and so a nice strong thrust upwards from 2428.

It seems that we are still buying the dips and selling the rips.

Continue to watch the action at the important averages for evidence of a sustained move higher.

First Lightning

Market closed yesterday still in Neutral / slightly Bearish Mode waiting for direction.
No strength to follow through on overnight gains, but holding onto the important 55 ema for now.

The momentum oscillator looks to be making a Buy Signal.
The T volume oscillator back just below zero – failure here is a Sell Signal.

On the anniversary of the soviets first atomic bomb test – First Lightning – the North Koreans fire a missile over Japanese air space. Futures are subsequently trading below the Sell Signal line but bounced from initial lows in the region of 2420. Early morning reaction and political rhetoric will likely set the stage for the day.

Chart of S&P 500 for 29 August 2017

Be prepared for whatever comes next:

To receive detailed daily analysis, guidance and the updated daily Buy / Sell trigger levels being generated by the Trading the Line system before the market opens, and intraday alerts when appropriate, please become a Member and Sign up for Alerts & Observations – includes access to Members Area and the Explanatory Notes for all of the concepts discussed.

Disclaimer: This is the diary of a personal trading system, its methodology and the signals that it is producing. You are welcome to follow along but please understand that the information presented here is for educational purposes only. No recommendations are being made to buy, or sell stocks, options or futures contracts. Please consult your own financial advisor before making any investment decisions.


Acceptance

Sam – Whenever there is any doubt, there is no doubt. That's the first thing they teach you.
Vincent – Who taught you?
Sam – I don't remember. That's the second thing they teach you.
[…]
Vincent – No questions. No answers. That's the business we're in. You just accept it and move on. Maybe that's lesson number three.

Ronin, 1998 Dir. John Frankenheimer

Another attempt at a Buy Signal meets resistance at the previous high of 2454, continuing the theme of declining resistance.

The T volume oscillator climbs higher and turns positive and the OSC momentum oscillator looks near to a Buy signal.

Market still in a Neutral – Slightly Bearish mode and waiting for a catalyst for direction – this could mean the market is rolling over or could just be the squeeze before the next advance – we shall see.

Chart of S&P 500 for 28 August 2017

Be prepared for whatever comes next:

To receive detailed daily analysis, guidance and the updated daily Buy / Sell trigger levels being generated by the Trading the Line system before the market opens, and intraday alerts when appropriate, please become a Member and Sign up for Alerts & Observations – includes access to Members Area and the Explanatory Notes for all of the concepts discussed.

Disclaimer: This is the diary of a personal trading system, its methodology and the signals that it is producing. You are welcome to follow along but please understand that the information presented here is for educational purposes only. No recommendations are being made to buy, or sell stocks, options or futures contracts. Please consult your own financial advisor before making any investment decisions.


Libération

No follow through. Cover signal triggered at 2440, but not quite a sell signal.

Chart of S&P 500 for 25 August 2017

Be prepared for whatever comes next:

To receive detailed daily analysis, guidance and the updated daily Buy / Sell trigger levels being generated by the Trading the Line system before the market opens, and intraday alerts when appropriate, please become a Member and Sign up for Alerts & Observations – includes access to Members Area and the Explanatory Notes for all of the concepts discussed.

Disclaimer: This is the diary of a personal trading system, its methodology and the signals that it is producing. You are welcome to follow along but please understand that the information presented here is for educational purposes only. No recommendations are being made to buy, or sell stocks, options or futures contracts. Please consult your own financial advisor before making any investment decisions.