Oktoberfest

Time for an update on the general outlook for the S&P 500.

In my last report on 19 September the market was approaching an important test of strength. It had just traded above 2500 for the first time and was approaching an initial projection of the new T structure for a short term peak on 21 September. With the market showing significant strength it was a good time to ask the questions: Is there more? or will the round number target present a problem moving forward? I made the point that what happened after that projected peak would be very telling indeed, because the market was showing support for a much larger T structure and consequently significantly higher prices.

The answer came quickly, a few days of weakness which did not trigger a 'cover signal' and on 25 September a brief spike down to 2488 was all that was required to trigger a continuation Buy Signal that was itself confirmed by a movement above the slight declining resistance from that previous high, and the result was a rapid advance straight to 2550. This move without a doubt had many players incorrectly positioned for a decline below 2500 into an October low.
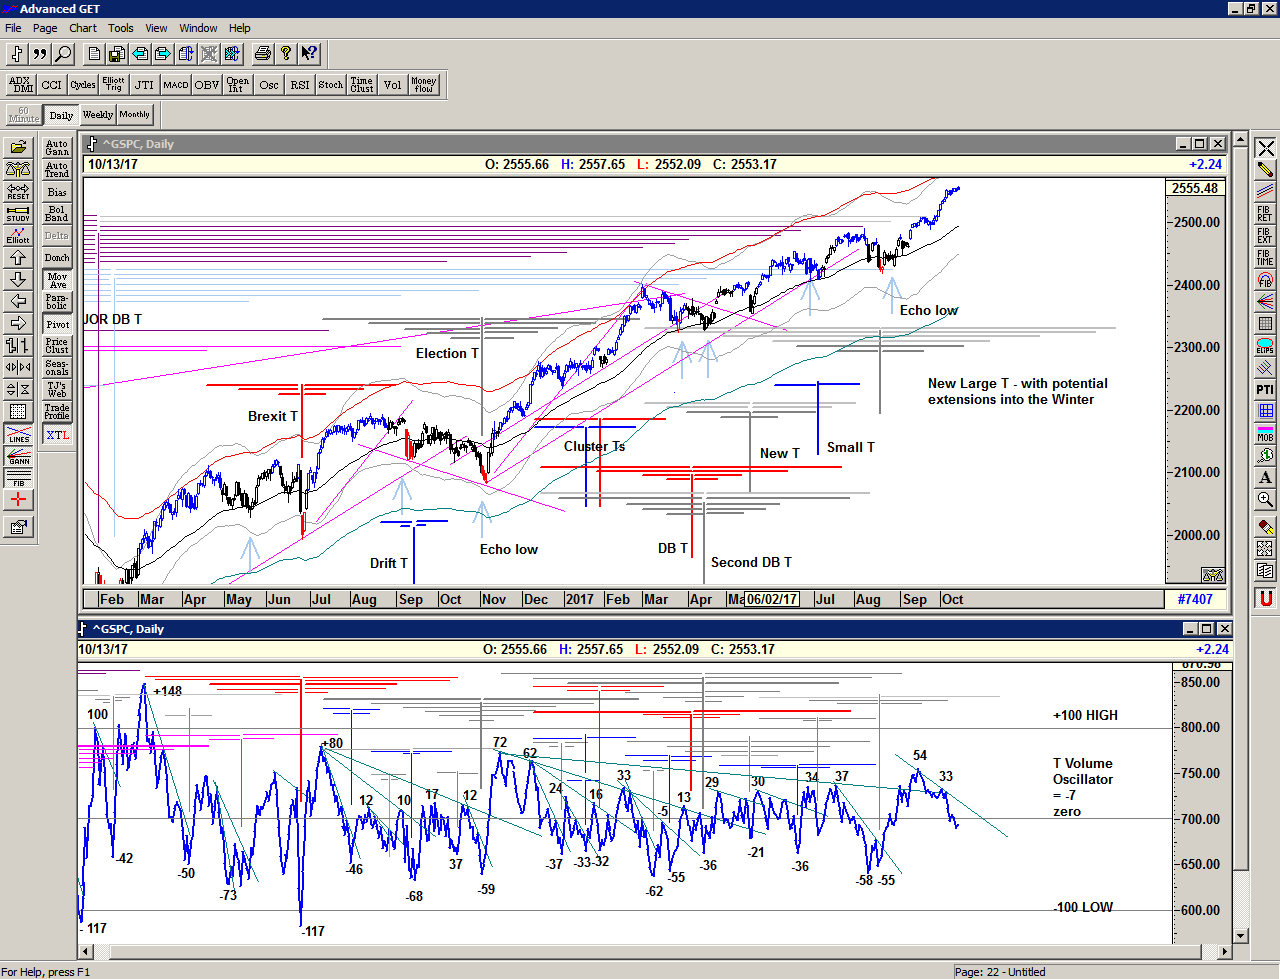
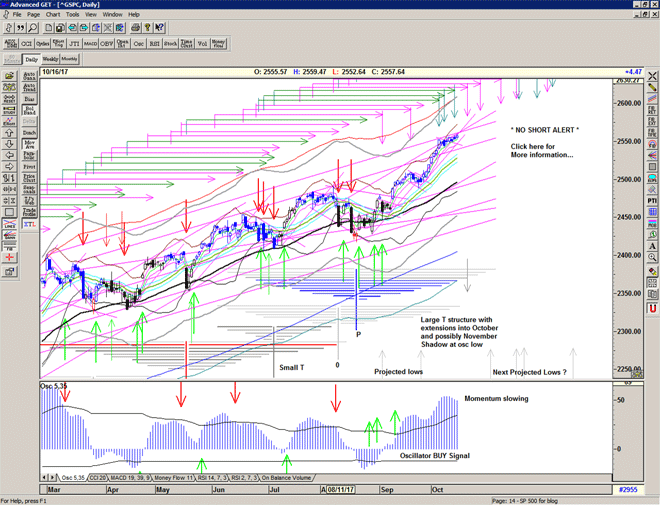
Chart of S&P 500 for 15 October 2017

And so, what's next? Are we there yet?

The market breezed through the first layer of potential resistance on a rising line from the 15 March peak but stalled at the parrallel rising line from the 1 March peak, and there it has remained for the past week, drifting slightly higher.

Firstly, this T structure is now already larger than its initial peak to low and so it is now drawing strength from the June declines, and this allows for several projections of peaks in the coming weeks, as well as the possibility of further projections higher afterwards.

The market has rapidly moved higher with significant strength and has signalled that the current T structure is large – potentially drawing strength from each of the declines earlier this year. This is because the oscillator has moved upwards through the very long cash build up line going right back to the previous oscillator high at 72 on 15 november 2016. If you want an explanation for a melt up in stocks this is it.

Secondly, the T volume oscillator has just dropped below the zero line. This in itself is not a sell signal but indicates a weakening of breadth and therefore a level of profit-taking is going on in the backgound. Not particularly surprising but well worth keeping an eye upon as this is also a characteristic of a distribution period prior to a possible decline – not necessarily a severe one. Because of this I am expecting to see a sideways market develop with probes to the downside as well as to the upside whilst the market establishes an upper range prior to the next move. Up or down.

If we do get a decline at one of the next projected peaks, then we watch the oscillator for bullish divergence and for a movement upwards through the short cash build up line of declining lows in the oscillator – the signature of the next small T structure.

If we do not get a decline but rather a continued sideways movement (such as July/August 2016 or December 2016-January 2017), then we continue to monitor price and oscillator carefully for signs that the exit will be either upwards or downwards.
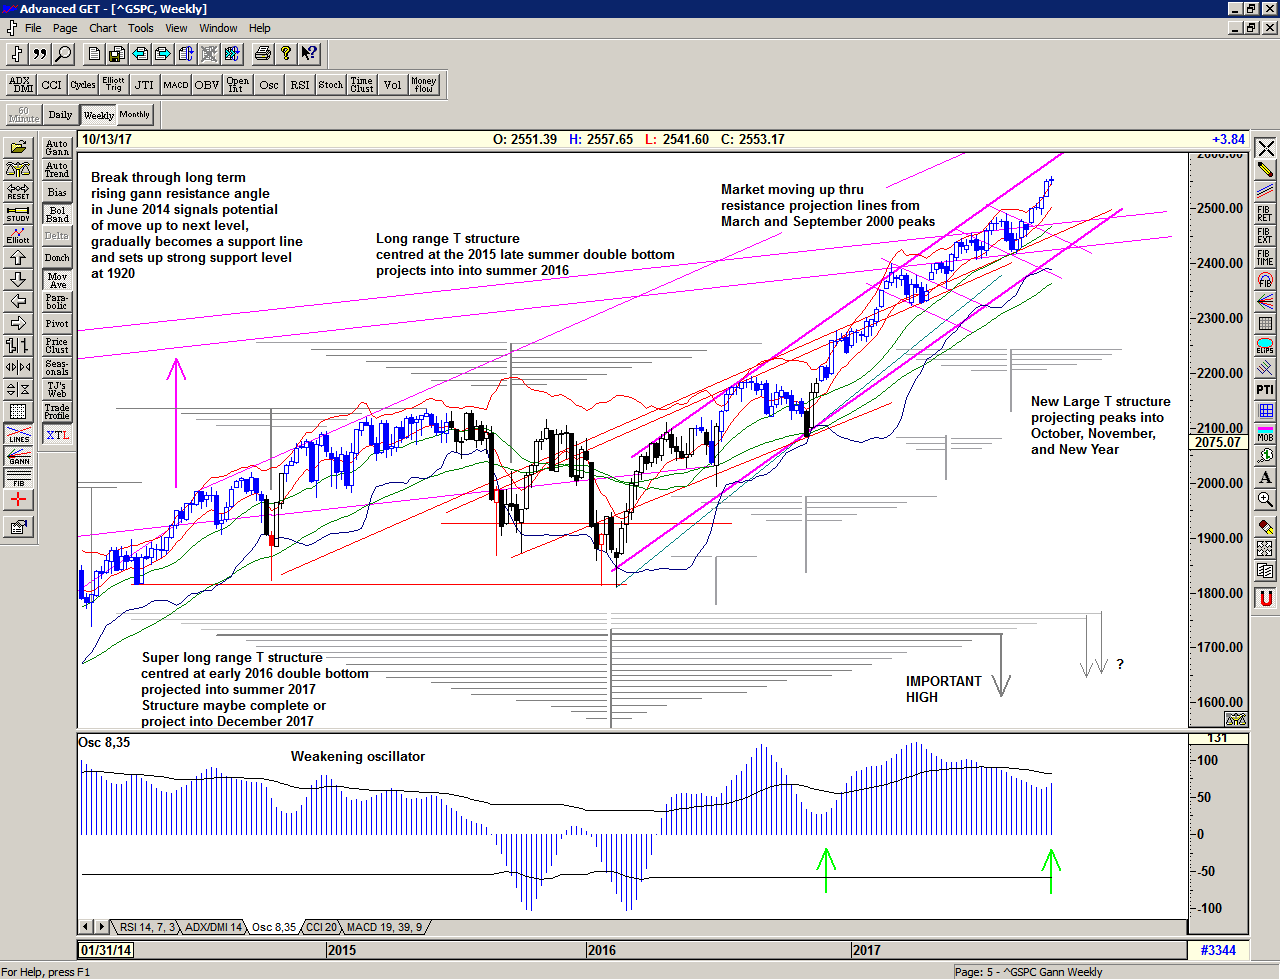
Chart of S&P 500 for 15 October 2017

Zooming out to the weekly chart, we can see that the market is rising well within a strongly defined channel and is perhaps playing catch up on some of the lost time in late 2015 and early 2016 after the market lost its rising trajectory in May 2015. That rising trajectory just might be the current target and if it was acheived we could be looking at 2700 by year end. That may of course be a little too much to ask for but if the current T structure was to peak out at the upper edge of the pink channel that would be in the region of 2660. Just food for thought.

The super long range T structure now looks complete but with the possibility that it also projects into December. Each of the important declines that start above the final price low project subsequent peaks, and because the most recent projections had little or no effect it would seem that the new recent structure is now more dominant.

The rapid movement upwards through the 2 rising lines from the March and September 2000 peaks adds to the strongly bullish picture. Those previous lows in the 2320s and 2420s are now significant moving forward. Look out for those levels if they are re-visited in the future.

We continue to watch the oscillators for clues, but allow price to be the leading indicator.

Be prepared for what is coming next:

For more detailed ongoing analysis of the developments in the S&P500 index on a daily basis, as well as my personal Buy and Sell Signal trigger levels, please Sign up for daily Alerts & Observations. This includes access to the Members Area for an archive of all of my alerts and updates and my Explanatory Notes pdf which gives detailed explanations on all of the concepts being discussed.

 

Confession

"God is not pleased. We have enemies of the faith in the kingdom".

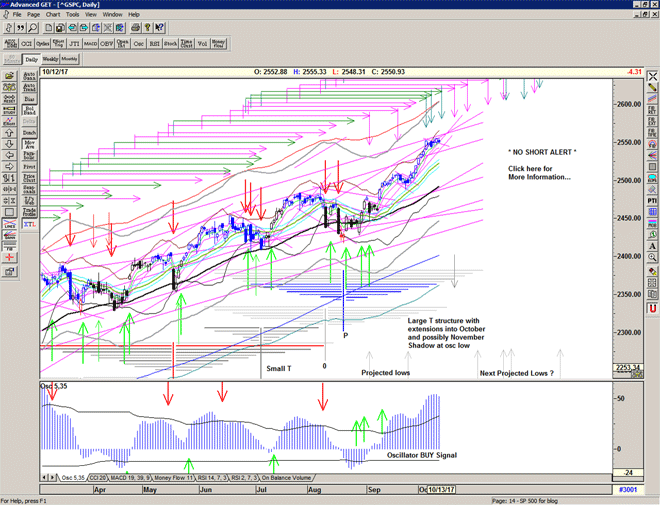
On Friday 13 October, 1307, numerous Knights Templar were arrested and coerced into false confessions of heresy – one of the origins of the superstition surrounding Friday the 13th.

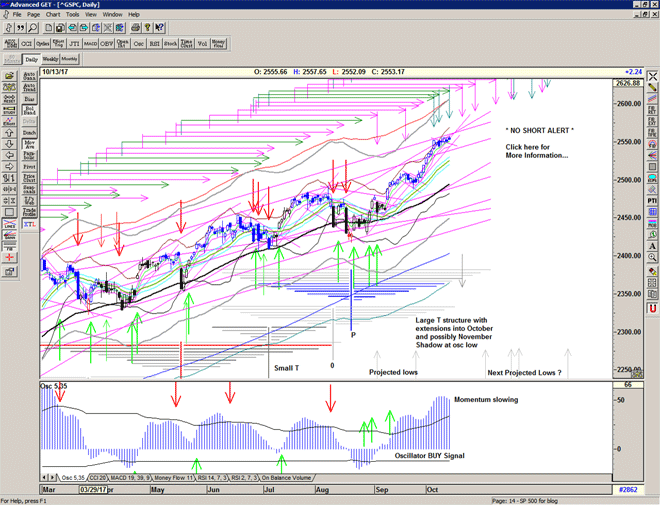
Market opens lower in-line with yesterday's short term peak projection from the T structure, takes a little looks-see at the all time high and re-traces.

Still very much within the recent sideways funk and a tight range that might be expected to expand a little as the market plays wait up / catch up.

T volume oscillator drops below zero and flashes a warning signal and momentum fades a little more.

The pulse high scheduled for today could certainly push the market down some but another arm of the T structure projects a high for Monday and this continues to suggest sideways and upwards until we reach a more defined peak.

Chart of S&P 500 for 13 October 2017

Be prepared for whatever comes next:

To receive detailed daily analysis, guidance and the updated daily Buy / Sell trigger levels being generated by the Trading the Line system before the market opens, and intraday alerts when appropriate, please become a Member and Sign up for Alerts & Observations – includes access to Members Area and the Explanatory Notes for all of the concepts discussed.

Disclaimer: This is the diary of a personal trading system, its methodology and the signals that it is producing. You are welcome to follow along but please understand that the information presented here is for educational purposes only. No recommendations are being made to buy, or sell stocks, options or futures contracts. Please consult your own financial advisor before making any investment decisions.


Freethought

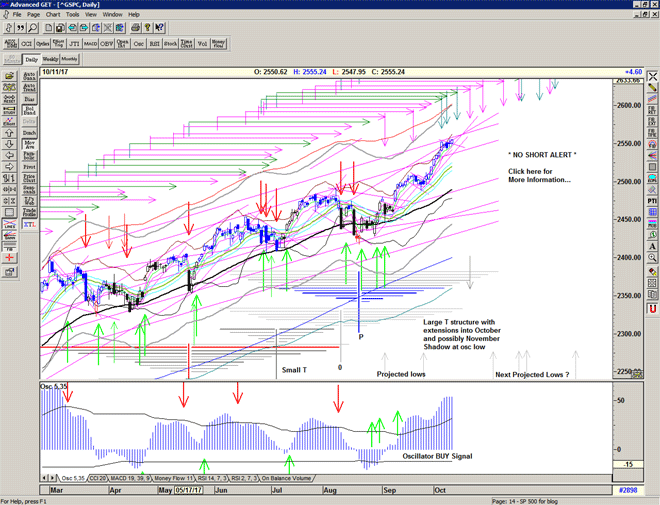
The market continues to edge higher into uncharted territory in-line with the next arm of the current T structure.

Still sitting at or just below the rising resistance line projected from the 1 March peak.

There is little resistance above this level and should it proceed it is probably a quick move to 2600 – site of the upper extreme of the channel. This would certainly surprise many participants.

There are some indications of deceleration in momentum and breadth and so perhaps a more likely outlook is a continued low volatility grind sideways with an upwards bias.

Another pulse high is scheduled for Friday and another peak is projected by the T structure for Monday.

Chart of S&P 500 for 12 October 2017

Be prepared for whatever comes next:

To receive detailed daily analysis, guidance and the updated daily Buy / Sell trigger levels being generated by the Trading the Line system before the market opens, and intraday alerts when appropriate, please become a Member and Sign up for Alerts & Observations – includes access to Members Area and the Explanatory Notes for all of the concepts discussed.

Disclaimer: This is the diary of a personal trading system, its methodology and the signals that it is producing. You are welcome to follow along but please understand that the information presented here is for educational purposes only. No recommendations are being made to buy, or sell stocks, options or futures contracts. Please consult your own financial advisor before making any investment decisions.


Challenge

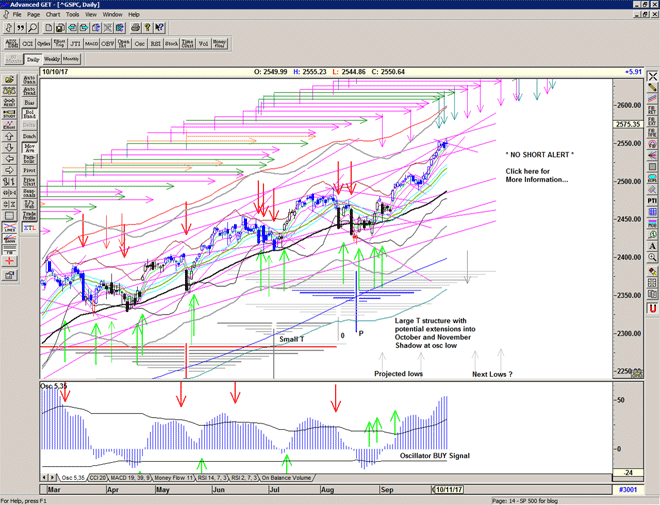
Market opens up and briefly tests a token new high on the rising resistance line from the 1 March peak.

The OSC oscillator starts to flatten off and the T volume oscillator lifts back above zero.

The outlook continues, for now, to be a sideways grind with an upwards bias and a consolidation within an upper range as the market assimilates the recent price discovery.

Chart of S&P 500 for 10 October 2017

Be prepared for whatever comes next:

To receive detailed daily analysis, guidance and the updated daily Buy / Sell trigger levels being generated by the Trading the Line system before the market opens, and intraday alerts when appropriate, please become a Member and Sign up for Alerts & Observations – includes access to Members Area and the Explanatory Notes for all of the concepts discussed.

Disclaimer: This is the diary of a personal trading system, its methodology and the signals that it is producing. You are welcome to follow along but please understand that the information presented here is for educational purposes only. No recommendations are being made to buy, or sell stocks, options or futures contracts. Please consult your own financial advisor before making any investment decisions.


Double Ten

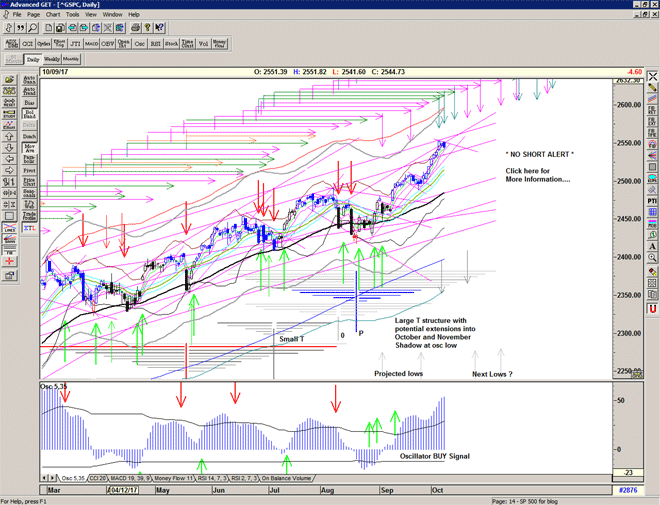
The second pulse high initiates a little more selling, and this could now be setting up a sideways move as the market finds a little resistance at the 2550 mark.

Although momentum remains strong, the T volume oscillator drops down to the zero level – an inflection point in breadth and an indication that we may have seen a short-term peak.

Still, this helps to relieve some of the pressure on price and there is plenty of rising support below.

Chart of S&P 500 for 10 October 2017

Be prepared for whatever comes next:

To receive detailed daily analysis, guidance and the updated daily Buy / Sell trigger levels being generated by the Trading the Line system before the market opens, and intraday alerts when appropriate, please become a Member and Sign up for Alerts & Observations – includes access to Members Area and the Explanatory Notes for all of the concepts discussed.

Disclaimer: This is the diary of a personal trading system, its methodology and the signals that it is producing. You are welcome to follow along but please understand that the information presented here is for educational purposes only. No recommendations are being made to buy, or sell stocks, options or futures contracts. Please consult your own financial advisor before making any investment decisions.


Columbus

A slight pullback from the highs helps to release some of the pressure, in-line with the thursday's pulse high and Friday's arm of the T structure.

Monday brings another pulse high, followed quickly by another arm of the T structure and several more highs that are projected by the June declines. This is suggestative of a continued choppy grind higher or sideways move ahead.

The oscillators continue to be strong and we should expect to see at least one or two 'tests' of the recent strength before this advance is completed.

Chart of S&P 500 for 09 October 2017

Be prepared for whatever comes next:

To receive detailed daily analysis, guidance and the updated daily Buy / Sell trigger levels being generated by the Trading the Line system before the market opens, and intraday alerts when appropriate, please become a Member and Sign up for Alerts & Observations – includes access to Members Area and the Explanatory Notes for all of the concepts discussed.

Disclaimer: This is the diary of a personal trading system, its methodology and the signals that it is producing. You are welcome to follow along but please understand that the information presented here is for educational purposes only. No recommendations are being made to buy, or sell stocks, options or futures contracts. Please consult your own financial advisor before making any investment decisions.


Noodles

Yesterday's high becomes today's low as the market stretches higher with barely a pullback in sight. This is catch up quick behaviour as the market proceeds higher without hanging around waiting for the bystanders, and is, I suspect, playing noodles with those insisting on selling short because 'we must have reached a top'.

We may find some resistance here – on the rising line from the 1 March peak – but really there is no fundamental reason why the market should stop here, and the upper extreme* reaches of the channel are now looking very attractive. Note that the February move into the 1 March peak was a 100 point near vertical move into the upper extreme* of the channel where it stopped.

In the meantime we have a projection for a high today from the large T structure, but this is just the first in a series of several that I am projecting from the June declines. This suggests a continued grind higher with perhaps a few pauses or pullbacks until we see a point of exhaustion or an important target is acheived.

*The upper & lower extremes of the channel are my approximation of Terry Laundry's proprietary Energy channel.
For more information please sign up for the daily updates.

Chart of S&P 500 for 06 October 2017

Be prepared for whatever comes next:

To receive detailed daily analysis, guidance and the updated daily Buy / Sell trigger levels being generated by the Trading the Line system before the market opens, and intraday alerts when appropriate, please become a Member and Sign up for Alerts & Observations – includes access to Members Area and the Explanatory Notes for all of the concepts discussed.

Disclaimer: This is the diary of a personal trading system, its methodology and the signals that it is producing. You are welcome to follow along but please understand that the information presented here is for educational purposes only. No recommendations are being made to buy, or sell stocks, options or futures contracts. Please consult your own financial advisor before making any investment decisions.


Release Me

Please, release me, let me go,
For I don't love you anymore.
To waste our lives would be a sin,
Release me and let me love again.

– Dominic Miller / Gordon Sumner, 1949

6 days straight up, is there some more? (…probably)

Today is the first of a series of scheduled pulse highs and tomorrow is another arm of the T structure with further peaks projected in the weeks ahead.

A pause hereabouts would help to release some of the pressure, but all indicators are pointing up.

Chart of S&P 500 for 05 October 2017

Be prepared for whatever comes next:

To receive detailed daily analysis, guidance and the updated daily Buy / Sell trigger levels being generated by the Trading the Line system before the market opens, and intraday alerts when appropriate, please become a Member and Sign up for Alerts & Observations – includes access to Members Area and the Explanatory Notes for all of the concepts discussed.

Disclaimer: This is the diary of a personal trading system, its methodology and the signals that it is producing. You are welcome to follow along but please understand that the information presented here is for educational purposes only. No recommendations are being made to buy, or sell stocks, options or futures contracts. Please consult your own financial advisor before making any investment decisions.


Faraway, so close

If I could stay, then the night would give you up.
Stay, and the day would keep its trust.
Stay, and the night would be enough.

Faraway, so close
Up with the static and the radio.
With satellite television
You can go anywhere:
Miami, New Orleans
London, Belfast and Berlin.

U2, Stay (Faraway, so close), 1993

Another high as the bull continues to raise its horns and advance.

All indications pointing up, and now looking similar to the February move which was a 5 day 50 point straight up break outside the bollingers type move and was followed by as much again into the eventual peak. Just a thought and for a possible comparison but that would place the upper extreme of the channel – 2580-2600 – well within range.

Chart of S&P 500 for 04 October 2017

Be prepared for whatever comes next:

To receive detailed daily analysis, guidance and the updated daily Buy / Sell trigger levels being generated by the Trading the Line system before the market opens, and intraday alerts when appropriate, please become a Member and Sign up for Alerts & Observations – includes access to Members Area and the Explanatory Notes for all of the concepts discussed.

Disclaimer: This is the diary of a personal trading system, its methodology and the signals that it is producing. You are welcome to follow along but please understand that the information presented here is for educational purposes only. No recommendations are being made to buy, or sell stocks, options or futures contracts. Please consult your own financial advisor before making any investment decisions.

Zooropa

Zooropa… better by design
Zooropa… fly the friendly skies
Through appliance of science
We've got that ring of confidence…

And I have no compass
And I have no map
And I have no reasons
No reasons to get back

And I have no religion
And I don't know what's what
And I don't know the limit
The limit of what we've got

U2, Zooropa, 1993

The market continues to climb towards the upper extreme range of the channel, now in-line with the rising line from March 15.

Although rather overstretched now, the oscillators are suggesting further.

… and over in Zooropa, Germany celebrates its re-unification with the Dax up an impressive 7% in the last month.

I mention the Dax because it helps to contextualise this advance which many seem to be in disbelief of. It seems likely that many traders were incorrectly positioned after the August peaks and expected to see some further lows in September and October. The continued bearish chatter and disbelief in this bull market will almost certainly continue to fuel higher prices as more and more traders are forced to cover short positions and this in itself could propel the market to further significantly higher levels.

Remember that I have pointed out that the market was starting to break through some extremely long resistance lines on the weekly chart – in the recent Free Report. Lines that originate from previous bull markets tops. It seems that we are progressing through these levels and it now seems that 2400 to 2500 may be long term support levels moving forward. At the same time the market started to activate the very long cash build up line – potentially setting up a much larger T structure. We may need to get used to the idea that the market was previously rather 'cheap' and now it is 'less cheap', rather than over-priced.

Chart of S&P 500 for 03 October 2017

Be prepared for whatever comes next:

To receive detailed daily analysis, guidance and the updated daily Buy / Sell trigger levels being generated by the Trading the Line system before the market opens, and intraday alerts when appropriate, please become a Member and Sign up for Alerts & Observations – includes access to Members Area and the Explanatory Notes for all of the concepts discussed.

Disclaimer: This is the diary of a personal trading system, its methodology and the signals that it is producing. You are welcome to follow along but please understand that the information presented here is for educational purposes only. No recommendations are being made to buy, or sell stocks, options or futures contracts. Please consult your own financial advisor before making any investment decisions.