Gunfight

There's always a man faster on the draw than you are,
and the more you use a gun, the sooner you're gonna run into that man.
Gunfight at the O.K. Corral, 1957, Dir: John Sturges

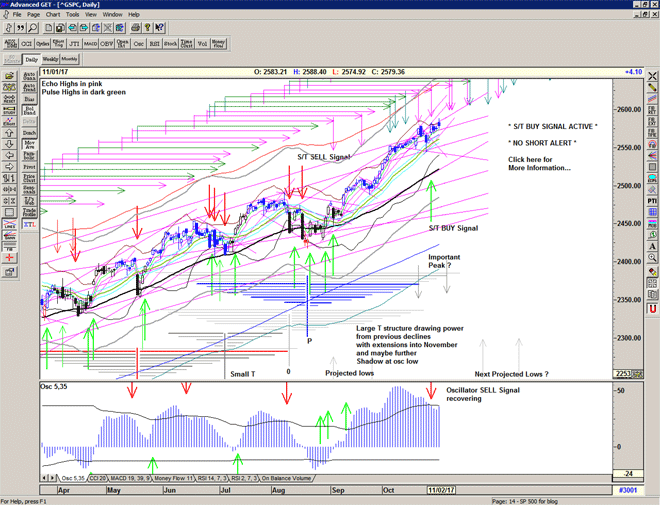
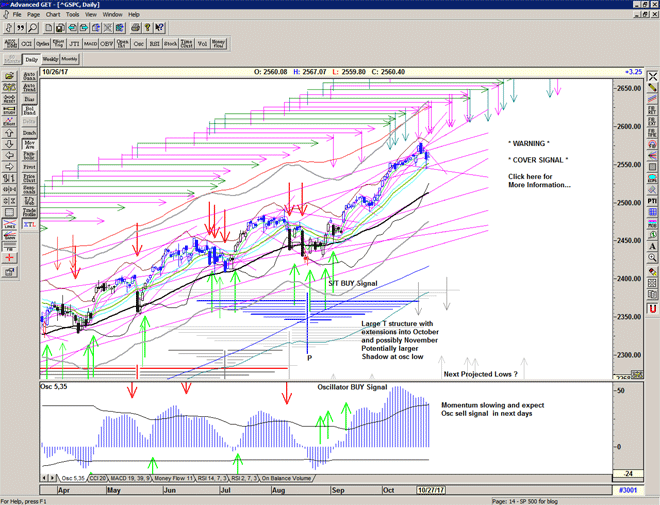
Straight down from the open and quickly sliced through the 'cover signal line' into the mid channel for a strong recovery bounce that very nearly regained the Buy Signal line, but not quite.

This is follow through from the selling initiated by the projected high and echo high and leaves a nasty declining resistance line to be negociated in due course. It confirms 20 October as an important short term peak at the strong arm of the T structure.

There may well be some follow through from the bounce as we have another projected high for tomorrow and another echo high scheduled for tomorrow or Friday.

26 October 2017

Be prepared for whatever comes next:

To receive detailed daily analysis, guidance and the updated daily Buy / Sell trigger levels being generated by the Trading the Line system before the market opens, and intraday alerts when appropriate, please become a Member and Sign up for Alerts & Observations – includes access to Members Area and the Explanatory Notes for all of the concepts discussed.

Disclaimer: This is the diary of a personal trading system, its methodology and the signals that it is producing. You are welcome to follow along but please understand that the information presented here is for educational purposes only. No recommendations are being made to buy, or sell stocks, options or futures contracts. Please consult your own financial advisor before making any investment decisions.


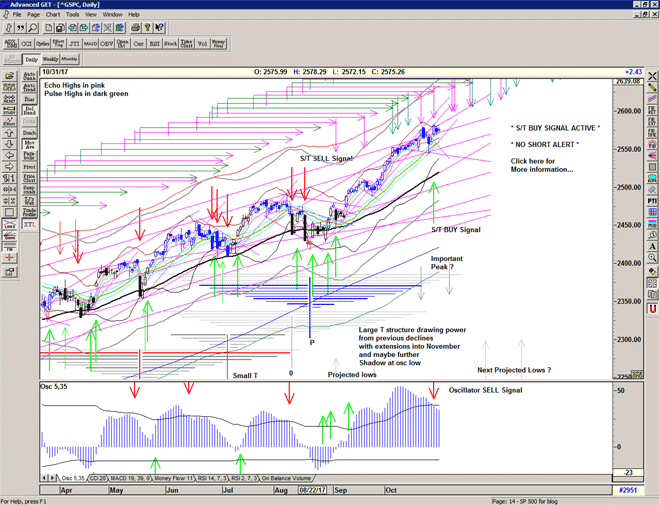
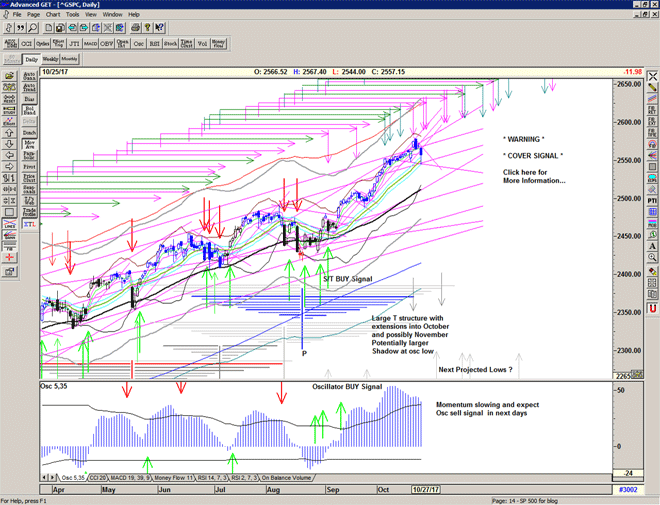
Cover Signal confirmed at 2559

A nasty drop and some relentless selling in the morning, followed by a sharp bounce and rally off the Mid-channel which is often an initial support on first visit.

Technically some damage done and just failed to close back above the important Buy Signal line.

Therefore a cover signal at 2559 for now whilst the market stabilises.

And that is a nasty declining angle from the all time high that we will need to negociate moving forwards

Saint Crispin’s

“From this day to the ending of the world,
But we in it shall be remembered –
We few, we happy few, we band of brothers;
For he to-day that sheds his blood with me
Shall be my brother; be he ne’er so vile,
This day shall gentle his condition;
And gentlemen in England now-a-bed
Shall think themselves accurs’d they were not here,
And hold their manhoods cheap whiles any speaks
That fought with us upon Saint Crispin’s day.”
William Shakespeare, Henry V

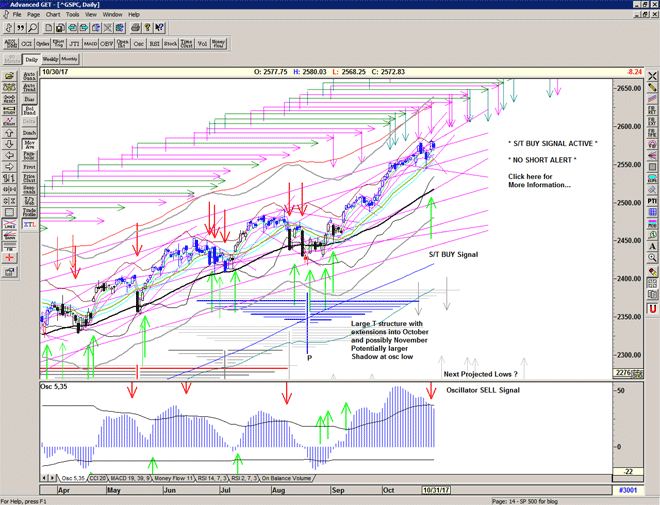
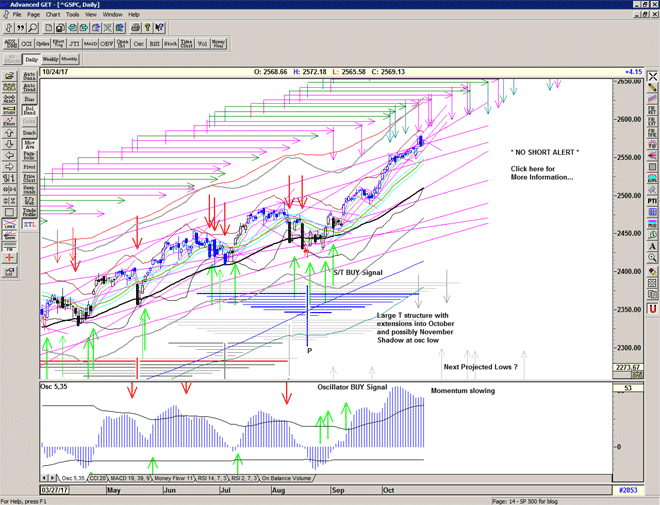
Initial bounce sold into, some unfinished business maybe but still holding up above Friday's gap.

Chart of S&P 500 for 24 October 2017

Be prepared for whatever comes next:

To receive detailed daily analysis, guidance and the updated daily Buy / Sell trigger levels being generated by the Trading the Line system before the market opens, and intraday alerts when appropriate, please become a Member and Sign up for Alerts & Observations – includes access to Members Area and the Explanatory Notes for all of the concepts discussed.

Disclaimer: This is the diary of a personal trading system, its methodology and the signals that it is producing. You are welcome to follow along but please understand that the information presented here is for educational purposes only. No recommendations are being made to buy, or sell stocks, options or futures contracts. Please consult your own financial advisor before making any investment decisions.


August Echo

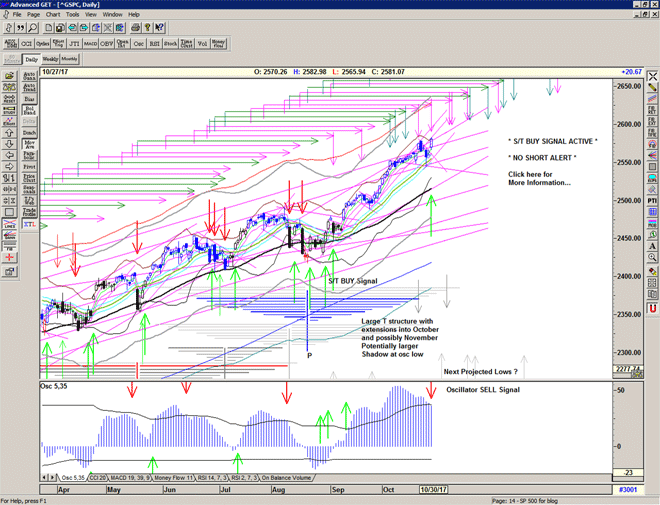
The market opens at all time highs and initiates a retracement.

A slow but persistent day of selling displaying a distinct lack of buying power – the effects of an Echo high* and an important peak projection of the T structure.

How much of a retracement is required remains to be seen, but for now, the market is still well above the Buy signal line, and additional peaks are projected for later this week and into November.

It looks to me that we are now entering a period of sideways consolidation that could see additional highs and lows as the market defines its new upper range, whilst building energy for the next move.

* This is the first of a series of echo highs projected from the August period. For more information please subscribe to the daily updates.

Chart of S&P 500 for 24 October 2017

Be prepared for whatever comes next:

To receive detailed daily analysis, guidance and the updated daily Buy / Sell trigger levels being generated by the Trading the Line system before the market opens, and intraday alerts when appropriate, please become a Member and Sign up for Alerts & Observations – includes access to Members Area and the Explanatory Notes for all of the concepts discussed.

Disclaimer: This is the diary of a personal trading system, its methodology and the signals that it is producing. You are welcome to follow along but please understand that the information presented here is for educational purposes only. No recommendations are being made to buy, or sell stocks, options or futures contracts. Please consult your own financial advisor before making any investment decisions.


Apples and oranges

Now that's the spirit !

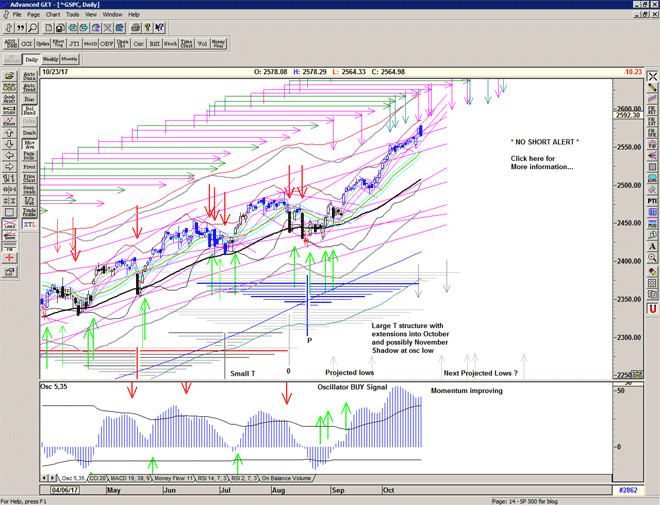
Friday's push higher accurately projected by the T structure, with a solid gap up and go and close at the highs type day as the market continues to leave bystanders behind. This train waits for no one.

Momentum ticks up, as does the T volume oscillator.

This is also in-line with the scheduled echo high and so it remains to be seen whether this is an important peak or whether the additional projections will continue to lift the market higher next week. Hedge and lock in profits accordingly.

In the meantime, higher highs continue to beget higher highs. For those who still do not understand why the market is moving higher and will probably continue much higher in the coming months, please read my recent free reports.

Enjoy the weekend.

Chart of S&P 500 for 23 October 2017

Be prepared for whatever comes next:

To receive detailed daily analysis, guidance and the updated daily Buy / Sell trigger levels being generated by the Trading the Line system before the market opens, and intraday alerts when appropriate, please become a Member and Sign up for Alerts & Observations – includes access to Members Area and the Explanatory Notes for all of the concepts discussed.

Disclaimer: This is the diary of a personal trading system, its methodology and the signals that it is producing. You are welcome to follow along but please understand that the information presented here is for educational purposes only. No recommendations are being made to buy, or sell stocks, options or futures contracts. Please consult your own financial advisor before making any investment decisions.


Catal-exit

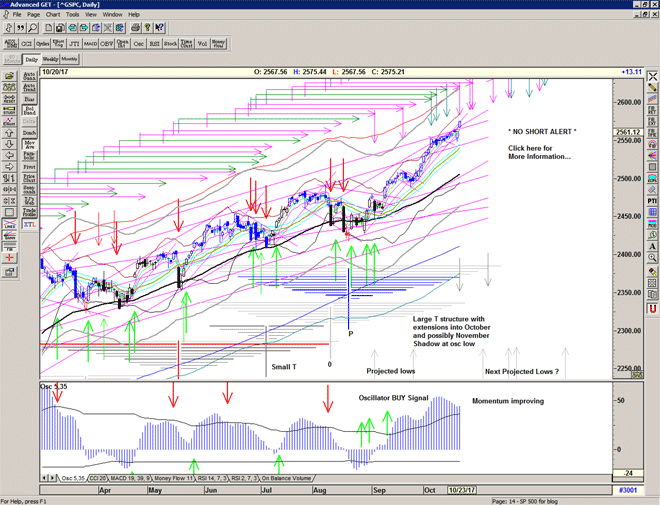
A gap down for a test of the current advance found important support and plentiful buyers for a text book recovery all the way back to close at a token new high.

The strength is in-line with the expected peak projected by the major arm of the T structure which projects a peak for today. There is also an echo high scheduled for today and the combination suggests that we may see some strong selling either today or just after the high on monday.

With one successful test of the recent advance acheived, I would now expect to see the market start to define an upper range with a series of probes to the upside and to the downside whilst continuing its grind slightly upwards and sideways.

Chart of S&P 500 for 20 October 2017

Be prepared for whatever comes next:

To receive detailed daily analysis, guidance and the updated daily Buy / Sell trigger levels being generated by the Trading the Line system before the market opens, and intraday alerts when appropriate, please become a Member and Sign up for Alerts & Observations – includes access to Members Area and the Explanatory Notes for all of the concepts discussed.

Disclaimer: This is the diary of a personal trading system, its methodology and the signals that it is producing. You are welcome to follow along but please understand that the information presented here is for educational purposes only. No recommendations are being made to buy, or sell stocks, options or futures contracts. Please consult your own financial advisor before making any investment decisions.


Blue skies and flowers

“I learned that just beneath the surface there's another world, and still different worlds as you dig deeper.
I knew it as a kid, but I couldn't find the proof. It was just a kind of feeling.
There is goodness in blue skies and flowers, but another force – a wild pain and decay – also accompanies everything.”
David Lynch

Still gently pushing at the highs, teasing us with the possibility of breaking higher.

Overnight breaking news from Catalonia has send the markets down a little. This will be the first real test of the market's strength since 9 October and how the cash market responds will be telling.

Be prepared for a cover signal should the markets continue to move lower today.

Chart of S&P 500 for 19 October 2017

Be prepared for whatever comes next:

To receive detailed daily analysis, guidance and the updated daily Buy / Sell trigger levels being generated by the Trading the Line system before the market opens, and intraday alerts when appropriate, please become a Member and Sign up for Alerts & Observations – includes access to Members Area and the Explanatory Notes for all of the concepts discussed.

Disclaimer: This is the diary of a personal trading system, its methodology and the signals that it is producing. You are welcome to follow along but please understand that the information presented here is for educational purposes only. No recommendations are being made to buy, or sell stocks, options or futures contracts. Please consult your own financial advisor before making any investment decisions.


The main thing

“you just had to be still and have faith, that was the main thing.”
Jim Dodge, Fup, 1983

The market continues with a little shake and grind to wander slowly higher in what can only be described as an exceptionally calm and linear manner just below the resistance line.

With such apparent smoothness it seems likely that the market will use every last bit of the current T structure, and so we should watch each projected arm of the structure carefully.

It seems that the market has yet to find its target, but at some point it will, and then I would expect the market to open out into a larger range, pushing out in both directions and establish some new support levels.

Chart of S&P 500 for 17 October 2017

Be prepared for whatever comes next:

To receive detailed daily analysis, guidance and the updated daily Buy / Sell trigger levels being generated by the Trading the Line system before the market opens, and intraday alerts when appropriate, please become a Member and Sign up for Alerts & Observations – includes access to Members Area and the Explanatory Notes for all of the concepts discussed.

Disclaimer: This is the diary of a personal trading system, its methodology and the signals that it is producing. You are welcome to follow along but please understand that the information presented here is for educational purposes only. No recommendations are being made to buy, or sell stocks, options or futures contracts. Please consult your own financial advisor before making any investment decisions.


On the Edge

“…I don't rightly know. It just ain't possible to explain some things, maybe even most things. It's interesting to wonder on them and do some speculation, but the main thing is you have to accept it – take it for what it is, and get on with your getting."
Jim Dodge, Fup, 1983

Another high in-line with the current T structure. And another high is scheduled for later this week as the market continues to grind casually higher.

No signs of any real weakness yet, just some profit-taking at the (strong) resistance line from 1 March as the market waits cautiously for a catalyst. Perhaps on the Edge for something…

Chart of S&P 500 for 17 October 2017

Be prepared for whatever comes next:

To receive detailed daily analysis, guidance and the updated daily Buy / Sell trigger levels being generated by the Trading the Line system before the market opens, and intraday alerts when appropriate, please become a Member and Sign up for Alerts & Observations – includes access to Members Area and the Explanatory Notes for all of the concepts discussed.

Disclaimer: This is the diary of a personal trading system, its methodology and the signals that it is producing. You are welcome to follow along but please understand that the information presented here is for educational purposes only. No recommendations are being made to buy, or sell stocks, options or futures contracts. Please consult your own financial advisor before making any investment decisions.


Conqueror

“I have persecuted its native inhabitants beyond all reason. Whether gentle or simple, I have cruelly oppressed them; many I unjustly inherited; Innumerable multitudes, especially in the county of York, perished through me by famine or the sword."
William the Conqueror

The market continues to gently push against the rising resistance in a continuation of the low volatility drift higher whilst momentum and breadth fade – suggesting that we may be entering a sideways distribution phase prior to a possible decline, most probably towards the end of the current T structure.

However, the current indications are that any decline will be relatively shallow and that the current T structure is potentially larger and could draw strength from earlier declines than drawn.

Chart of S&P 500 for 16 October 2017

Be prepared for whatever comes next:

To receive detailed daily analysis, guidance and the updated daily Buy / Sell trigger levels being generated by the Trading the Line system before the market opens, and intraday alerts when appropriate, please become a Member and Sign up for Alerts & Observations – includes access to Members Area and the Explanatory Notes for all of the concepts discussed.

Disclaimer: This is the diary of a personal trading system, its methodology and the signals that it is producing. You are welcome to follow along but please understand that the information presented here is for educational purposes only. No recommendations are being made to buy, or sell stocks, options or futures contracts. Please consult your own financial advisor before making any investment decisions.