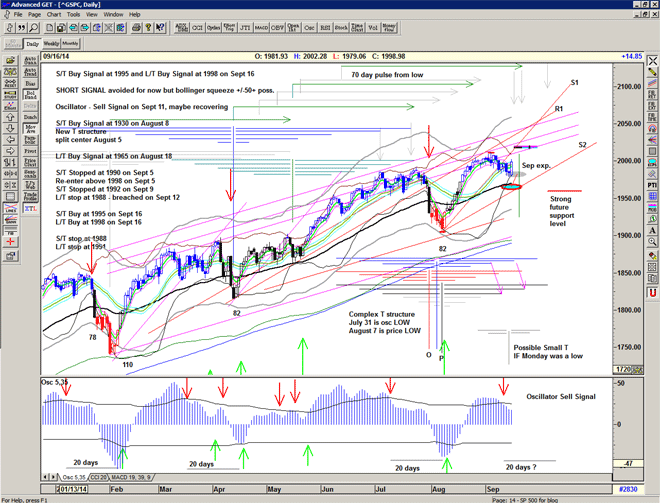
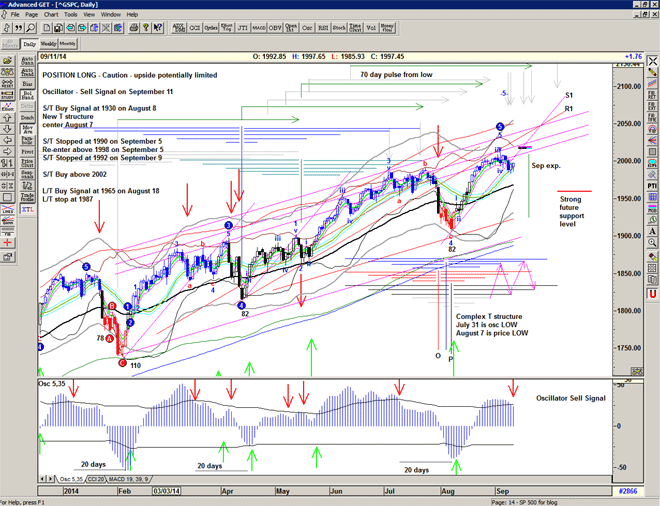
Buy Signal above 1956

With the opening up above 1956, a longer term (L/T) Buy Signal has been made and the mid-point can now be used as a stop in the case of any pullbacks. Target new highs ahead.

Recent trend analysis seems to suggest that the uptrend is accelerating – if this is the case we may see 2040 or even 2050 by end of September.

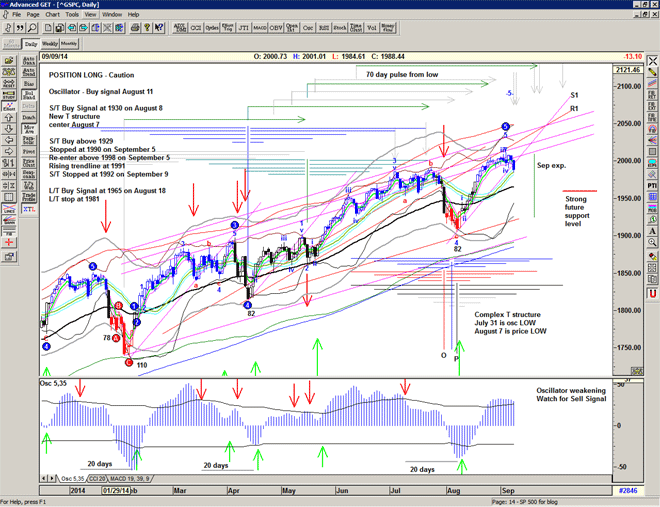
Buy Signal above 1929

With Friday's relief rally (after Futures sell-off overnight) the market made a Buy Signal during the last few hours and closed above 1929.

A rally to the mid-line at 1955-8 is now on the cards, and possibly a move back to the all-time high for a second look (maybe a kiss goodbye?)

Get is still saying resistance at 1944 and possible lowere low but the T structure is suggestive of a rally into early October. A new high in the 2020's – not out of the question. Certainly if the Russian problem is over?

Chart of S&P500 for 11 August 2014

Oops Argentina!

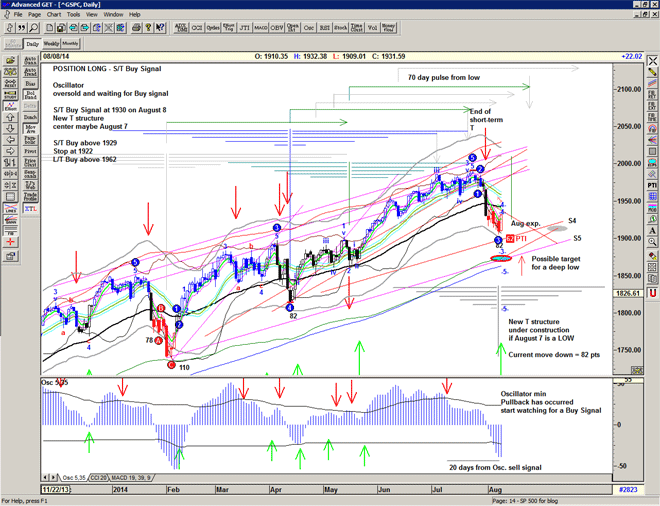
Yesterday's non response to the Fed + the overnight selloff (Argentina probable default) indicate that a Sell Signal should occur today at the open. It is clear that we need a pullback – but how far down?

Initial support indicated by MOB is 1945 at the 55EMA, then 1935, then 1920s.

As sell signals can rapidly develop into Buy signals at lower levels, I have drawn a possible T structure that could develop out of this, and will re-draw daily.

Chart of S&P500 for 31 July 2014

Sell the news

Blow out news from TWTR, X and GDP
Sell the news and wait for the FED.

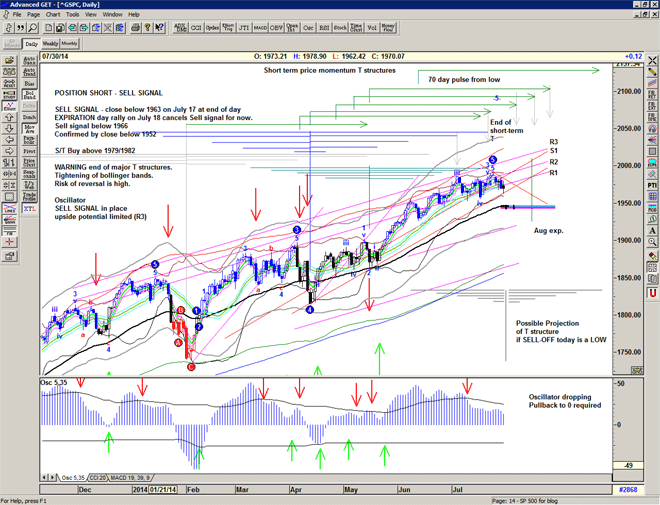
A Sell signal is developing today after the early pop-up and drop – currently at 1963.5 at midday
this is on a major trendline from the April low and IF it holds today we could get a rally back to the highs (and beyond)

The last 2 Fed rallys were both about +50 points from similar squeezes – 2015 or 1915?
By end of day we should have a confirmed signal eitherway.

target 1990

Short-term continuation buy signal at 1973, and the target for the End of the 2 short-term T structures would now appear to be 1990. Option interest for friday expiration also suggests resistance at 1990 and support at 1950.

The oscillator sell signal remains in place indicating the toppy nature of the market.

Chart of S&P500 for 15 July 2014

Oscillator sell signal

An interesting recovery from off the lows yesterday, indicating that the bulls are still wanting to buy the dips.
Can we grind on higher to make the projected peak at 2000?

The oscillator sell signal suggests that the upside is now limited to 1985 or perhaps a stretch to 2000 which may be the surprise for next week?

Expect toppy and choppy though August.

Chart of S&P500 for 11 July 2014

Sell the news ?

Yesterday's Fed induced rally looks like it wasn't enough to prevent the oscillator declining and will most probably create a sell signal today – unless we get a rally of +10 points or so. Unlikely at the moment due to the negative futures (-6), but not out of the question.

An oscillator sell signal isn't necessarily a short signal but does imply that any rallies will not have legs and that it is relatively safe to sell credit spreads above the recent highs.

A move below 1954 sets up a short signal.

Chart of S&P500 for 10 July 2014

Cover at 1968

Short term stop hit at 1968, and closed below, indicating the possibility of a deeper correction.

It looks like we did have a momentum peak on July 3.
Note that momentum peaks are often 65-66 days apart and a re-test will sometimes follow to set up a steeper decline.
If we recover from here I would expect to see a re-test of 1985, perhaps even a strike at 2000 towards the end of next week for July expiration.
Otherwise a decline to 1940 may be on.

Lots of rising support lines in the 1950 area, so benefit of doubt still on.

Chart of S&P500 for 9 July 2014