S/T Buy Signal at 1968
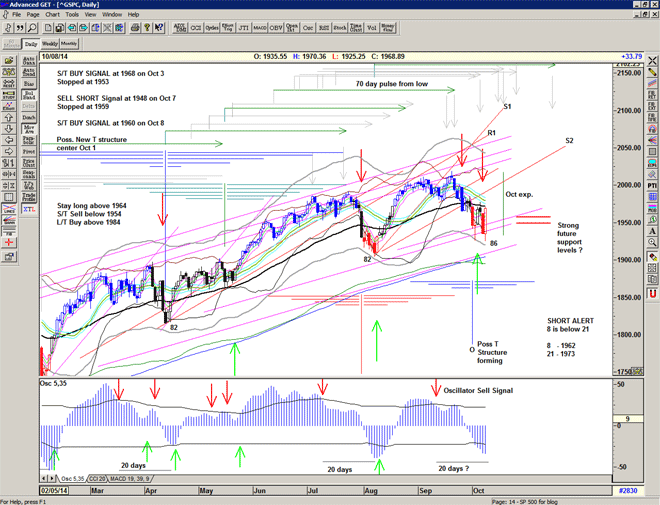
Heading into the Friday close we are holding above the 1965 Buy Signal level.
My only reservations are the proximity of the 55 ema at 1973 and possible 70 day high coming in about now which could see a pullback early next week.
Sell Warning ?
Stopped out on S/T at 1997 and L/T at 1993 for small net loss of -3 points
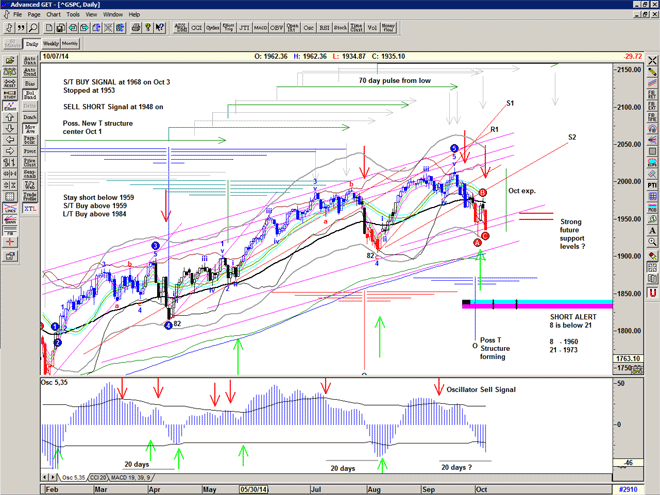
The Blue T structure certainly does seem to be working out, in which case expect to see a few days of weakness, perhaps a test of the 55 at about 1975 and S2 in the low 1970s.
And then an attempt at a rally into October 1/2
Market starting to look a bit weaker now, but this ol lady aint done just yet
(maybe soon though)
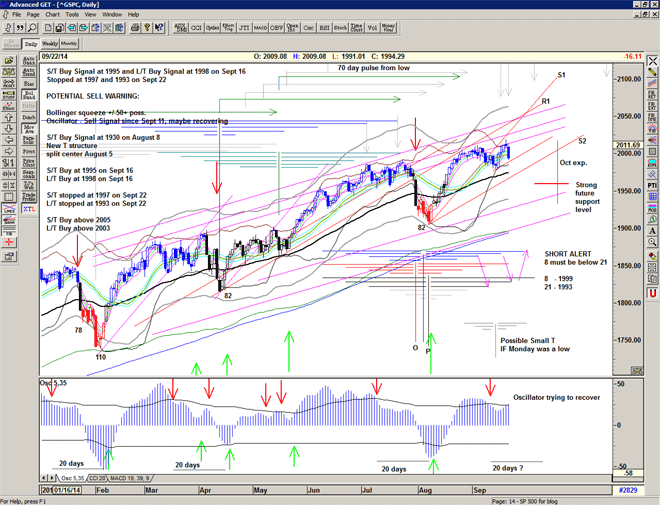
S/T Buy Signal at 1995
Slightly high risk due to the contracted bollingers but the market is making a Buy Signal above 1994.
If the follow through holds then also an L/T Buy at 1998.
Looks like Fed magic again.
Oscillator Sell Signal
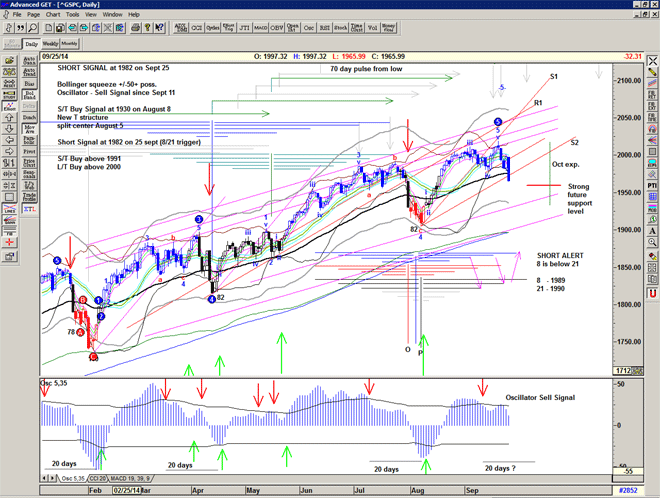
Oscillator gives us a Sell Signal or Sell Warning – which has in the past warned that price may only make a token new high before selling off.
It is important not to think of that as a short signal until we see a confirmation signal such as a move below the mid-point or a short-trigger (8/21 crossover), but does allow us to consider entering an OTM call credit spread as a hedge.
Today's action brings us back within easy strike of the all time high again and yesterdays low held (for now). All good signs that the price structure is now following the split centre (blue).
We should then theoretically grind higher into september 17, pullback into the 23rd, and maybe higher into the 30th.
S/T stopped at 1992
S/T Buy Signal at 1998
With recovery back above 1995-1998, and confirmed by a close above 2006, the S/T Buy Signal is re-affirmed.
S/T stop at 1990
Weakness and failure at the opening trigger the S/T stop
Buy Signal at 1931, Stop at 1990 – 59 points.