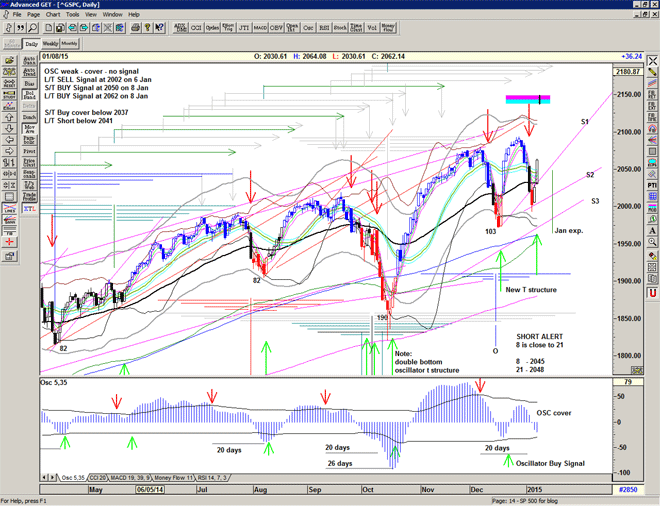
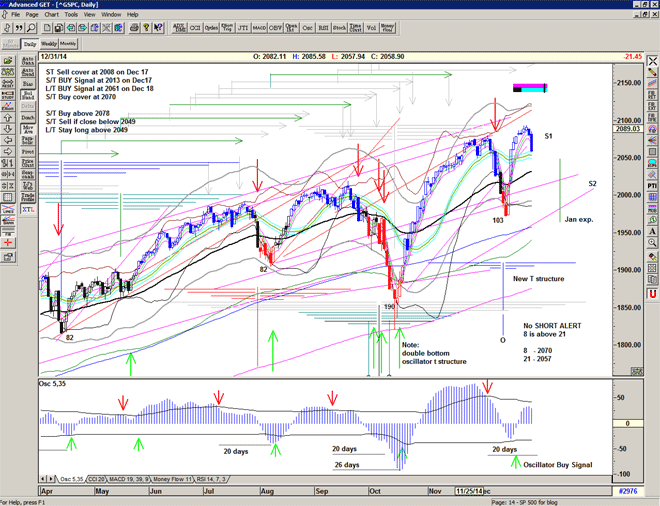
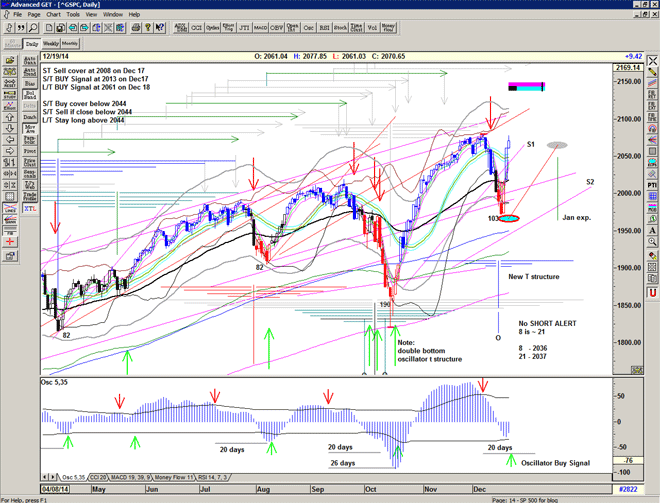
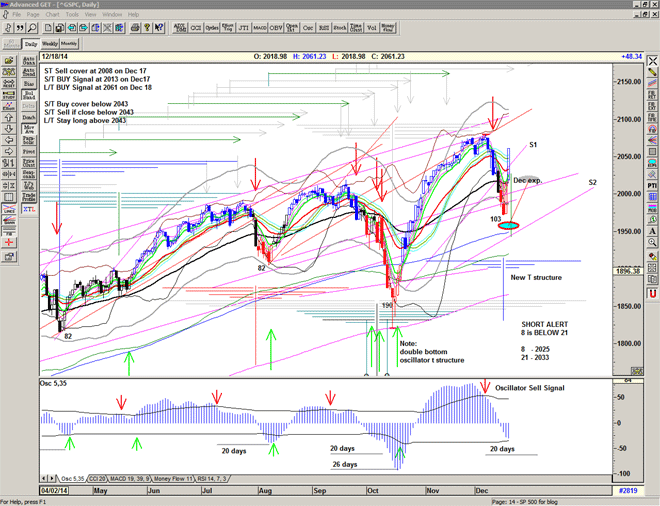
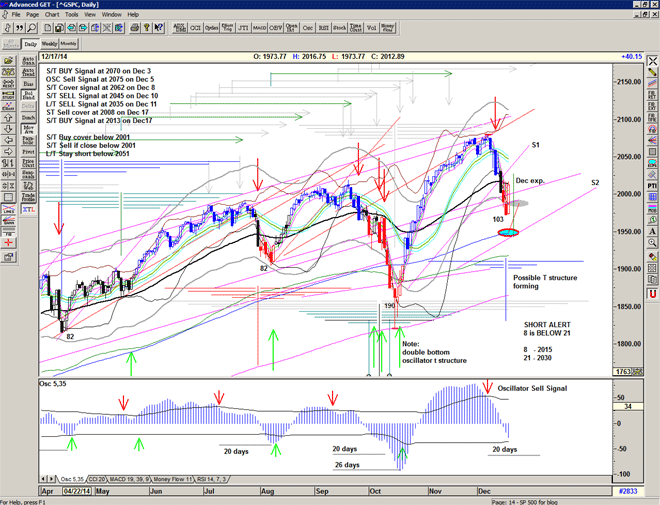
Cover S/T short position
Cover S/T short position at 2008, and standing buy to go long S/T if we go close above 2008
oilskids
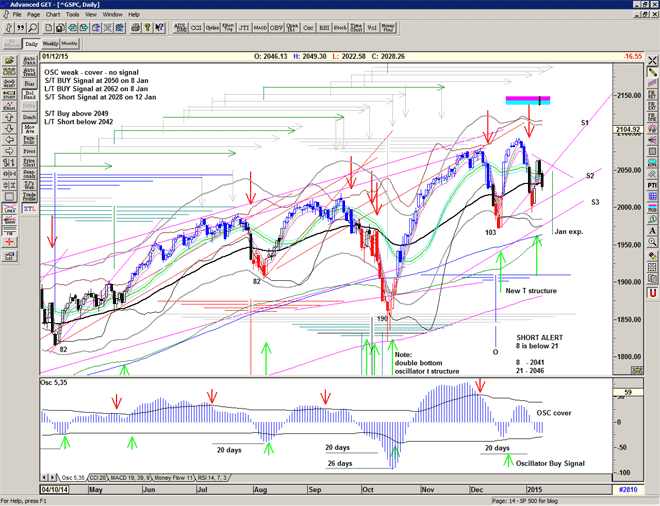
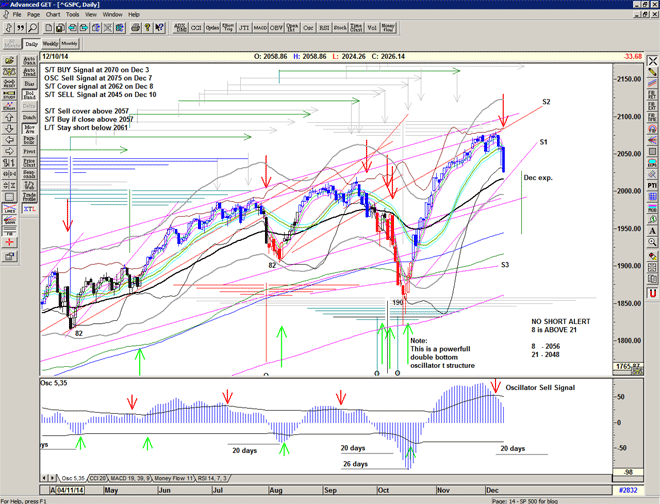
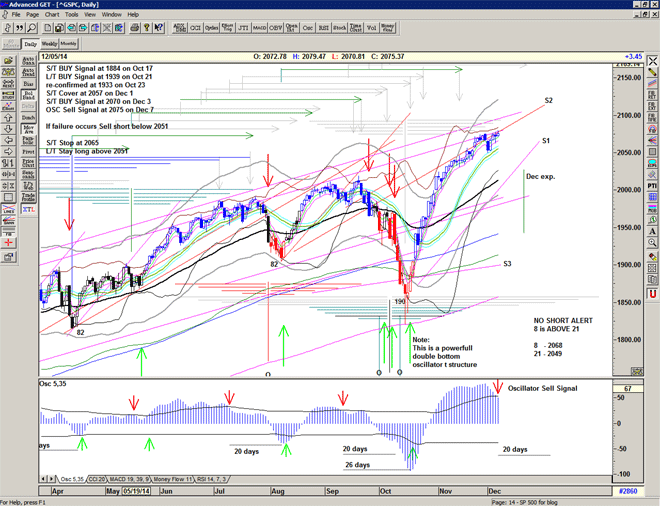
With yesterday's failure to follow through the midpoint an S/T Sell signal is generated below 2052 and so entry at 2045. (allowing 5/6 points for a bounce).
With a close below the mid-point the L/T long signal covers and will go short tomorrow at the close unless we rally back above the mid-point.
First line of support is S1.
Although the 8/21 short alert confirmation is not yet in place, it seems likely to happen today or tomorrow but keep an eye on this for confirmation of a short signal.
L/T Buy Signal cancelled
Failure at the 55EMA and dropping back below the mid-point is potentially a L/T Sell signal. Unconfirmed due to the current S/T Buy Signal. It may just be that the market got over-heated. Note RSI 2 had got above 96 on tuesday. With the current volatility it is too close to call, particularly as 1929 was breached only in the last half hour of the day.
Futures are very positive (+13), so it looks like yesterday afternoon's negativity was unfounded.
L/T BUY SIGNAL at 1939
And another very strong day bringing us back up above the mid-point and providing the Long Term Buy Signal.
Note: the recent correction bounced hard at the 350 ema and that Terry laundry described this as the 'optimum moving average' for the S&P500 – a fantastic buying location for a bounce, a failure there would have significant repercussions (eg August 2008)
Sell Short Signal (again) at 1952
OK, so you get a Buy Signal on monday – you sell.
You get a sell signal on tuesday – you buy.
You get a buy signal on wednesday – you sell.
Notice the magnitude is getting larger – remember the megaphone comments on Sept 23 at 1983.
Notice that the one day rallies are sold into
This must be a bear market cause everyone is getting taken out and beaten up.
This might be expected if we were below the 200 day ma (1904) but we aren't yet.
This leads me to suspect that this may be the tip of a much greater decline, perhaps a manic selloff into late October to re-charge the Bull, perhaps something worse. We have been warned.
Buy Signal at 1960
A nice relief rally and close above the Buy Signal level of 1960.
Lots of potential resistance above – 55 Ema at 1971 and midpoint at 1979,
but the T Theory volume oscillator looks great.
Assuming that we can get through the resistance and close above 1983, then we have the potential for new highs.
It looks like we have a cluster of highs scheduled for oct 14 and 17 – into expiration.