sell warning?

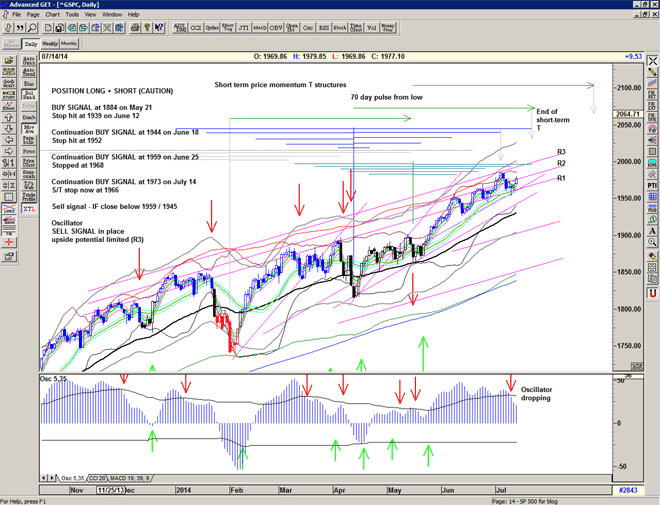
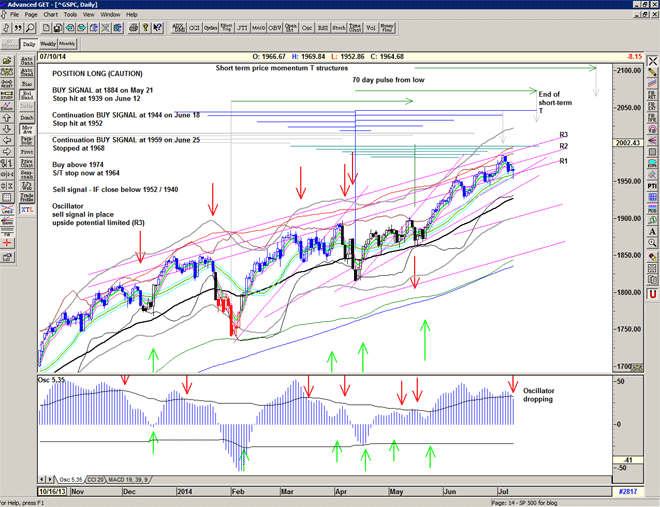
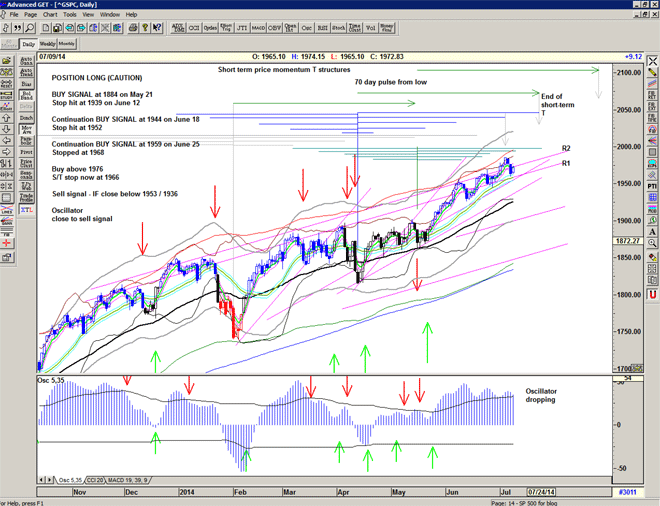
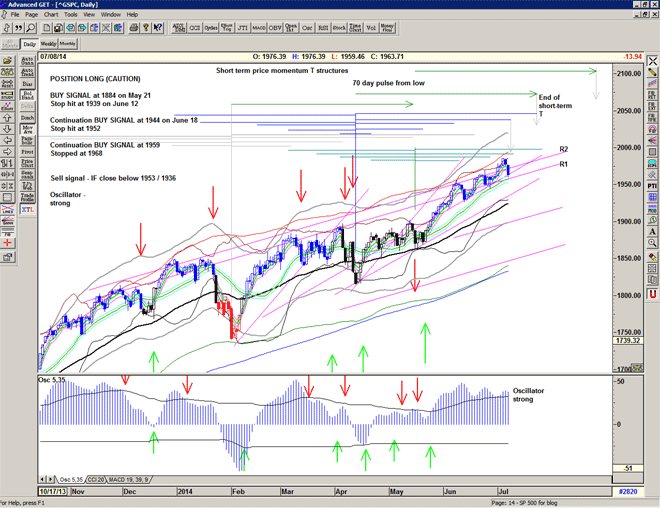
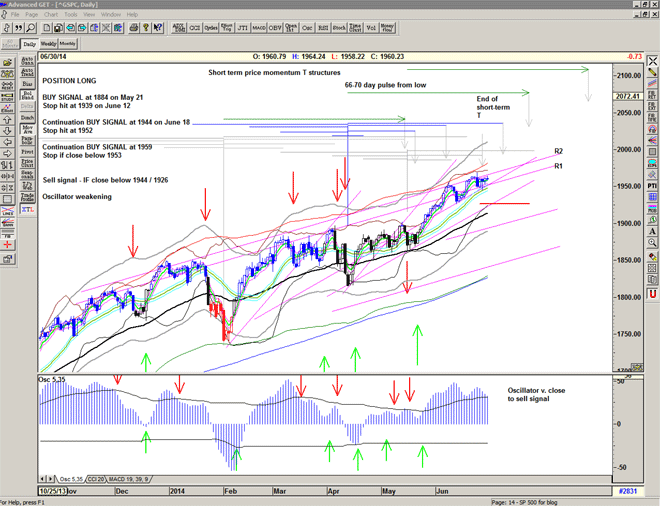
Indecision (Doji day) and oscillator v close to a sell signal. It should fire today unless we get a 15 point move upwards. (Initially this should be treated as a hedge signal rather than a sell signal)
The oscilalltor sell signal suggest a weakening of the market, perhaps a consolidation at the highs, and maybe a impending pullback (requires confirmation by price dropping below the mid-line).

The market is still bullish, and should be treated as such until proven otherwise. If we get the signal today I will sell credit spreads in the 1980-2000 range – as I'm still expecting to see a grind upwards but continued resistance at R2.

Chart of S&P500 for 01 July 2014

grind away

A continuation Buy Signal at 1959.

It looks like the selling dried up immediately and the market bought the bad news.
Does R1 now become support. Will we break up through the R2 angle?

I think we grind on upwards, in a saw-tooth manner, keeping the bears growling and the bulls scared.

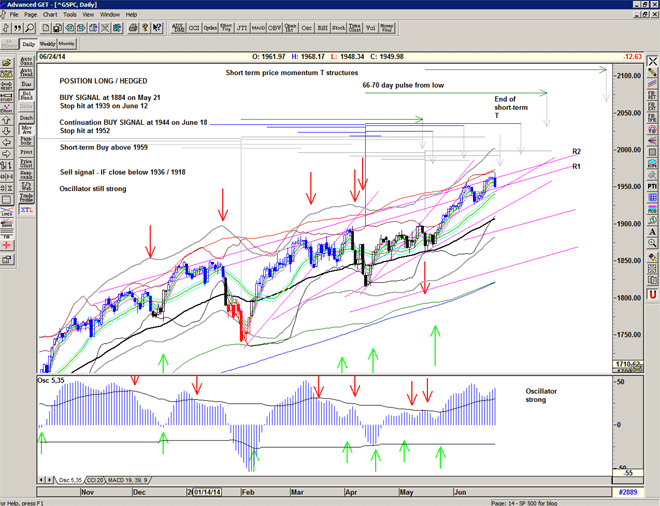
Chart of S&P500 for 26 June 2014

Buy stop hit at 1952

OK so the doji yesterday led to to a spike and sell off, and maybe the end of larger grey T did come in a bit late.

I am still bullish here due to the levels of rising support lines below, in particular at 1944 today, but a distinct close below 1935 would change that picture at least short-term. Also keep an eye on the oscillator which may now start dropping.

Resistance lines R1 and R2 do seem to be in operation (I had started to beleive the melt up was going to clear that). Looks like an epic struggle, above which we get a humongous Buy signal.

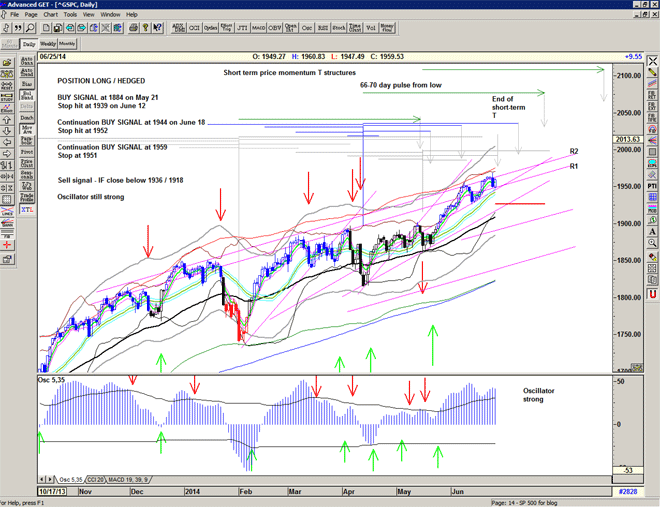
Chart of S&P500 for 25 June 2014

continuation buy signal at 1944

Yes, the FOMC massages and up we go again. Renewing the short-term long position at 1944, and back at the R2 line again.

We are at the end of the larger grey T structure, so perhaps we see some weakness again. Perhaps some sideways digestion, perhaps a grind on up to 2000+.

Keep an eye on the rising lines and oscillator for a reversal signal.

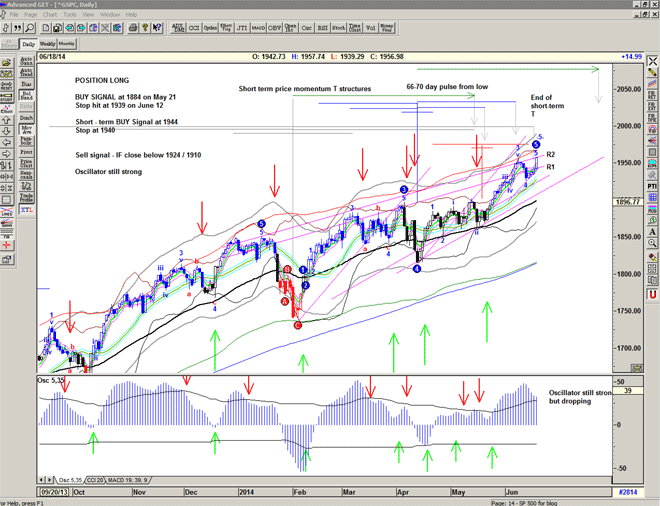
Chart of S&P500 for 19 June 2014

more highs ahead?

I have re-drawn the price momentum T structures using Terry Laundry's Volume oscillator rather than simply using price spikes and I beleive that these are now more accurately describing the market's momentum.

If correct it suggests that the larger long-range T centred at February 4th is more dominant and is pointing to another potential high around June 16th and IF the small red T works out then it too is pointing to June 13th.

The small red T needs to see a break higher above Friday's close at 1900 and therefore suggests that unless we see a break lower tomorrow, we could expect a move up into the R1, R2 area mid June.

Assuming we take out 1902, the previously unconfirmed Buy Signal is now confirmed.

Chart of S&P500 for May 27, 2014

fudge the fed

Closed out the May Condor position for a gain of 7.5%, and added a Short position for June at 1920.

The weakening oscillator adds to my suspicions that a down move is coming soon and that the perceived risk is to the downside. Sell in May and then Buy it back again.

Chart of S&P500 for 9 May 2014