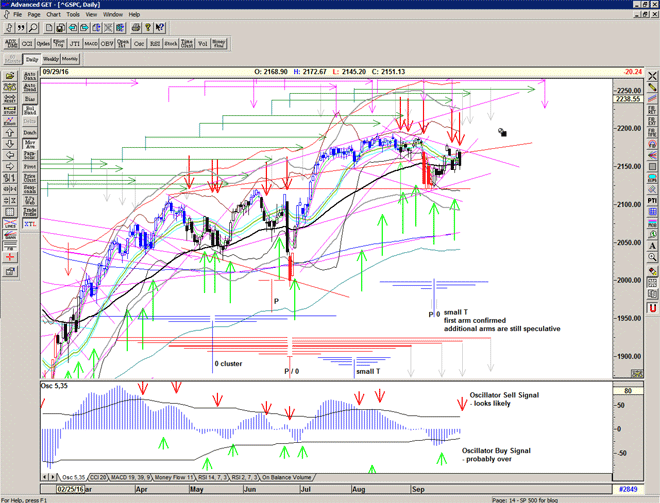
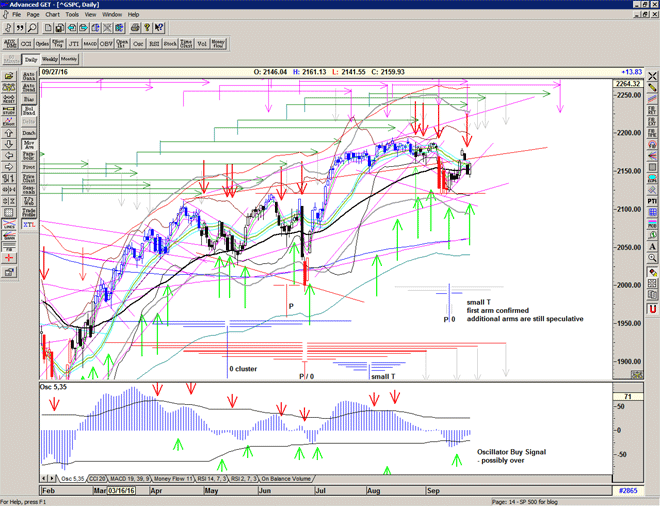
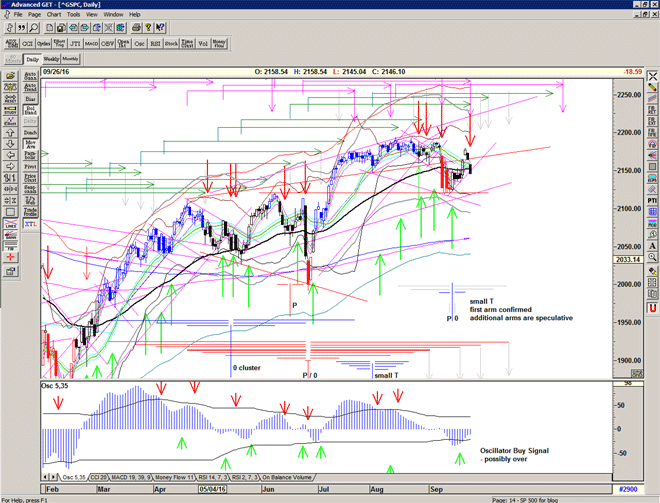
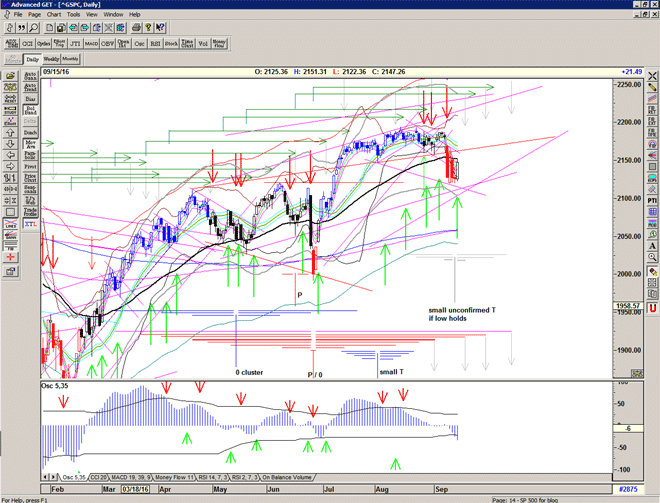
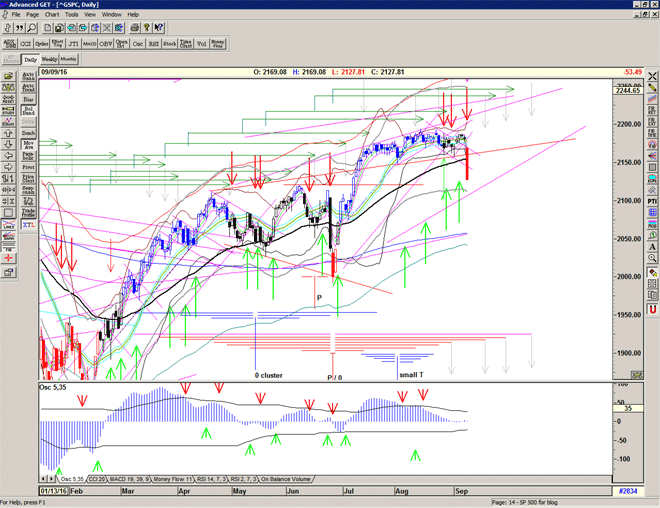
S/T Sell Signal at 2160

With the gap-down below 2170 we have a Short-term Sell Signal initiated at an important cycle high.

We finally received the catalyst for the squeeze that's been building, cancelling out the previous weak bullish signal and cancelling out the potential small T structures discussed.

We are now looking for a new major low to form the next large T structure.

Initial support could be on the important pink rising Gann line at about 2109 on monday.

Chart for 12 September 2016

For more detailed analysis, please Sign up for Alerts & Observations

Disclaimer: This is the diary of a personal trading system, its methodology and the signals that it is producing. You are welcome to follow along but please understand that the information presented here is for educational & entertainment purposes only. No recommendations are being made to buy, or sell stocks, options or futures contracts. Please consult your own financial advisor before making any investment decisions.


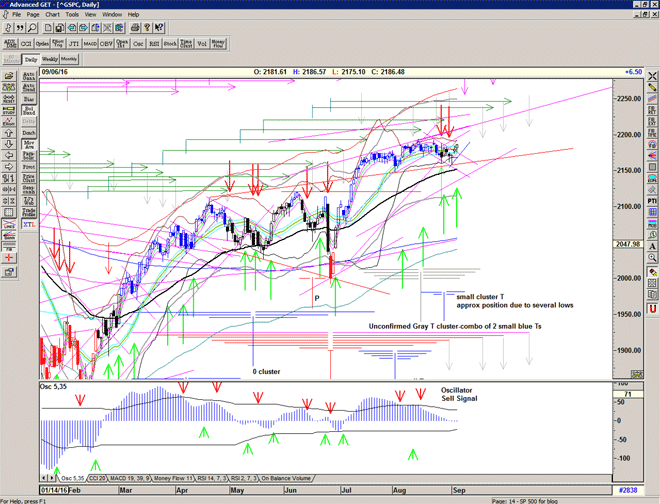
Short term Buy Signal at 2184

Price makes a short-term S/T Buy Signal at 2184, but upside seems relatively restricted.

Market seems to have shaken off that descending channel and the T volume oscillator turns positive confirming the prescence of the small cluster T.

The similar lows of the August 2 low and recent series of lows makes the unconfirmed possibility of a combination of the the 2 blue T structures, marked gray projecting highs for September 20.

Chart of S&P500 for 7 September 2016

For more detailed analysis, please Sign up for Alerts & Observations

Disclaimer: This is the diary of a personal trading system, its methodology and the signals that it is producing. You are welcome to follow along but please understand that the information presented here is for educational & entertainment purposes only. No recommendations are being made to buy, or sell stocks, options or futures contracts. Please consult your own financial advisor before making any investment decisions.


labor of love

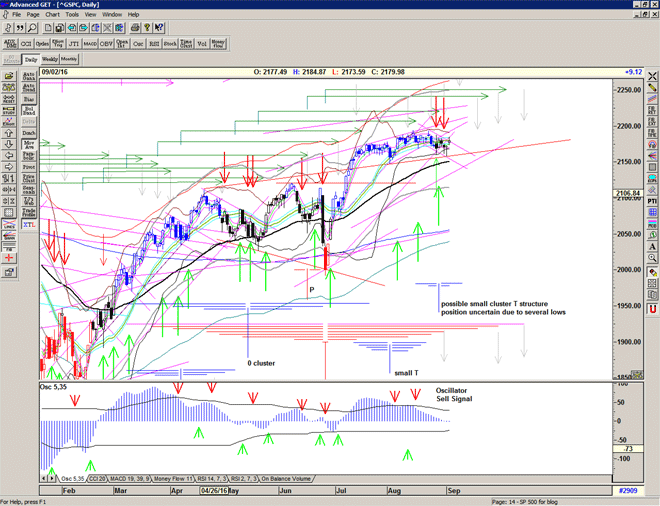
Pop and drop but didn't fail on the day.

Covered Short position at 2182, and potentially back on a Buy Signal with the recovery into the close above 2178.
Just wanted to see a bit more above the descending channel to confirm.

Not completely convincing due to underkiss of rising Gann line at 2084, but a possible small cluster T structure pointing to cycle high on the 8-9 September.

Chart of S&P500 for 05 September 2016

For more detailed analysis, please Sign up for Alerts & Observations

Disclaimer: This is the diary of a personal trading system, its methodology and the signals that it is producing. You are welcome to follow along but please understand that the information presented here is for educational & entertainment purposes only. No recommendations are being made to buy, or sell stocks, options or futures contracts. Please consult your own financial advisor before making any investment decisions.


Short into September

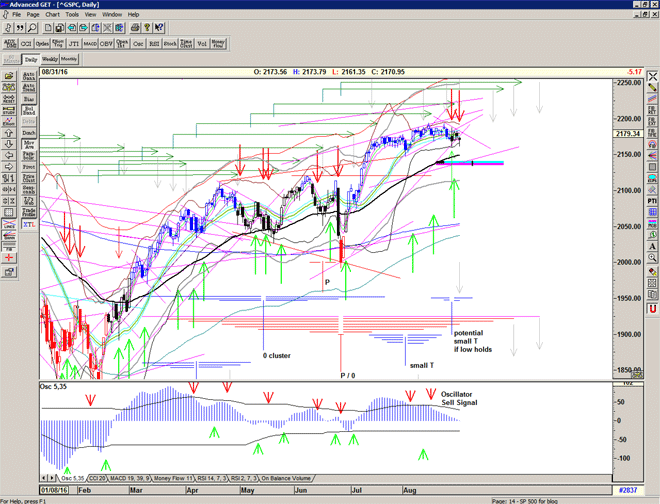
Yesterday's action produced a cover and short Signal at 2165, as it broke down through the important rising Gann line from the June 27 low. This line will probably become a resistance line for future moves up.

The lower bollinger held the day, and we saw a sort of recovery trying to cling onto the 2171 level.

Starting to build a downward sloping resistance line above the recent highs, so a break above those will change the picture somewhat.

Chart of S&P500 for 1 September 2016

For more detailed analysis, please Sign up for Alerts & Observations

Disclaimer: This is the diary of a personal trading system, its methodology and the signals that it is producing. You are welcome to follow along but please understand that the information presented here is for educational & entertainment purposes only. No recommendations are being made to buy, or sell stocks, options or futures contracts. Please consult your own financial advisor before making any investment decisions.


S/T Buy at 2180

A short-term Buy Signal cancelling out Friday's Sell Signal and the T volume oscillator appears to have made a higher low and set up the possibility of a small T – if price holds up above the recent low at 2160.

Chart of S&P500 for 30 August 2016

For more detailed analysis, please Sign up for Alerts & Observations

Disclaimer: This is the diary of a personal trading system, its methodology and the signals that it is producing. You are welcome to follow along but please understand that the information presented here is for educational & entertainment purposes only. No recommendations are being made to buy, or sell stocks, options or futures contracts. Please consult your own financial advisor before making any investment decisions.


Down the rabbit hole, and back again?

A Buy Signal at 2184, and cancelled out with the drop below 2175.

A Sell Signal at 2165, but found support at the bollinger 2160 yesterday.

Trying to cling onto support… more volatilty ahead…

Chart of S&P500 for 29 August 2016

For more detailed analysis, please Sign up for Alerts & Observations

Disclaimer: This is the diary of a personal trading system, its methodology and the signals that it is producing. You are welcome to follow along but please understand that the information presented here is for educational & entertainment purposes only. No recommendations are being made to buy, or sell stocks, options or futures contracts. Please consult your own financial advisor before making any investment decisions.


Cover at 2175

Cover Signal at 2075 with the failure of the rising wedge and the break down through 2078.
Looks like the market is ready to rollover with perhaps one last try at the high.

Strong initial rising support just below at about 2167 today…

Chart of S&P500 for 25 August 2016

For more detailed analysis, please Sign up for Alerts & Observations

Disclaimer: This is the diary of a personal trading system, its methodology and the signals that it is producing. You are welcome to follow along but please understand that the information presented here is for educational & entertainment purposes only. No recommendations are being made to buy, or sell stocks, options or futures contracts. Please consult your own financial advisor before making any investment decisions.


Buy Signal at 2172

Squeeze resulted in a Buy Signal being generated in the opening above 2170 and the market never looked back, pushing the market back up to resistance line, upper bollinger and new all time highs.
Magic T oscillator back at zero and looking like the small blue T structure is now activated projecting highs this week and next.

Chart of S&P500 for 8 August 2016

For more detailed analysis, please Sign up for Alerts & Observations

Disclaimer: This is the diary of a personal trading system, its methodology and the signals that it is producing. You are welcome to follow along but please understand that the information presented here is for educational & entertainment purposes only. No recommendations are being made to buy, or sell stocks, options or futures contracts. Please consult your own financial advisor before making any investment decisions.


Waiting for the Next Signal

Covered at 2155 yesterday morning, and very nearly triggered a Sell Signal.

Notice that initial support was found at the rising Gann lines and mid-channel as expected.

Maybe a bounce here, but stronger support lies below…

Chart of S&P500 for 3 August 2016

For more detailed analysis, please Sign up for Alerts & Observations

Disclaimer: This is the diary of a personal trading system, its methodology and the signals that it is producing. You are welcome to follow along but please understand that the information presented here is for educational & entertainment purposes only. No recommendations are being made to buy, or sell stocks, options or futures contracts. Please consult your own financial advisor before making any investment decisions.


Back above the 55

Sustained trade above the 2055 level as the shorts are forced to cover their positions.

It will be interesting to see what happens as we approach 2088 and try to stabilise at price levels prior to the recent shockwave shakeout.

For now the market is back on a BUY, but I wouldn't be at all surprised to see another move back down to test the recent low.

Chart of S&P500  for 30 June 2016

For more detailed analysis, please Sign up for Alerts & Observations

Disclaimer: This is the diary of a personal trading system, its methodology and the signals that it is producing. You are welcome to follow along but please understand that the information presented here is for entertainment purposes only. No recommendations are being made to buy, or sell stocks, options or futures contracts. Please consult your own financial advisor before making any investment decisions.