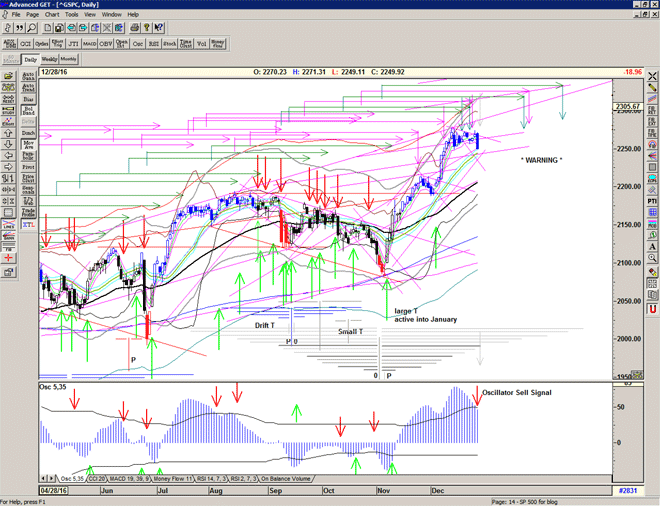
Cover at 2258

Cover Signal at 2258 as a lack of buyers at 2270 coincides with the decline in momentum and reinforced by OSC oscillator Sell Signal.

S/T Sell signal not yet triggered and we have strong rising support lines but according to the T structure this is the downdraft from the September 12 bounce and another arm of the T structure expires tomorrow suggesting that we may suffer a lack of buying power into New Year whilst the market stabilises.

Chart of S&P 500 for 29 December 2016

To receive further analysis, more clarity and the updated daily Buy / Sell levels being generated by the system before the market opens, please Sign up for Alerts & Observations

Disclaimer: This is the diary of a personal trading system, its methodology and the signals that it is producing. You are welcome to follow along but please understand that the information presented here is for educational & entertainment purposes only. No recommendations are being made to buy, or sell stocks, options or futures contracts. Please consult your own financial advisor before making any investment decisions.

 

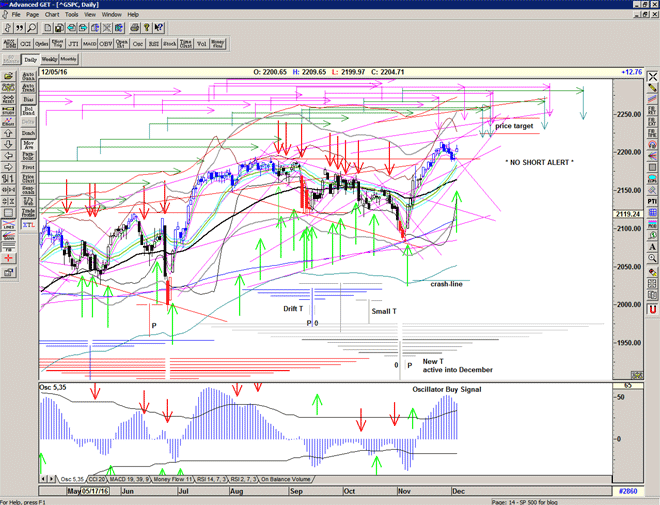
Continuation Buy Signal at 2202

Market popped up above the Buy Signal line triggering an S/T continuation signal with the bounce from the breakout line.

Chart of S&P500 for 06 December 2016

To receive further analysis, more clarity and the updated daily Buy / Sell levels being generated by the system before the market opens, please Sign up for Alerts & Observations

Disclaimer: This is the diary of a personal trading system, its methodology and the signals that it is producing. You are welcome to follow along but please understand that the information presented here is for educational & entertainment purposes only. No recommendations are being made to buy, or sell stocks, options or futures contracts. Please consult your own financial advisor before making any investment decisions.

Trump Tower

On Election day the market noses into the resistance line at 2144, and stops to wait for the result.

We had a short term cycle/pulse high scheduled for 8-9 November which suggested that the market might sell the news at least temporarily.

Oops, futures down very hard on the news of Donald Trump's successful night, triggering a SELL Signal, but have recovered significantly showing that the market was well protected. Initially E-minis bounced at 2028 which corresponds to about 2032 on the S&P500 index – the lower extreme boundary – fine green line on my charts. Keep an eye on that level for future reference as it is now major support and the market may need to go have a look-see at some point.

Watch to see if the previous low at 2083 holds, or not, as the market digests the news and traders re-position. Very large open option positions at 2050 and 2000 may be initial magnets and strong support but the unloading of these positions could also be the tail-wind for a strong recovery. (ie Sell the News and Buy the recovery)

Chart of S&P500 for 09 November 2016

To receive further analysis and updated daily Buy / Sell levels being generated by the system before the market opens, please Sign up for Alerts & Observations

Disclaimer: This is the diary of a personal trading system, its methodology and the signals that it is producing. You are welcome to follow along but please understand that the information presented here is for educational & entertainment purposes only. No recommendations are being made to buy, or sell stocks, options or futures contracts. Please consult your own financial advisor before making any investment decisions.


S/T BUY Signal at the open

Sometimes the market bounces and fails and then the real bounce starts the next day, with avengeance.

The market roars its approval of Hillary and breezes through resistance and up into the mid-channel area.

A new small T is activated, and we can see that if this breaks through the downward sloping resistance, we have the possibility for a larger T structure and a rally into Christmas and the New Year.

Its just politics, stupid

Cat’s paw

Nice bounce at horizontal support.
Covered at 2128, and speculative buying only above 2130.
Short signal still in place after breakdown through important rising lines but perhaps there is more in this bounce first, strong resistance at 2140 now.

Chart of S&P500 for 14 October 2016

For more detailed analysis, please Sign up for Alerts & Observations

Disclaimer: This is the diary of a personal trading system, its methodology and the signals that it is producing. You are welcome to follow along but please understand that the information presented here is for educational & entertainment purposes only. No recommendations are being made to buy, or sell stocks, options or futures contracts. Please consult your own financial advisor before making any investment decisions.