The Common Raven

And the silken sad uncertain rustling of each purple curtain
Thrilled me – filled me with fantastic terrors never felt before;
So that now, to still the beating of my heart, I stood repeating,
Tis some visitor entreating entrance at my chamber door –
Some late visitor entreating entrance at my chamber door; –
This it is, and nothing more.

– Edgar Allan Poe, The Raven

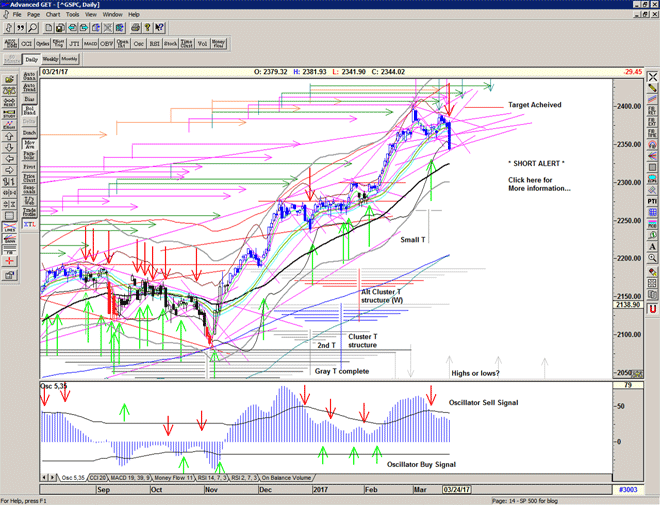
BUY Signal covered at 2370, and an S/T SELL Signal at 2363:

The market pops out at the open and challenges the downward descending trend.
Nope, this common raven is selling and taking the market way down.

Admittedly we have had some warnings, pressure upon the recent Buy Signal and the recent selling into strength, as well as the historically high Skew reading.

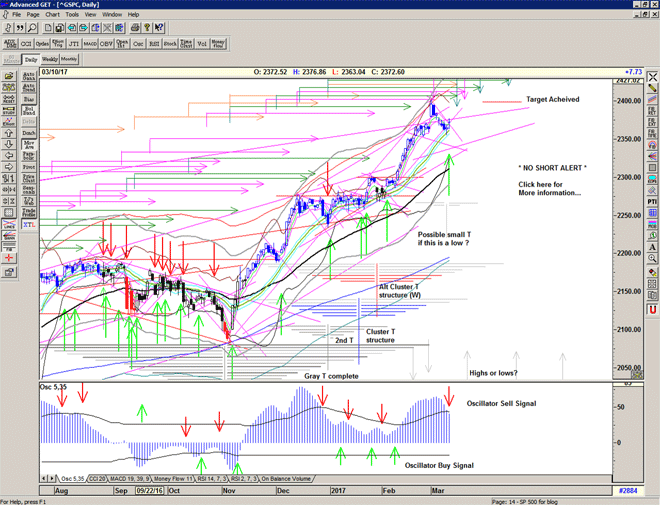
Failure of the small T of 9 March now shows us that there is another new T structure under construction.
Keep an eye on the T volume oscillator for any signs of recovery.

And so now we are on alert for a new climax low to occur and set up the next major T structure…

Chart of S&P 500 for 21 March 2017

Be prepared for whatever comes next:

To receive detailed daily analysis, guidance and the updated daily Buy / Sell trigger levels being generated by the Trading the Line system before the market opens, and intraday alerts when appropriate, become a Member and Sign up for Alerts & Observations – includes access to Members Area and the Explanatory Notes for all of the concepts discussed.

Disclaimer: This is the diary of a personal trading system, its methodology and the signals that it is producing. You are welcome to follow along but please understand that the information presented here is for educational purposes only. No recommendations are being made to buy, or sell stocks, options or futures contracts. Please consult your own financial advisor before making any investment decisions.


S/T Buy Signal at 2375, but…

An S/T BUY Signal triggered in early trade at 2375, but weakened by the pop and drop at the descending resistance line, followed by a Buy it back push into the close. Also characteristic chopshop behaviour that seems to occur when the market is within the mid-channel area.

A clean exit from the short term descending trend would have been more favorable to the buy signal, and the T volume oscillator requires further follow through to establish the new small possible T structure.

Chart of S&P 500 for 13 March 2017

Be prepared: To receive detailed daily analysis, guidance and the updated daily Buy / Sell trigger levels being generated by the system before the market opens, and intraday alerts when appropriate, please become a Member and Sign up for Alerts & Observations – includes access to Members Area and the Explanatory Notes which explain how this system works.

Disclaimer: This is the diary of a personal trading system, its methodology and the signals that it is producing. You are welcome to follow along but please understand that the information presented here is for educational purposes only. No recommendations are being made to buy, or sell stocks, options or futures contracts. Please consult your own financial advisor before making any investment decisions.


Way to go

S/T Buy Signal re-confirmed with move out of the chopshop and congestion of the past few days, and the rise in the T volume oscillator confirms the possibility of a small T with potential into the end of the month.

The conflict of course is the arm of the larger T structure that expired yesterday, and a cluster of scheduled highs today into Friday, and so it remains to be seen whether this has a major or minor effect – a turnaround or a choppy grind higher.

Chart of S&P 500 for 25 January 2017

Be prepared: To receive detailed daily analysis, more clarity and explanations, larger images and the updated daily Buy / Sell trigger levels being generated by the system before the market opens, and intraday alerts when appropriate, please become a Member and Sign up for Alerts & Observations – includes access to Members Area and Explanatory Notes.

Disclaimer: This is the diary of a personal trading system, its methodology and the signals that it is producing. You are welcome to follow along but please understand that the information presented here is for educational purposes only. No recommendations are being made to buy, or sell stocks, options or futures contracts. Please consult your own financial advisor before making any investment decisions.

Weak Buy Signal

Buy Signal triggered in early trade at 2274, but quickly under threat from descending resistance.
Held above important support but triangulating now, outsized move coming up soon.

There is the possibilty of some follow through into several scheduled peaks early next week, but it does seem likely that there is a significant correction coming soon.

SKEW remains elevated indicating the prescence of fear and possibility of an unexpected event, a black swan.
I suspect that this is related to comments regarding the strength of the dollar.
Keep an eye on this – it is flashing a big red warning.

Chart of S&P 500 for 23 January 2017


Be prepared: To receive detailed daily analysis, more clarity and explanations, larger images and the updated daily Buy / Sell trigger levels being generated by the system before the market opens, and intraday alerts when appropriate, please become a Member and Sign up for Alerts & Observations – includes access to Members Area and Explanatory Notes.

Disclaimer: This is the diary of a personal trading system, its methodology and the signals that it is producing. You are welcome to follow along but please understand that the information presented here is for educational purposes only. No recommendations are being made to buy, or sell stocks, options or futures contracts. Please consult your own financial advisor before making any investment decisions.


Cover Signal at 2263

Another probe into the shortside.

After the bounce off 2259, the market is looking like maybe it will recover above the buy cover signal line of 2265 again.

Echoes of late August again.

If we hold onto 2265 into the close the Buy Signal is still active, if not we cover the long signal.

Cover at the close of 2263

Fireworks for the New Year

Sent to my readers prior to the open:

And a very warm welcome to 2017

As mentioned, the first test would be last week's pullback to the rising Gann line at 2135 and as we can see the Futures are indicating a strong open and a successful test.

Very Short Term bullish above 2244, and an S/T Buy Signal is confirmed above 2256.

Ideally we also would like to see the T volume oscillator move above zero to activate a small T with strength into MLK.

And so an S/T Buy Signal at the open at 2256.
Market fizzled but held onto the Buy Signal (and above the Sell signal level) into the close