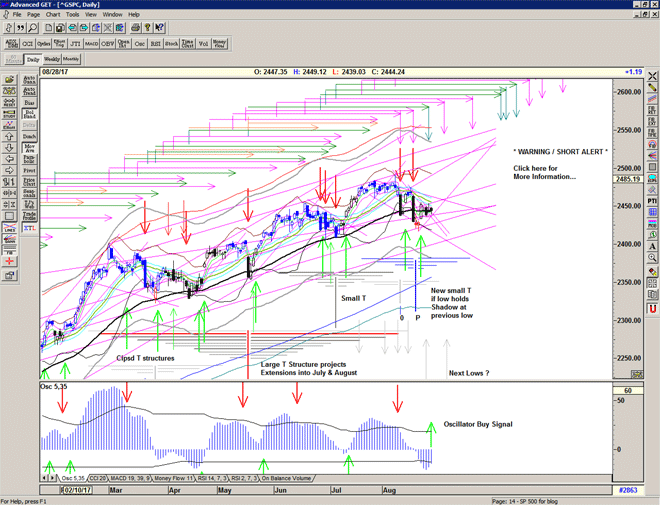
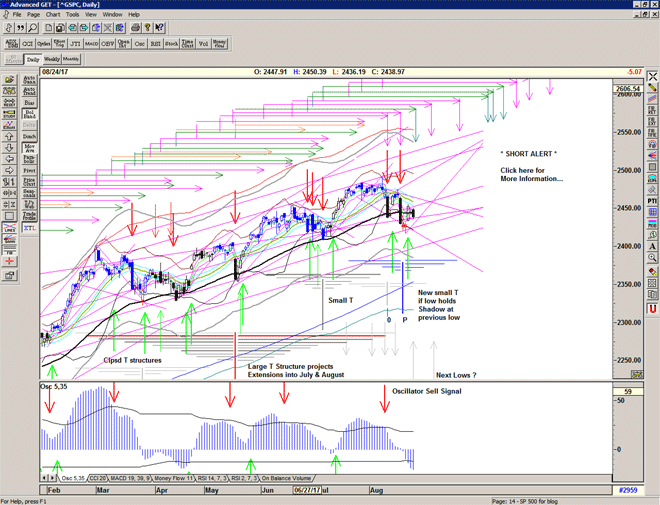
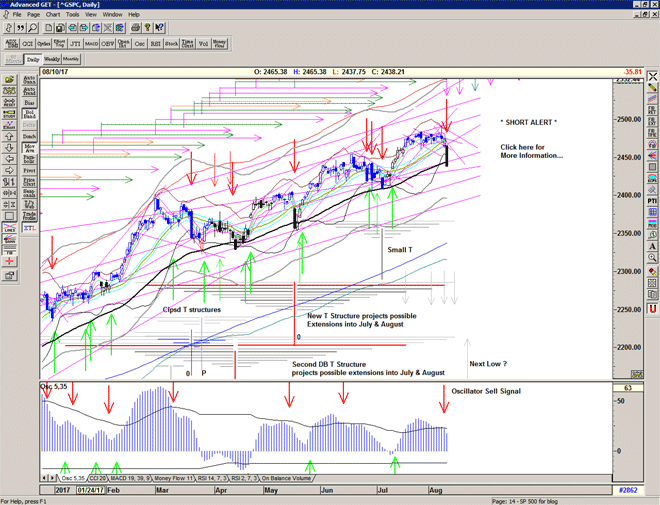
A decisive breakdown at the echo high and penultimate arm of the most recent Large T structures suggests that these structures are now complete and we should look for a new low to form a new T structure, as the market retreats from the recent all time high.
Interestingly, this breakdown also violates the long-standing rising support line from the Election low as well as the important 55 ema, suggesting that the whole Trump rally is now complete and that we may need to see some sideways and downwards corrective action, perhaps into the Fall, before the bull resumes its search for higher prices.
Of course an oversold bounce is still quite likely, and several indicators are at readings associated with short term lows.
Watch the T volume oscillator for signs of bullish divergence with price for hints of a recovery in the days or weeks to come.
Be prepared for whatever comes next:
To receive detailed daily analysis, guidance and the updated daily Buy / Sell trigger levels being generated by the Trading the Line system before the market opens, and intraday alerts when appropriate, please become a Member and Sign up for Alerts & Observations – includes access to Members Area and the Explanatory Notes for all of the concepts discussed.
Disclaimer: This is the diary of a personal trading system, its methodology and the signals that it is producing. You are welcome to follow along but please understand that the information presented here is for educational purposes only. No recommendations are being made to buy, or sell stocks, options or futures contracts. Please consult your own financial advisor before making any investment decisions.

 No Comments