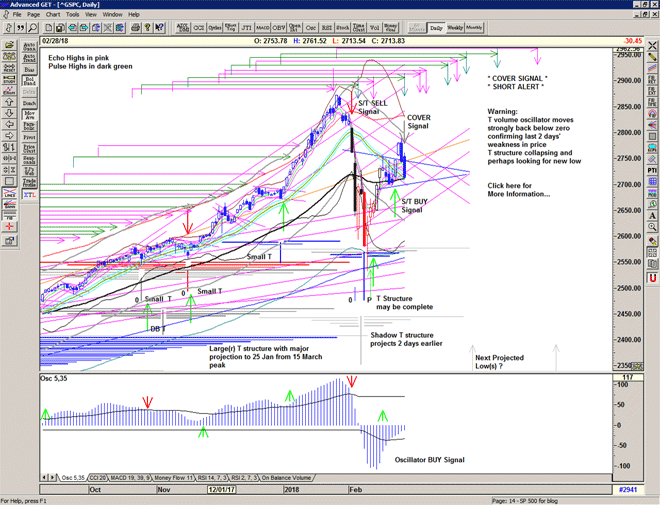
COVER Signal at 2734

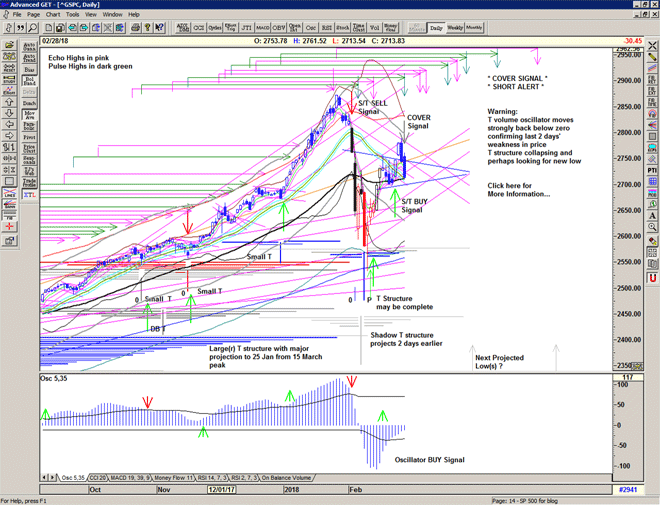
Some initial buying interest but this morning the market was still selling into 'strength'.

An afternoon attempt at 2759 is sold into and we are quickly down towards 2735.

Relentless selling this afternoon with barely a bounce at 2730 and heading towards the previous support base around 2700.

Cover Signal at 2734 and confirmed at the close.

Wait for more stabilisation and the next signal.

Tulsa

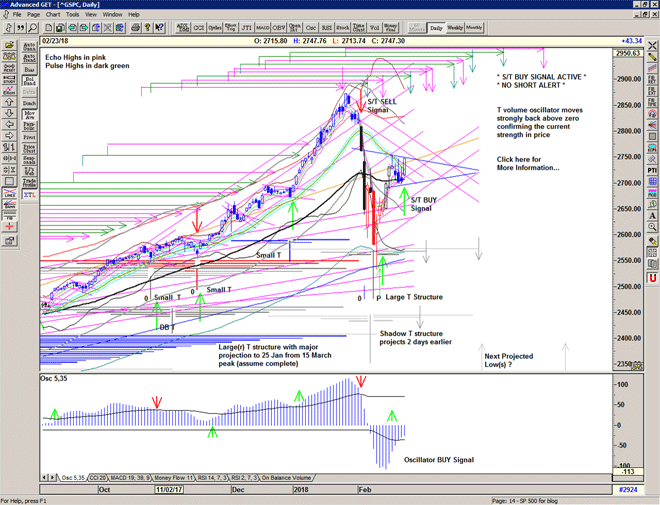
S/T Buy Signal at 2717

The market gaps up above the Buy Signal level at 2712, pulls back to find support and then heads higher.

A strong gap up and go and close at the highs type day, with just that a little bit of hesitation midday to remind us of the previous days' afternoon selling.

Strength above the Mid-Channel is a very positive development, and the T volume oscillator moves back above zero supporting the continued projections for highs in March.

Chart of S&P 500 for 24 February 2018

Be prepared for whatever is coming next, and trade with confidence:

To receive detailed daily analysis, guidance and the updated daily Buy / Sell trigger levels being generated by the Trading the Line system before the market opens, and intraday alerts when appropriate, please become a Member and Sign up for Alerts & Observations – includes access to Members Area and the Explanatory Notes for all of the concepts discussed.

Disclaimer: This is the diary of a personal trading system, its methodology and the signals that it is producing. You are welcome to follow along but please understand that the information presented here is for educational purposes only. No recommendations are being made to buy, or sell stocks, options or futures contracts. Please consult your own financial advisor before making any investment decisions.


In the Forest

In the forest lives a monster
he has done terrible things
so in the wood it's hiding
And this is the song he sings

Who will love me now
Who will ever love me?
Who will say to me
You are my desire
I'll set you free

(Who will love me now)
Who will forgive and make me live again
Who will bring me back to the world again
(to the world again)

PJ Harvey, Who Will Love Me Now?, 1998

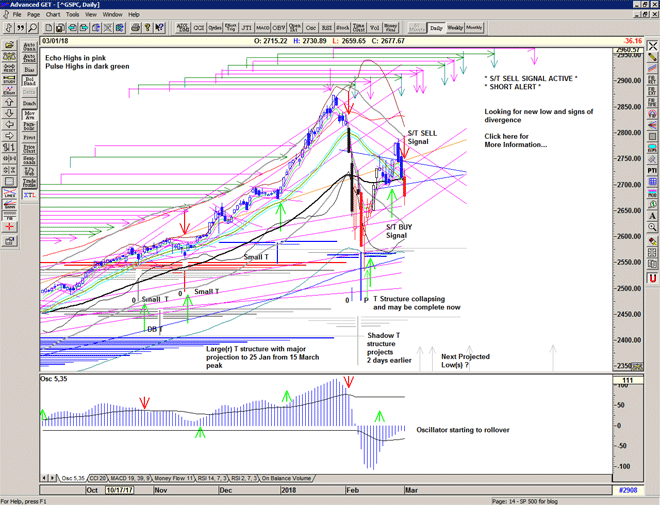
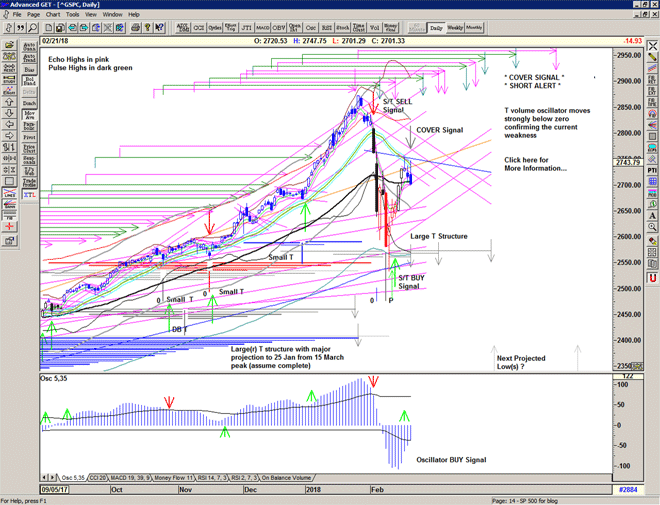
The Market gaps up and heads higher finding support above 2725 into the Fed announcement that adds a burst of adrenalin and a surge into 2747.

Unfortunately the market then reacts violently and the resulting sell off continues into the close and triggers a Cover Signal at 2701. Something is wrong.

The T volume oscillator drops hard below zero and the negative action in price raises a short alert and the possibility of further selling.

Again the market behaves in a a violent and unpredictable manner in-line with the high levels of volatility indicated by the Vix.

Dangerous market conditions continue.

Chart of S&P 500 for 22 February 2018

Be prepared for whatever is coming next, and trade with confidence:

To receive detailed daily analysis, guidance and the updated daily Buy / Sell trigger levels being generated by the Trading the Line system before the market opens, and intraday alerts when appropriate, please become a Member and Sign up for Alerts & Observations – includes access to Members Area and the Explanatory Notes for all of the concepts discussed.

Disclaimer: This is the diary of a personal trading system, its methodology and the signals that it is producing. You are welcome to follow along but please understand that the information presented here is for educational purposes only. No recommendations are being made to buy, or sell stocks, options or futures contracts. Please consult your own financial advisor before making any investment decisions.


Gilgamesh

The epic of Gilgamesh
A pretty little black A-line dress
I give to you
The spinal cord of JFK
Wrapped in Marilyn Monroe's negligee
I give to you
I want nothing in return
Just the softest little breathless word
I ask of you
A word contained in a grain of sand
That can barely walk, can't even stand
I ask of you

C'mon baby, let's get out of the cold
And gimme, gimme, gimme your precious love for me to hold

Grinderman, Palace of Montezuma, 2010
Songwriters: Nick Cave, Warren Ellis, Martyn P. Casey, Jim Sclavunos

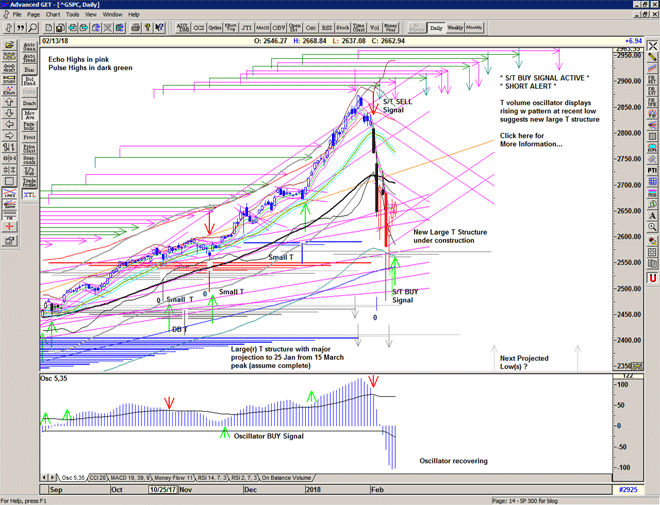
An S/T BUY Signal at 2661 confirmed at the close.

Short Alert still active.

A gap down at the open is gradually shrugged off and the market grinds higher and up into an S/T Buy Signal at 2661.

Caution still required due to the high volatility and recent collapse in price, but the signs are that the market is now improving.
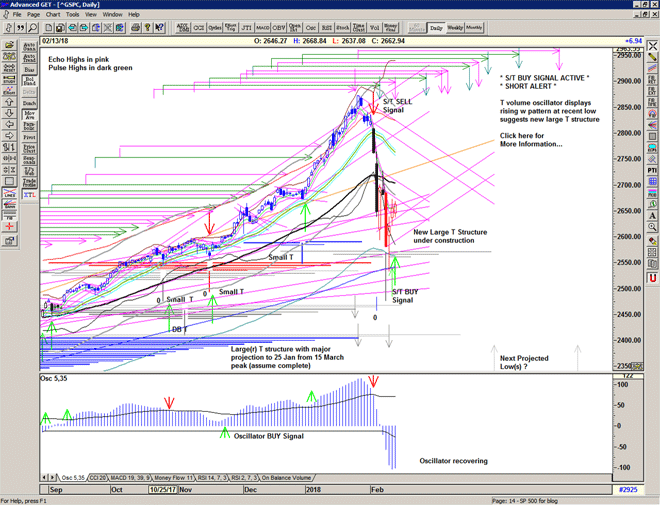
Chart of S&P 500 for 14 February 2018

Be prepared for whatever is coming next, and trade with confidence:

To receive detailed daily analysis, guidance and the updated daily Buy / Sell trigger levels being generated by the Trading the Line system before the market opens, and intraday alerts when appropriate, please become a Member and Sign up for Alerts & Observations – includes access to Members Area and the Explanatory Notes for all of the concepts discussed.

Disclaimer: This is the diary of a personal trading system, its methodology and the signals that it is producing. You are welcome to follow along but please understand that the information presented here is for educational purposes only. No recommendations are being made to buy, or sell stocks, options or futures contracts. Please consult your own financial advisor before making any investment decisions.



Thunder

And she turned around and took me by the hand and said,
I've lost control again.
And how I'll never know just why or understand,
She said I've lost control again.

Joy Division, She's Lost Control, 1979
(Bernard Sumner, Ian Curtis, Peter Hook, Stephen Morris)

A 20 point drop into the Sell Signal area, a slight bounce which fails and then the selling really starts.

An S/T Sell signal at 2794.

An OSC Sell Signal.

T volume oscillator at a very low level already (-89), so we are now looking for a low to occur and a strong bounce at some point but the market will need a significant amount of stabilising first after this shock.

Chart of S&P500 for 03 February 2018

Be prepared for whatever is coming next, and trade with confidence:

To receive detailed daily analysis, guidance and the updated daily Buy / Sell trigger levels being generated by the Trading the Line system before the market opens, and intraday alerts when appropriate, please become a Member and Sign up for Alerts & Observations – includes access to Members Area and the Explanatory Notes for all of the concepts discussed.

Disclaimer: This is the diary of a personal trading system, its methodology and the signals that it is producing. You are welcome to follow along but please understand that the information presented here is for educational purposes only. No recommendations are being made to buy, or sell stocks, options or futures contracts. Please consult your own financial advisor before making any investment decisions.


Marianne

Now so long, Marianne
It's time that we began to laugh
And cry and cry and laugh about it all again

Well, you know that I love to live with you
But you make me forget so very much
I forget to pray for the angels
And then the angels forget to pray for us

Leonard Cohen, So Long, Marianne, 1967

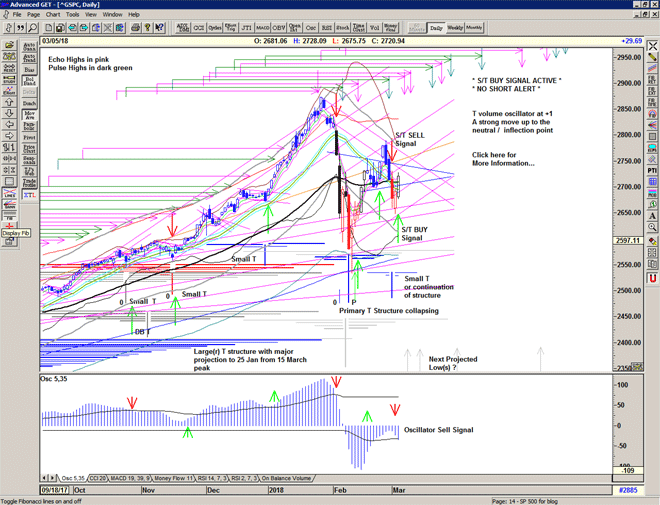
A gap down below the cover signal level without any significant recovery, suggesting that the market needs some further stabilisation.

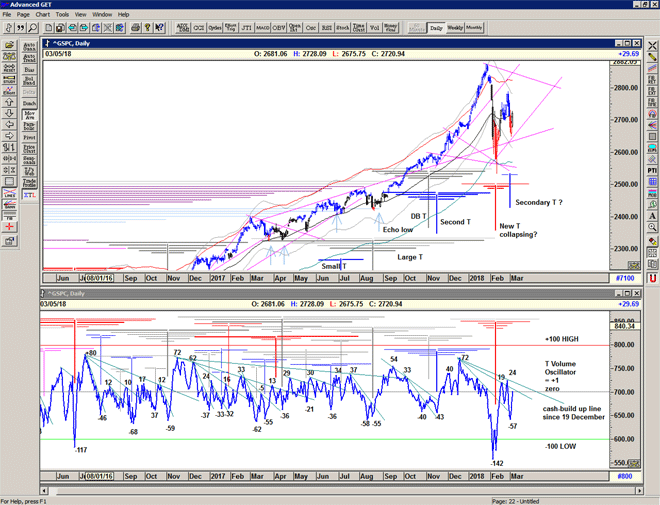
Zooming out you can see that the recent peak synchronised with the projection for a high from the 15 March peak, reinforced by similar projections from the smaller more recent structures.

There is the possibility for another high associated with the earlier peak on 01 March – another attempt at a high perhaps?

We are now looking for some kind of low to occur. The T volume oscillator has been in decline and forming a cash-build up line since the 18 December high and is already at a level associated with lows (-55) though of course it can go much lower. This is the fuel for the next advance. Look for stabilisation in the oscillator and then a move upwards through the cash-build up line to initiate the next T structure.

Chart of S&P 500 for 31 January 2018

Be prepared for whatever is coming next, and trade with confidence:

To receive detailed daily analysis, guidance and the updated daily Buy / Sell trigger levels being generated by the Trading the Line system before the market opens, and intraday alerts when appropriate, please become a Member and Sign up for Alerts & Observations – includes access to Members Area and the Explanatory Notes for all of the concepts discussed.

Disclaimer: This is the diary of a personal trading system, its methodology and the signals that it is producing. You are welcome to follow along but please understand that the information presented here is for educational purposes only. No recommendations are being made to buy, or sell stocks, options or futures contracts. Please consult your own financial advisor before making any investment decisions.


Perihelion

Market opens the year in true style with a gap up and go into a continuation BUY signal at 2686.

The extremely bullish nature of yesterday carries a warning with it as Put/Call ratios drop to a low not seen since December 2016 and suggests some element of panic-buying as well as short-covering.

Today is another pulse high, and so we might expect only a little follow through on the current buy signal, and the Osc oscillator sits just above the Sell signal level still suggesting that we will not see significantly higher prices, yet.

And so, some caution still remains, but with further upcoming projections from the T structures for tomorrow and Monday suggesting that we may also see another peak shortly, and another echo high early next week, perhaps to bring in some selling afterwards. Expect some choppiness and some volatility.

Chart of S&P 500 for 03 January 2018

Be prepared for whatever is coming next, and trade with confidence:

To receive detailed daily analysis, guidance and the updated daily Buy / Sell trigger levels being generated by the Trading the Line system before the market opens, and intraday alerts when appropriate, please become a Member and Sign up for Alerts & Observations – includes access to Members Area and the Explanatory Notes for all of the concepts discussed.

Disclaimer: This is the diary of a personal trading system, its methodology and the signals that it is producing. You are welcome to follow along but please understand that the information presented here is for educational purposes only. No recommendations are being made to buy, or sell stocks, options or futures contracts. Please consult your own financial advisor before making any investment decisions.


Mare Imbrium

A gap up open cancels out the previous Sell Signal and the strength triggers an S/T BUY Signal at 2583.

A visit to 2590 shows some resistance at a declining angle, but this is so close to the previous all time high that it would seem likely that this is temporary.

The rapid turnaround suggests to me that we are now seeing additional strength in the larger T structure and that the projections into late November and December are now active. Yesterday's rise in the T volume oscillator indicating strong breadth supports this thinking.

Yesterday was an echo high (but perhaps a lesser one) and today is a pulse high. There is therefore always the possibility of a rapid move back down due to profit-taking on yesterday's snap back to the high.

Chart of S&P 500 for 17 November 2017


Be prepared for whatever is coming next, and trade with confidence:

To receive detailed daily analysis, guidance and the updated daily Buy / Sell trigger levels being generated by the Trading the Line system before the market opens, and intraday alerts when appropriate, please become a Member and Sign up for Alerts & Observations – includes access to Members Area and the Explanatory Notes for all of the concepts discussed.

Disclaimer: This is the diary of a personal trading system, its methodology and the signals that it is producing. You are welcome to follow along but please understand that the information presented here is for educational purposes only. No recommendations are being made to buy, or sell stocks, options or futures contracts. Please consult your own financial advisor before making any investment decisions.