Cover Signal at 2681

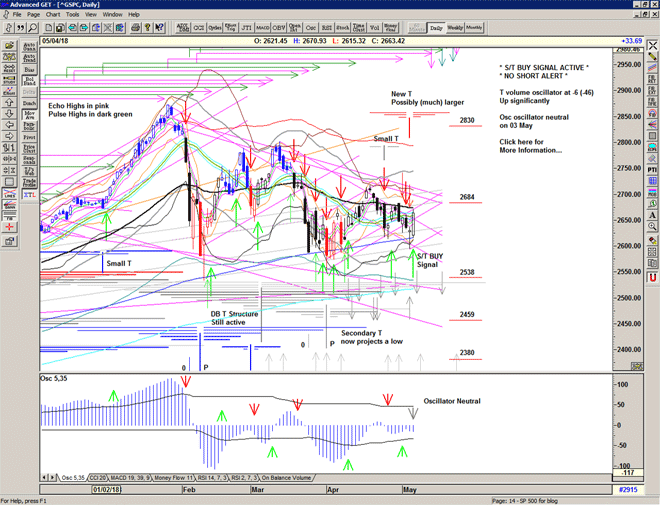
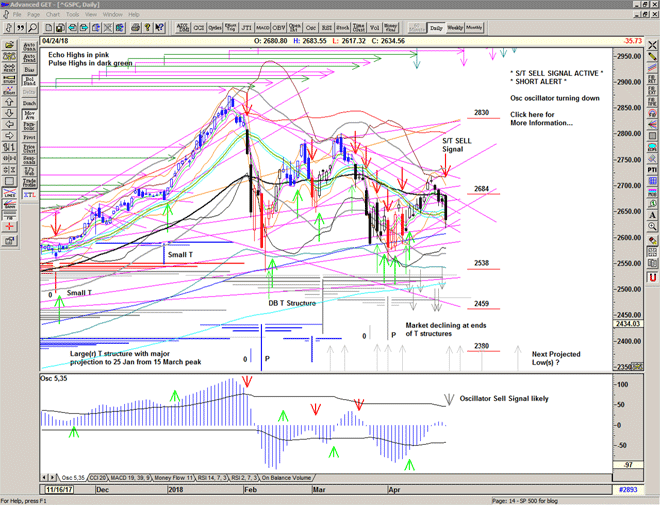
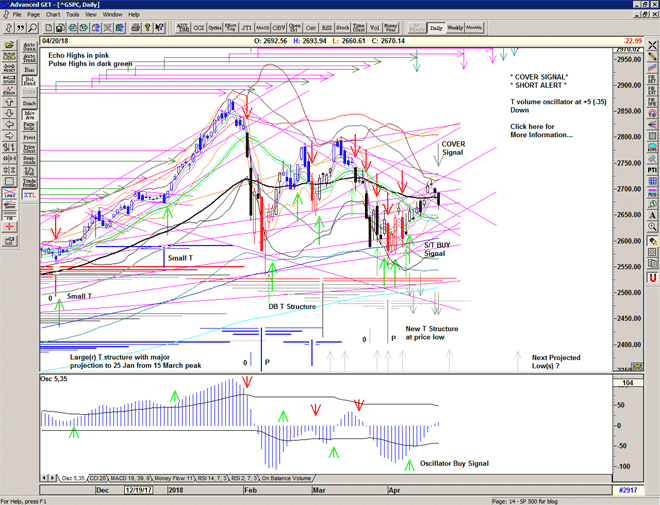
Market triggered a Cover Signal at 2681, dropped hard into the 2660s with a short covering rally into the close for good measure.

We shall await the next signal.

Chart of S&P 500 for 23 April 2018

Be prepared for whatever is coming next, and trade with confidence:

To receive detailed daily analysis, guidance and the updated daily Buy / Sell trigger levels being generated by the Trading the Line system before the market opens, and intraday alerts when appropriate, please become a Member and Sign up for Alerts & Observations – includes access to Members Area and the Explanatory Notes for all of the concepts discussed.

Disclaimer: This is the diary of a personal trading system, its methodology and the signals that it is producing. You are welcome to follow along but please understand that the information presented here is for educational purposes only. No recommendations are being made to buy, or sell stocks, options or futures contracts. Please consult your own financial advisor before making any investment decisions.


Unto the breach

Once more unto the breach, dear friends, once more;
Or close the wall up with our English dead!
In peace there's nothing so becomes a man
As modest stillness and humility:
But when the blast of war blows in our ears,
Then imitate the action of the tiger.

William Shakespeare, Henry V, 1599

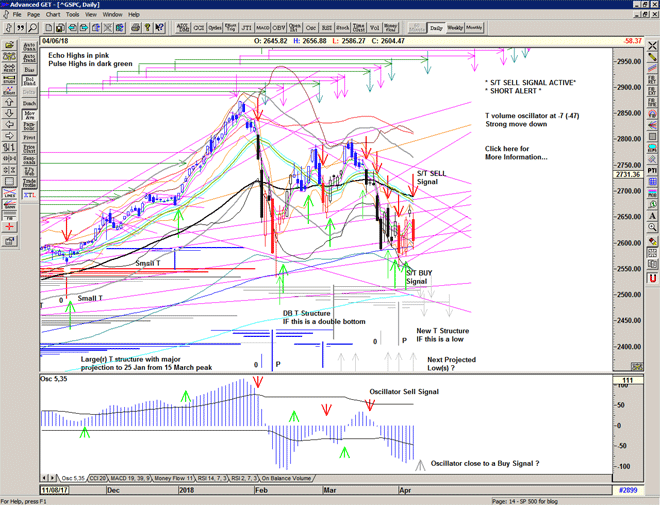
Another gap down, a failed attempt to rally in effect closing the gap and a Cover signal at 2631.

The market tried, in vain, to hold onto the 2631 level, but once breached – from a failed recovery attempt – found little support before 2600 activating a Sell Signal at 2621 and a return to the lows of the week.

The ping-pong within the volatile sideways / downwards channel continues, again challenging the 200 day moving average, as the market continues to sell hard into any negative news.

A relatively strong recovery into the close suggests the possibility of another recovery ahead and it is therefore pragmatic to cover at the close.

The question still remains: a double bottom, or a deeper low ahead?

Chart of S&P 500 for 09 April 2018

Be prepared for whatever is coming next, and trade with confidence:

To receive detailed daily analysis, guidance and the updated daily Buy / Sell trigger levels being generated by the Trading the Line system before the market opens, and intraday alerts when appropriate, please become a Member and Sign up for Alerts & Observations – includes access to Members Area and the Explanatory Notes for all of the concepts discussed.

Disclaimer: This is the diary of a personal trading system, its methodology and the signals that it is producing. You are welcome to follow along but please understand that the information presented here is for educational purposes only. No recommendations are being made to buy, or sell stocks, options or futures contracts. Please consult your own financial advisor before making any investment decisions.


Petition

A straight up day through the Buy Signal line and a strong close continuing Tuesday's recovery and suggesting that perhaps, now, the market has discounted (some of) the recent news related negativity.

A significant improvement especially considering the overnight weakness in Futures which traded in the region of 2550.

Chart of S&P 500 for 05 April 2018

Be prepared for whatever is coming next, and trade with confidence:

To receive detailed daily analysis, guidance and the updated daily Buy / Sell trigger levels being generated by the Trading the Line system before the market opens, and intraday alerts when appropriate, please become a Member and Sign up for Alerts & Observations – includes access to Members Area and the Explanatory Notes for all of the concepts discussed.

Disclaimer: This is the diary of a personal trading system, its methodology and the signals that it is producing. You are welcome to follow along but please understand that the information presented here is for educational purposes only. No recommendations are being made to buy, or sell stocks, options or futures contracts. Please consult your own financial advisor before making any investment decisions.


Mountaintop

Well, I don't know what will happen now.
We've got some difficult days ahead.
But it really doesn't matter with me now, because I've been to the mountaintop.
And I don't mind…

Martin Luther King, 1968

No looking back and the market quickly drops below the Buy Signal level triggering a Cover Signal at 2628 and a Sell Signal below that at 2620.

Another relentless day of selling finds (some) support at 2555 and some strength returns into the close.

Cover at the close

Chart of S&P500 for 03 April 2018
 

Be prepared for whatever is coming next, and trade with confidence:

To receive detailed daily analysis, guidance and the updated daily Buy / Sell trigger levels being generated by the Trading the Line system before the market opens, and intraday alerts when appropriate, please become a Member and Sign up for Alerts & Observations – includes access to Members Area and the Explanatory Notes for all of the concepts discussed.

Disclaimer: This is the diary of a personal trading system, its methodology and the signals that it is producing. You are welcome to follow along but please understand that the information presented here is for educational purposes only. No recommendations are being made to buy, or sell stocks, options or futures contracts. Please consult your own financial advisor before making any investment decisions.


S/T SELL Signal at 2620

Market quickly moved below the BUY Signal level this morning without any attempt to recover, signalling to Cover and activating an S/T SELL Signal.

S/T SELL Signal at 2620

Market potentially finding support in the 2550 region, and recovery potentially underway above 2580. I would not recommend holding short position overnight.


Fool’s Gold

I'm standing alone
I'm watching you all
I'm seeing you sinking
I'm standing alone
You're weighing the gold
I'm watching you sinking
Fool's gold

The Stone Roses, Fools' Gold, 1989
Songwriters: Ian George Brown / John Squire

An S/T Buy Signal at 2638 and follow through to 2559 with profit-taking into the close.

Chart of S&P 500 for 02 April 2018

Be prepared for whatever is coming next, and trade with confidence:

To receive detailed daily analysis, guidance and the updated daily Buy / Sell trigger levels being generated by the Trading the Line system before the market opens, and intraday alerts when appropriate, please become a Member and Sign up for Alerts & Observations – includes access to Members Area and the Explanatory Notes for all of the concepts discussed.

Disclaimer: This is the diary of a personal trading system, its methodology and the signals that it is producing. You are welcome to follow along but please understand that the information presented here is for educational purposes only. No recommendations are being made to buy, or sell stocks, options or futures contracts. Please consult your own financial advisor before making any investment decisions.