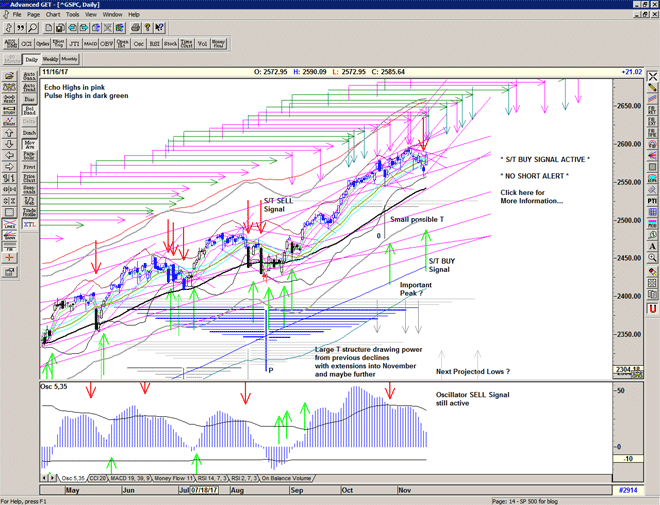
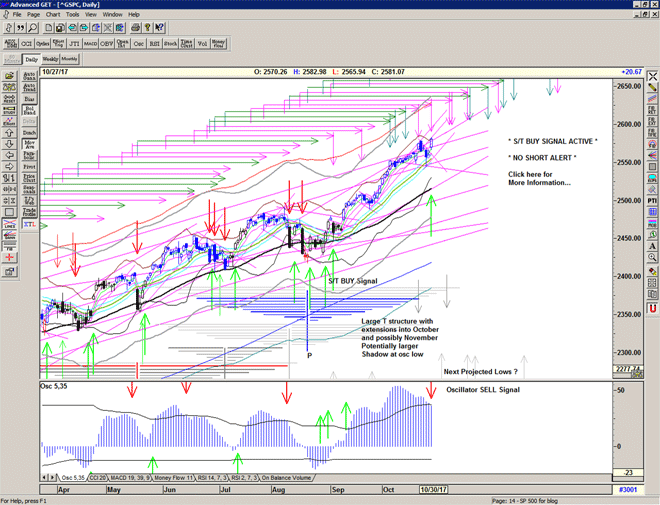
S/T SELL Signal active below 2571

Strong selling into a weak open triggers a S/T Sell signal at 2565 in early trade.

Watch for a bounce and/or selling into any recovery from this weakness.

Strong bounce off the early morning low in-line with recent action.

No follow through above the Sell Signal level and so the system is signalling short, for now.

Obviously its quite a close call with the market hovering just below the signal line for most of the day and there has not been much selling since the open.

Market looks like its in some kind of holding or waiting mode and I am not sure that I would recommend holding a short position overnight, due to the risk of a gap up tomorrow.

Hedge accordingly.


Milvian Bridge

Yesterday's gap up open triggered another S/T Buy Signal at 2568* and subsequently a strong rally into 2580.

Note that when a gap up holds firm the strong momentum associated with this move continues into a strong close at the highs – a gap and go close at the highs.

Note also that the Osc oscillator – a lagging indicator – is now making a Sell Signal. Although this does not necessarily mean that price cannot go higher it does suggest that price may not make significant advances yet as it is usually associated with consolidation phases.

In the meantime the current active large T structure* that is centred at the August low continues to push the market higher in-line with expectations. The precision of the last 3 important projections and the renewed strength confirmed by the Buy signal supports the projections for further highs in due course.

* If you would like to receive the price trigger levels prior to the open, and/or learn more about T Theory and how it accurately projects highs in the market, please subscribe to the service.

Chart of S&P 500 for 30 October 2017

Be prepared for whatever comes next:

To receive detailed daily analysis, guidance and the updated daily Buy / Sell trigger levels being generated by the Trading the Line system before the market opens, and intraday alerts when appropriate, please become a Member and Sign up for Alerts & Observations – includes access to Members Area and the Explanatory Notes for all of the concepts discussed.

Disclaimer: This is the diary of a personal trading system, its methodology and the signals that it is producing. You are welcome to follow along but please understand that the information presented here is for educational purposes only. No recommendations are being made to buy, or sell stocks, options or futures contracts. Please consult your own financial advisor before making any investment decisions.


Cover Signal confirmed at 2559

A nasty drop and some relentless selling in the morning, followed by a sharp bounce and rally off the Mid-channel which is often an initial support on first visit.

Technically some damage done and just failed to close back above the important Buy Signal line.

Therefore a cover signal at 2559 for now whilst the market stabilises.

And that is a nasty declining angle from the all time high that we will need to negociate moving forwards

First Lightning

Market closed yesterday still in Neutral / slightly Bearish Mode waiting for direction.
No strength to follow through on overnight gains, but holding onto the important 55 ema for now.

The momentum oscillator looks to be making a Buy Signal.
The T volume oscillator back just below zero – failure here is a Sell Signal.

On the anniversary of the soviets first atomic bomb test – First Lightning – the North Koreans fire a missile over Japanese air space. Futures are subsequently trading below the Sell Signal line but bounced from initial lows in the region of 2420. Early morning reaction and political rhetoric will likely set the stage for the day.

Chart of S&P 500 for 29 August 2017

Be prepared for whatever comes next:

To receive detailed daily analysis, guidance and the updated daily Buy / Sell trigger levels being generated by the Trading the Line system before the market opens, and intraday alerts when appropriate, please become a Member and Sign up for Alerts & Observations – includes access to Members Area and the Explanatory Notes for all of the concepts discussed.

Disclaimer: This is the diary of a personal trading system, its methodology and the signals that it is producing. You are welcome to follow along but please understand that the information presented here is for educational purposes only. No recommendations are being made to buy, or sell stocks, options or futures contracts. Please consult your own financial advisor before making any investment decisions.


Libération

No follow through. Cover signal triggered at 2440, but not quite a sell signal.

Chart of S&P 500 for 25 August 2017

Be prepared for whatever comes next:

To receive detailed daily analysis, guidance and the updated daily Buy / Sell trigger levels being generated by the Trading the Line system before the market opens, and intraday alerts when appropriate, please become a Member and Sign up for Alerts & Observations – includes access to Members Area and the Explanatory Notes for all of the concepts discussed.

Disclaimer: This is the diary of a personal trading system, its methodology and the signals that it is producing. You are welcome to follow along but please understand that the information presented here is for educational purposes only. No recommendations are being made to buy, or sell stocks, options or futures contracts. Please consult your own financial advisor before making any investment decisions.


S/T Buy Signal at 2444

The market is in fine form again today and back at the important 55 ema at 2444.

As you know this is an important level and failure here would be continuation Sell Signal.

A close above 2444 is an S/T Buy Signal, with an expectation of an attempt on the descending resistance of the declining channel.


S/T Sell Signal at 2457

The Echo high provides a little fuel and confirms my suspicions that we saw a kiss good-bye of an important rising trend line yesterday.

Further failure at the 55 ema cancels the possible new T at last week's low and brings the possibility of a visit to the lower reaches of the channel as we look for a larger structure to form in the days or weeks to come.