S/T BUY Signal at the open

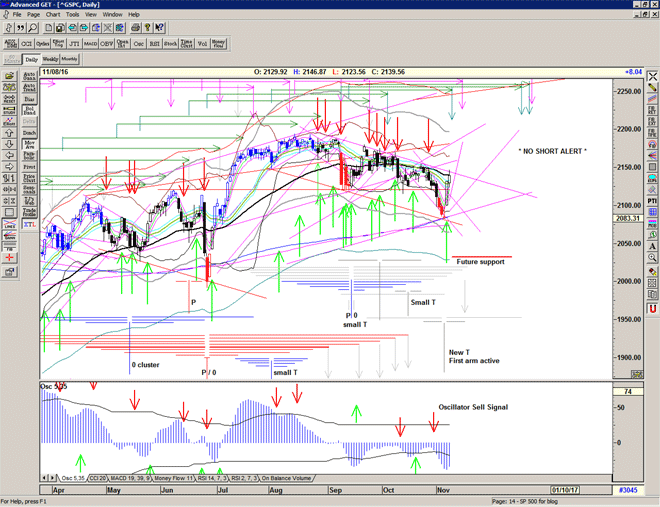
Sometimes the market bounces and fails and then the real bounce starts the next day, with avengeance.

The market roars its approval of Hillary and breezes through resistance and up into the mid-channel area.

A new small T is activated, and we can see that if this breaks through the downward sloping resistance, we have the possibility for a larger T structure and a rally into Christmas and the New Year.

Its just politics, stupid

Cat’s paw

Nice bounce at horizontal support.
Covered at 2128, and speculative buying only above 2130.
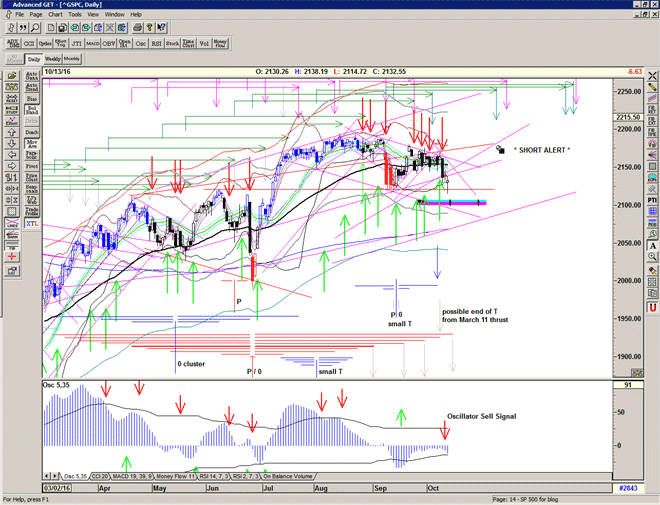
Short signal still in place after breakdown through important rising lines but perhaps there is more in this bounce first, strong resistance at 2140 now.

Chart of S&P500 for 14 October 2016

For more detailed analysis, please Sign up for Alerts & Observations

Disclaimer: This is the diary of a personal trading system, its methodology and the signals that it is producing. You are welcome to follow along but please understand that the information presented here is for educational & entertainment purposes only. No recommendations are being made to buy, or sell stocks, options or futures contracts. Please consult your own financial advisor before making any investment decisions.


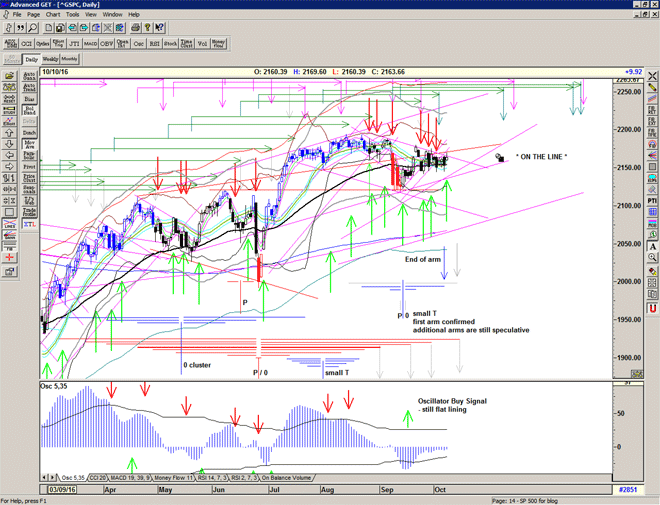
Short Term Buy above 2163 but still in triangle

Early bullish start to the day triggered a short-term Buy Signal but as we can see the consequent pullback remains consistent with the recent triangular and descending resistance.

Given the benefit of doubt due to the potentially bullish nature of the end arms of the large red T and recent small blue T, but looks like we may still be suffering from the see-saw day-trading environment.

Chart of S&P500 for 11 October 2016

For more detailed analysis, please Sign up for Alerts & Observations

Disclaimer: This is the diary of a personal trading system, its methodology and the signals that it is producing. You are welcome to follow along but please understand that the information presented here is for educational & entertainment purposes only. No recommendations are being made to buy, or sell stocks, options or futures contracts. Please consult your own financial advisor before making any investment decisions.


S/T Sell Signal at 2151

A Short Signal from 2151 occurring with the market dropping out of the recent triangle, and looking like its right on time with a cycle high scheduled for tomorrow, and the recent expiration of major arm of the red T structure.

Maybe targetting support lines at 2130 or 2120.

More tomorrow.

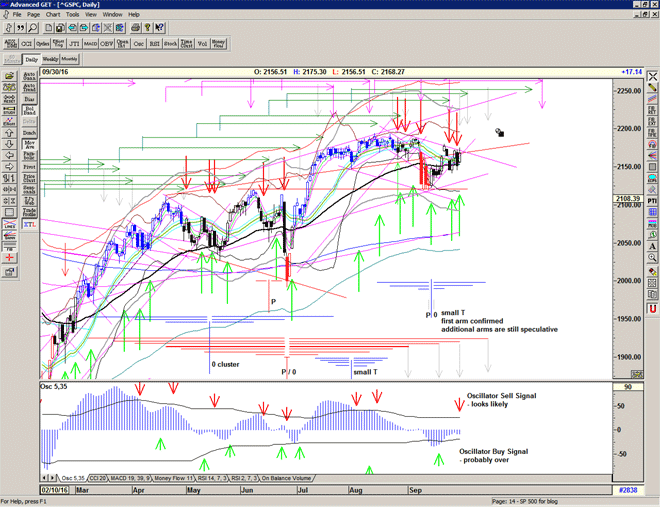
Triangle time

Triangle in play and hit expected resistance at 2172-5 with profit-taking.

Recovery of the T volume oscillator suggesting that there is the possibility of short-term strength into the early part of the week with another short-term high scheduled for October 4-5.

Choppy day-traders market likely to continue until direction resolved.

Chart of S&P500 for 01 October 2016

For more detailed analysis, please Sign up for Alerts & Observations

Disclaimer: This is the diary of a personal trading system, its methodology and the signals that it is producing. You are welcome to follow along but please understand that the information presented here is for educational & entertainment purposes only. No recommendations are being made to buy, or sell stocks, options or futures contracts. Please consult your own financial advisor before making any investment decisions.


S/T Buy Signal at 2163

Erratic market signals trouble ahead, but covered and back on a Buy Signal at 2163, expect short-term.

The erratic nature of the signalling is also 'telling' us something – and we should expect it to continue for the next few weeks. The market does not want to go down, there are significant forces at play keeping it up, but when the buying power dries up – albeit temporarily – as to be expected at the end of a major T structure, then the market will drop hard until the buyers are found at lower prices.

I think we are being warned that something unpleasant is about to occur.

Be prepared.