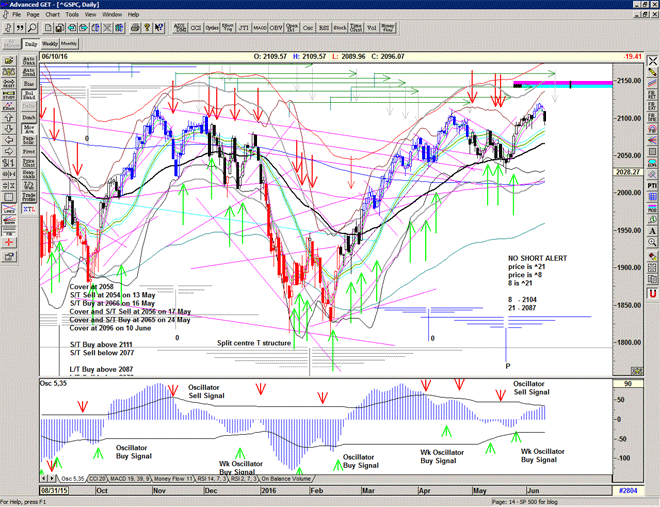
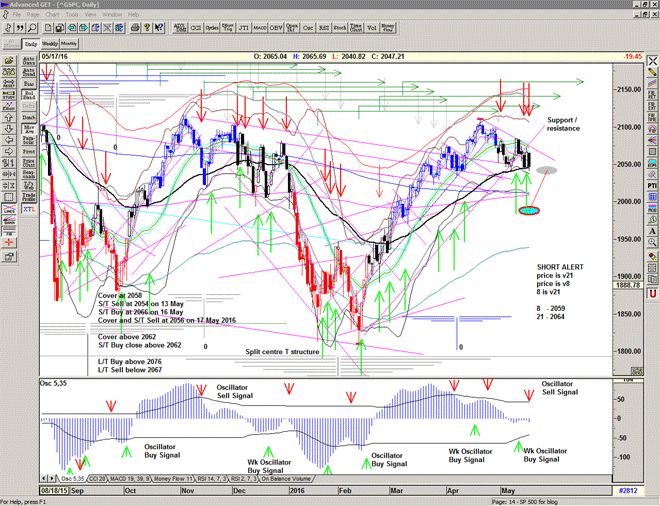
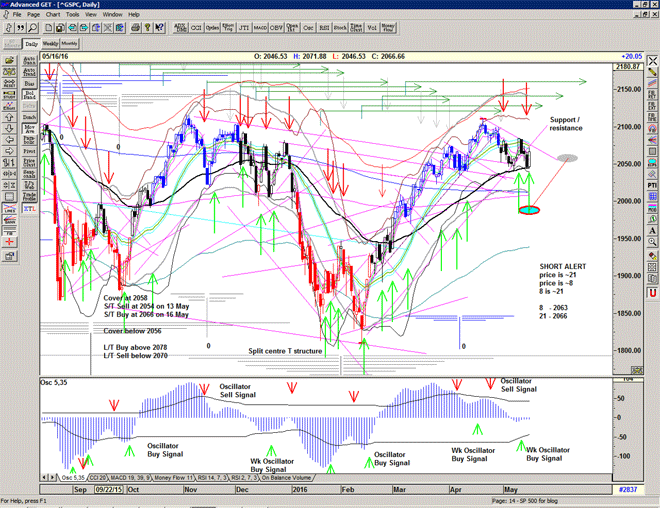
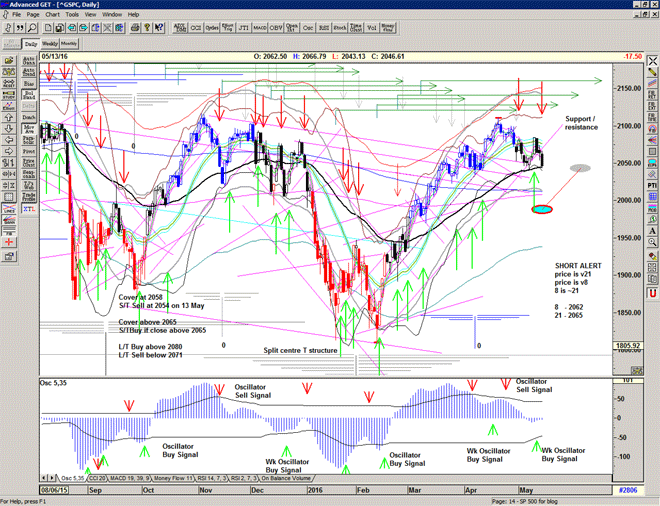
Cover at 2058
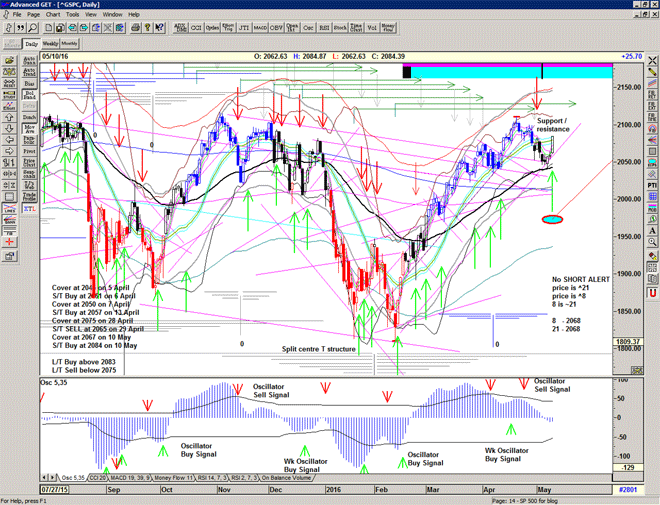
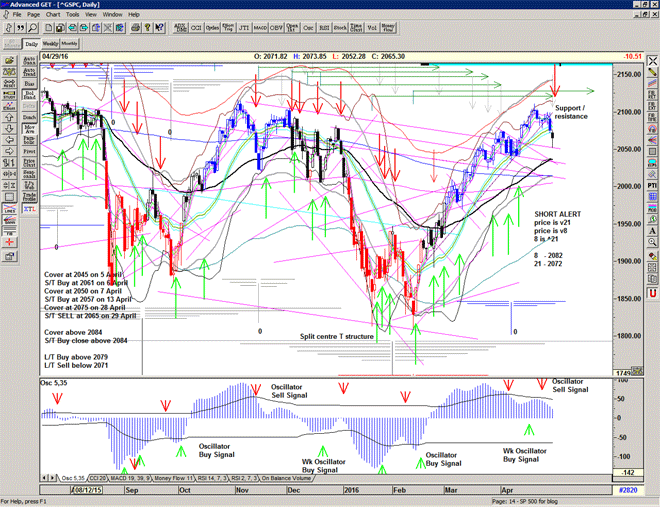
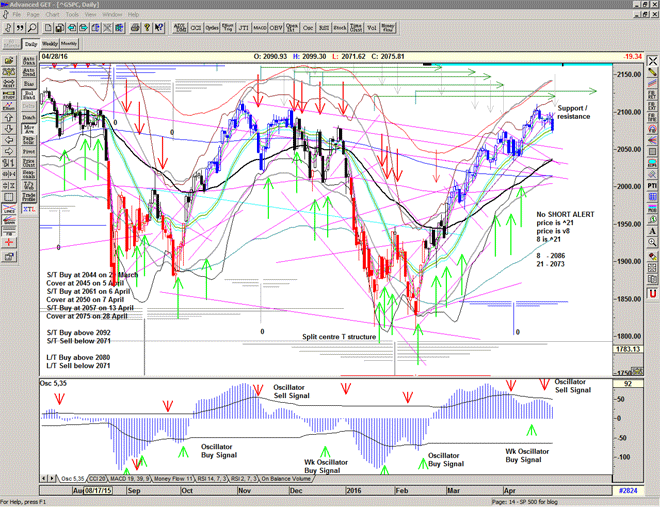
We appear to be breaking down below the recent support angle, in which case we may be looking at a move down to the lower edge of the gray channel and the 200 MA – about 2015
Cover at 2058
A navigation system for trading the S&P500 index
We appear to be breaking down below the recent support angle, in which case we may be looking at a move down to the lower edge of the gray channel and the 200 MA – about 2015
Cover at 2058
Continuing the recent action of Buying the morning dips.
S/T Buy signal, stop at 2033 on closing basis.
The doji on tuesday may well be signalling a short term top.
Also suggested by the T structures from the february low and from T volume oscillator in January.
Interestingly the T volume oscillator dropped down to zero yesterday, hinting at things to come.
Arms reading was 2.00 – high enough to signal a short term recovery, perhaps after any further weakness today. A bear trap?