Pop and drop

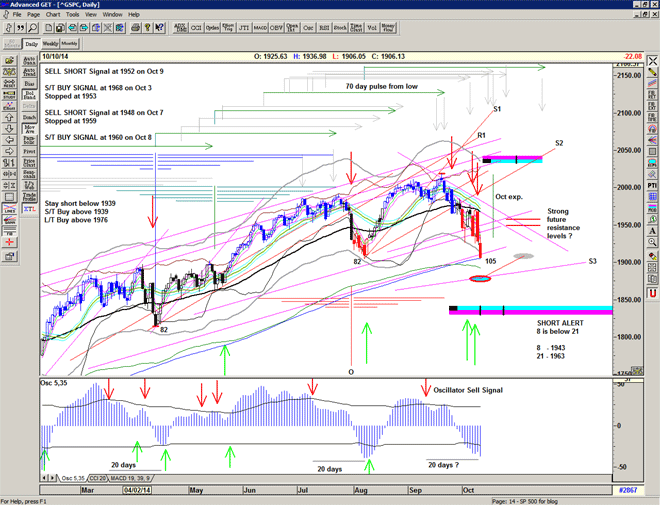
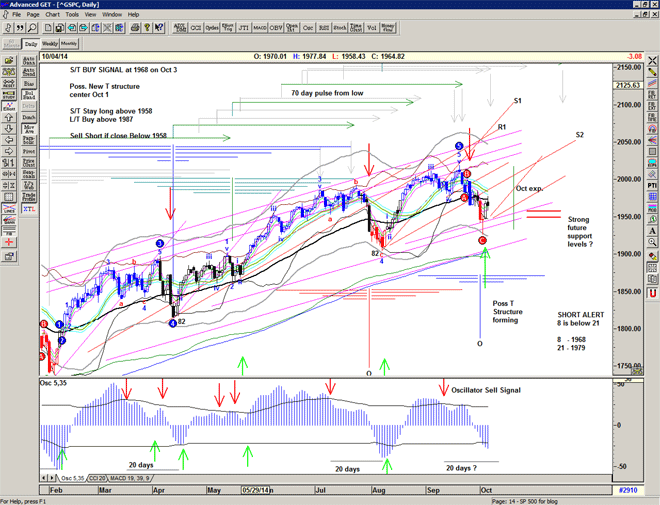
OK we failed the initial pop, and failed to get above the 55ema, which were my reservations on the Buy Signal on Friday.

Futures are down 9 at this moment and if we fail to recover today, then another low may be required. Maybe test the prevous lows – 1926 and/or 1905.

Watch to see if we find some kind of support on one of the rising lines from the Oct 2 spike low, or Not.

Chart of S&P500 for 7 October 2014

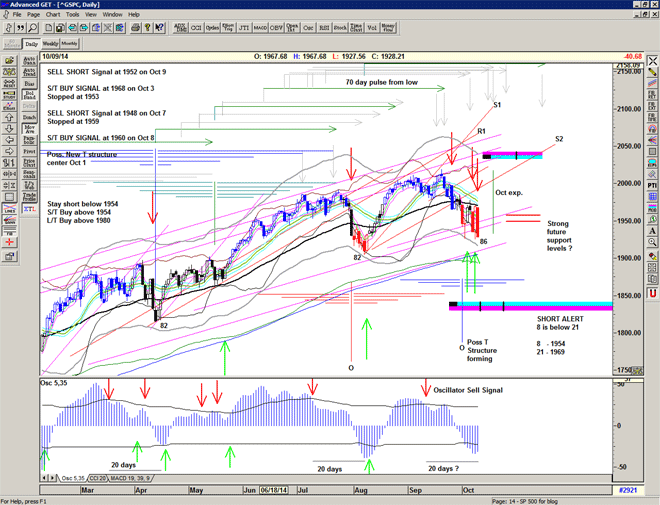
Small T structure confirmed ?

Market recovered enough, and held on Friday afternoon to confirm a short term Buy Signal, and Futures are positive this morning so the expected follow through should remove any doubts.

It looks like the T will provide bullish strength into October 24.

Watch out for any failure below the S2 support angle, currently at 1985.

Chart of S&p500 for 6 October 2014

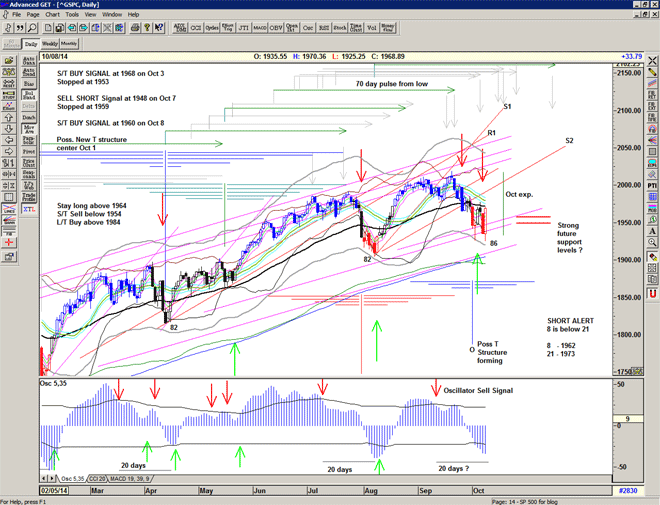
and now some real selling

Elevator down.

Reminders for future reference:

– use Vol. Oscillator low to determine peaks when there is a discrepancy between oscillator and price lows.
– when you have an oscillator sell signal in play, and then a token new high, look for a kiss goodbye of the rising trendline that it broke

And so where do we bounce?

Maybe here
But ideally a bit lower – 1930 or 1908

Watch for stabilisation just below or near to the grey lower boundary of the channel

Chart of S&P500 for 2 October 2014


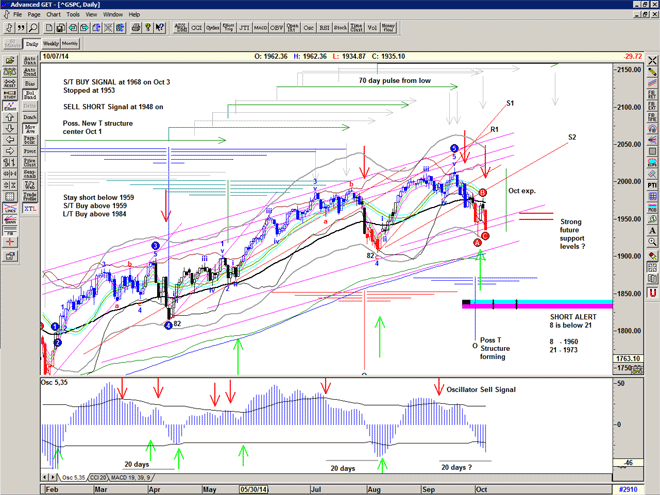
Rally into October

Holding onto the S2 support.
Looks like we could get a couple days of strength into resistance and to finish off this blue T structure.

And then I would expect a quick flush out to the 1930's, perhaps 1910's for an October Low and Buying opportunity into the Winter.

Chart of S&P500 for 30 September 2014

more ugly?

Nice rally on Friday but the short signal remains in play until we close back above1989 at least.

Not likely today due to very negative futures. But can we hold at 1955-60 ?

Possible next level of support at 1935 and then 1908 ish.

Chart of S&P500 for 29 September 2014

Short Signal at 1982

As suspected yesterday's rally was a fake out.

Failure at the mid-point and penetration through the 55 ema and gann support line S2 add to the ugliness.

Of course we are now due a dead cat bounce and a rally back up to the 21 ema (1991) would provide excellent short entry.

Chart of S&P500 for 26 September 2014

Only kidding

A nice relief rally off 1978, but not quite a Buy signal.
It does look like a replay of the previous bounce may occur – need to see follow through with conviction.

Note: similarity with March 27 low.

Dangerous markets ahead.

Chart of S&P500 for 25 September 2014