Gap and go

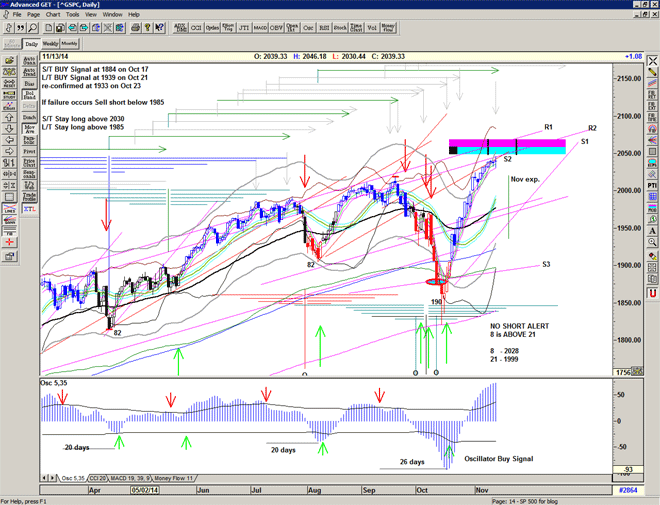
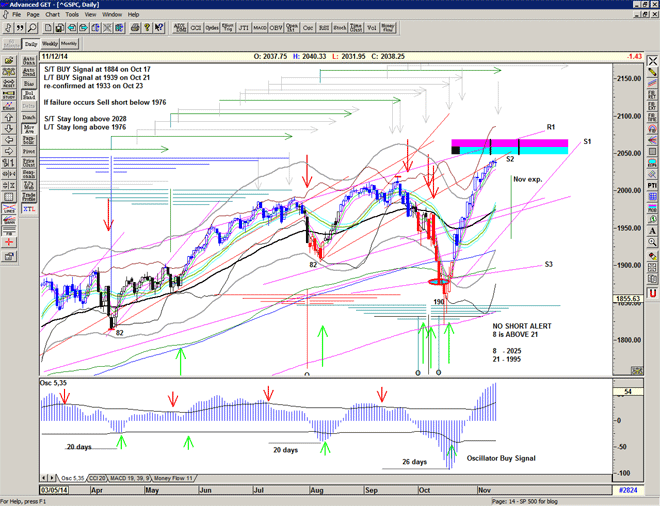
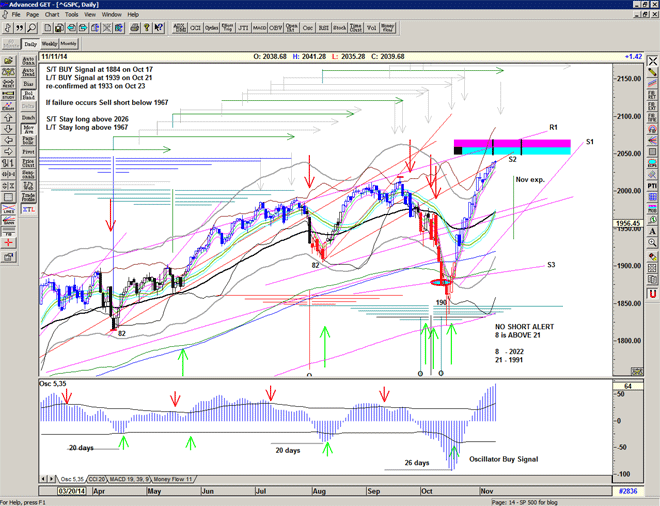
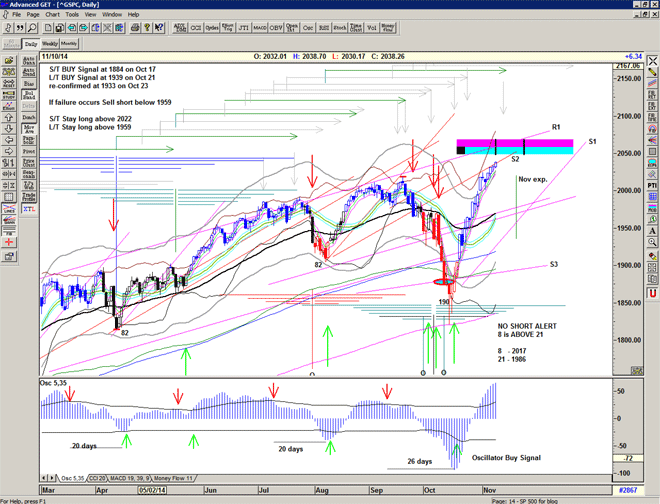
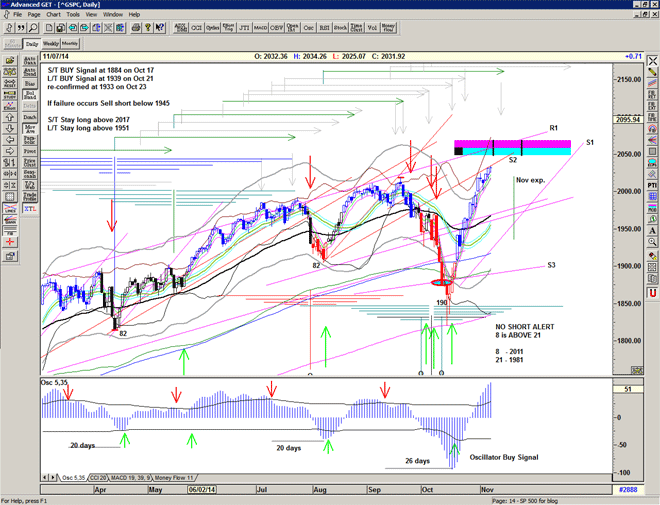
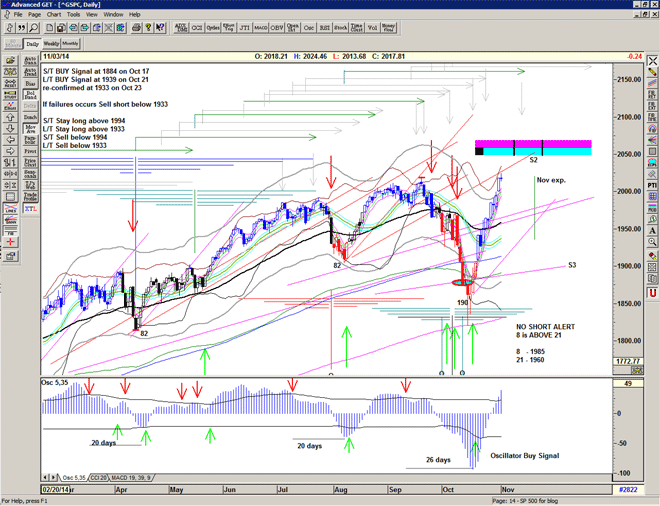
A gap up and close at new highs – what a couple of weeks… the bull keeps going.

And looks like a new bull run is being initiated, with very strong volume oscillator.

Watch out for resistance along S2 for potential kiss goodbye, and target 2050 at the MOB.

Chart of S&P500 for 3 November 2014

crossroads

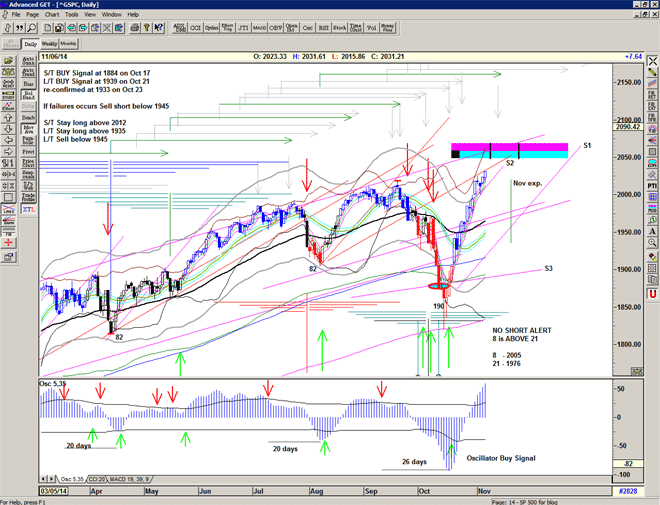
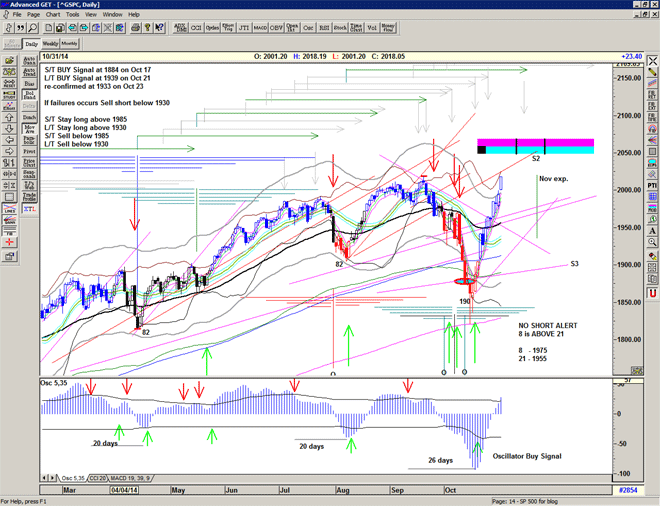
To all intents and purposes we have now acheived the recovery from the 10% decline from the Sept 19 peak, and if the 'down-trend' was to stay in place then this is where we would expect to see the recent rally to falter.
This is clearly shown by the ellipse tool.

However the T structure looks strong with a momentum peak on Oct 24, and so we should expect to see continuation at least into mid November.

Chart of S&P500 for 28 October 2014

more strength

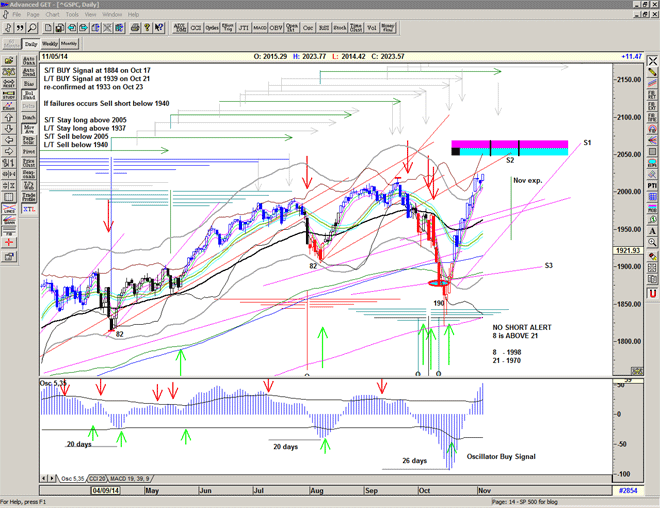
The last 2 days seem to have resolved the resistance at the 55 Ema (for now), and it wouldn't be surprising to see new highs or matched highs

The current T structure suggests that the strength will last into a topping pattern between 11th and 19th of November, it is slightly fuzzy due to the flat top between 26 August and 8 September.

Chart of S&P500 for 27 October 2014


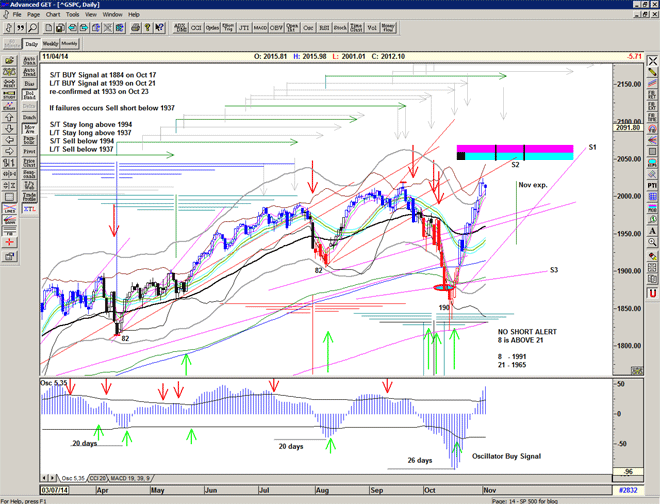
L/T Buy Signal cancelled

Failure at the 55EMA and dropping back below the mid-point is potentially a L/T Sell signal. Unconfirmed due to the current S/T Buy Signal. It may just be that the market got over-heated. Note RSI 2 had got above 96 on tuesday. With the current volatility it is too close to call, particularly as 1929 was breached only in the last half hour of the day.

Futures are very positive (+13), so it looks like yesterday afternoon's negativity was unfounded.

Chart of S&P500 for 23 October 2014

L/T BUY SIGNAL at 1939

And another very strong day bringing us back up above the mid-point and providing the Long Term Buy Signal.

Note: the recent correction bounced hard at the 350 ema and that Terry laundry described this as the 'optimum moving average' for the S&P500 – a fantastic buying location for a bounce, a failure there would have significant repercussions (eg August 2008)

Chart of S&P500 for 22 October 2014