Target 200
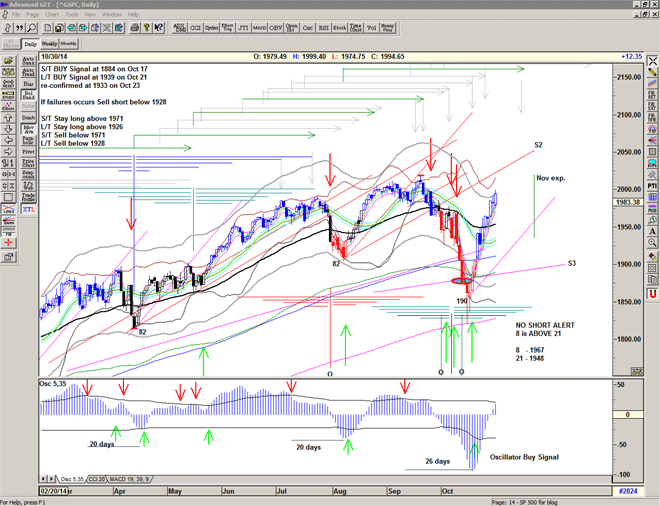
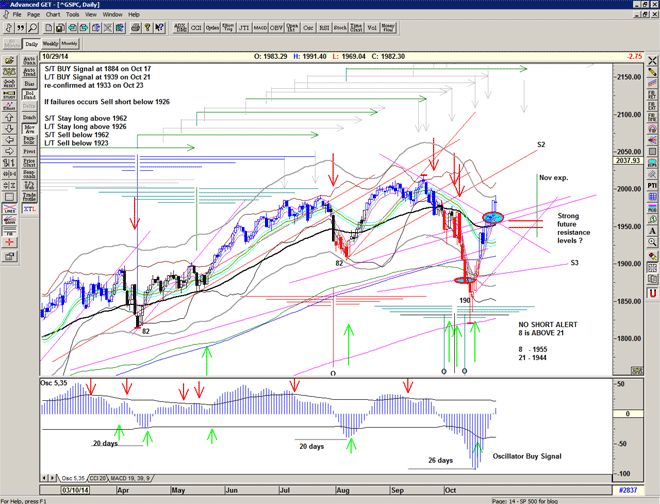
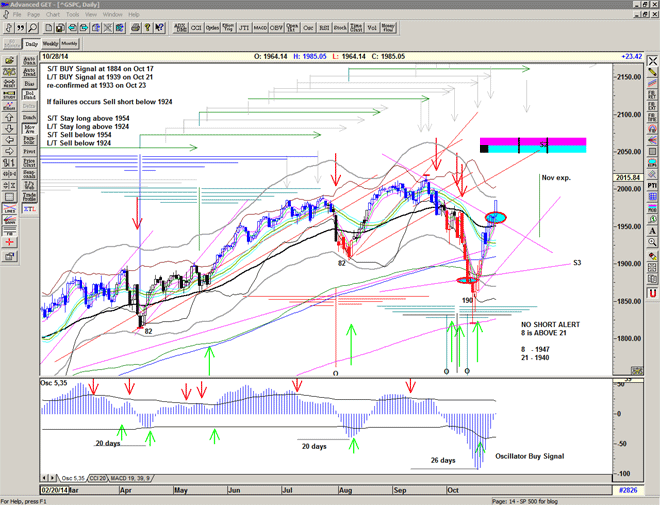
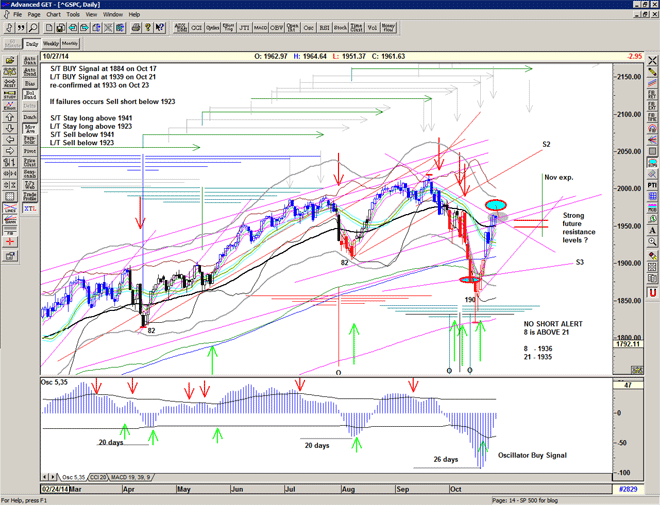
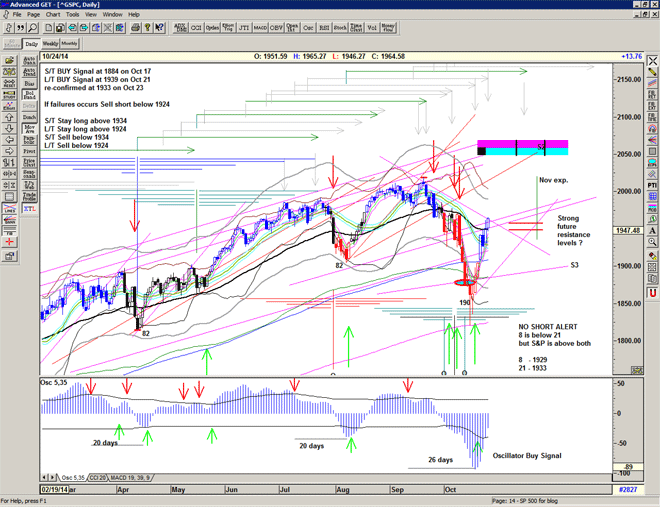
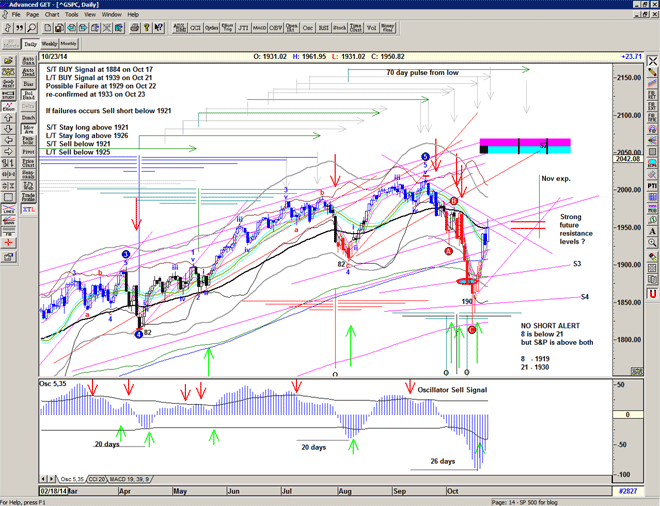
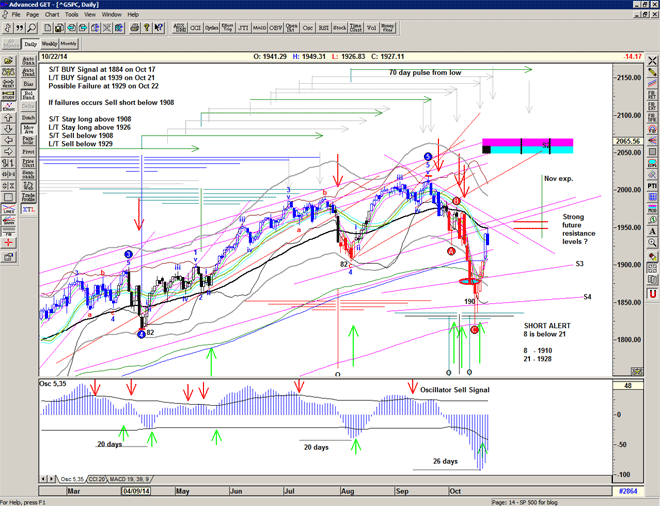
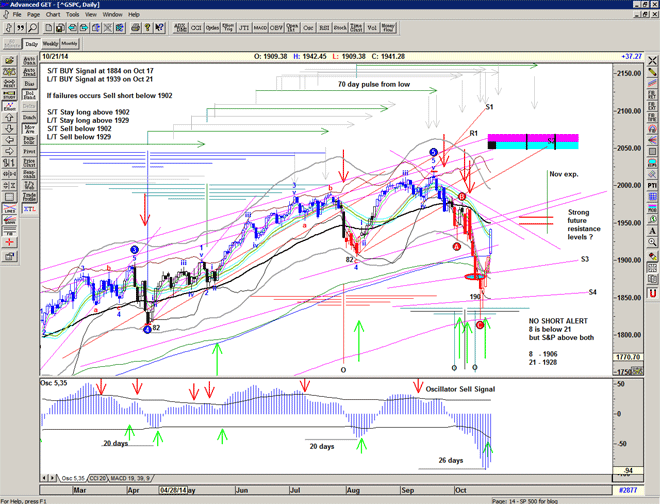
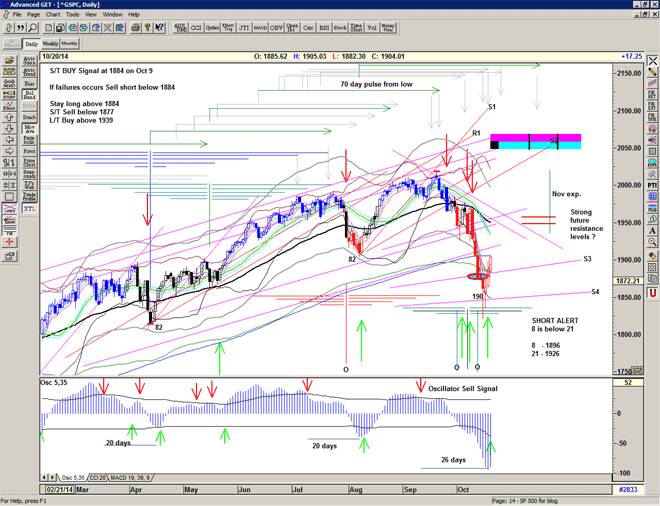
Looks like we get a expiration short covering rally. Short term Buy Signal at 1884 – easily within reach today – especially with nice comments from the FED.
If we get above the 200MA at 1905, then more buyers will come in.
Beware if failure occurs below 1875 as that would be a continuation short signal.
target acheived
ok looks like we had a pre-expiration panic with loads of delta hedging causing a flush.
Nice recovery, but futures are seriously negative again today. A retest of the 1830s perhaps.
Notice those 70 day pulse projections are forcing the market down. It looks like we may need to wait til end of the month before stabilisation can occur.
Looks like we have a double bottom in vol oscillator, which may mean that things are stabilising under the surface. If correct then a potential recovery into mid November.
Indecision or failure
200 Day
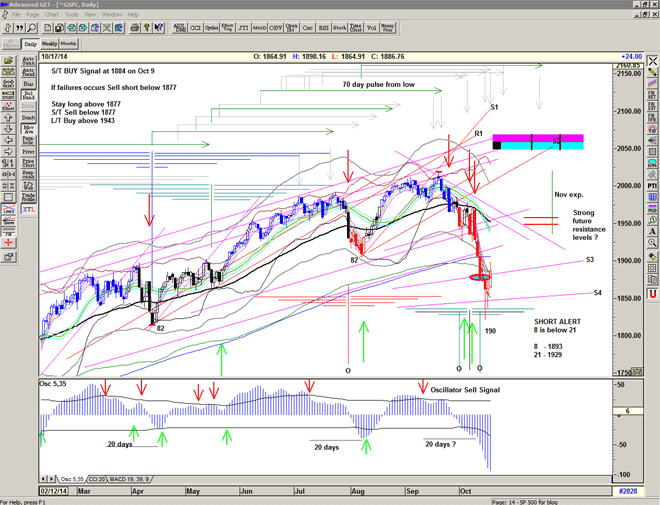
So we finally arrived at the 200 ma. And we have now penetrated my gray channel to the downside.
There may not be much more downside this week as these levels and the ellipse tool suggest strong support in the 1880 area. That and the potential for profit-taking from significant bearish put positions on the indexes.
However the market is now vulnerable to further declines.
Railroad Tracks
There is a classic chart pattern and a rare one at that called “railroad tracks.” That pattern describes the action in the indices the last two days. Railroad tracks point to distribution, i.e., professional selling. Because they often occur near a top, the pattern is a sell signal. (Mish Schneider)
Certainly ugly. Next point of possible return is the 1905-1910 level on the Gann line from the Feb low. Also the 200ma.
A steep decline, waterfall, may well be required. The MOB indicates possible turns today and a secondary one on 23 Oct.
Perhaps we bounce there today and try to recover into expiration next week.
Sell Short Signal (again) at 1952
OK, so you get a Buy Signal on monday – you sell.
You get a sell signal on tuesday – you buy.
You get a buy signal on wednesday – you sell.
Notice the magnitude is getting larger – remember the megaphone comments on Sept 23 at 1983.
Notice that the one day rallies are sold into
This must be a bear market cause everyone is getting taken out and beaten up.
This might be expected if we were below the 200 day ma (1904) but we aren't yet.
This leads me to suspect that this may be the tip of a much greater decline, perhaps a manic selloff into late October to re-charge the Bull, perhaps something worse. We have been warned.
Buy Signal at 1960
A nice relief rally and close above the Buy Signal level of 1960.
Lots of potential resistance above – 55 Ema at 1971 and midpoint at 1979,
but the T Theory volume oscillator looks great.
Assuming that we can get through the resistance and close above 1983, then we have the potential for new highs.
It looks like we have a cluster of highs scheduled for oct 14 and 17 – into expiration.