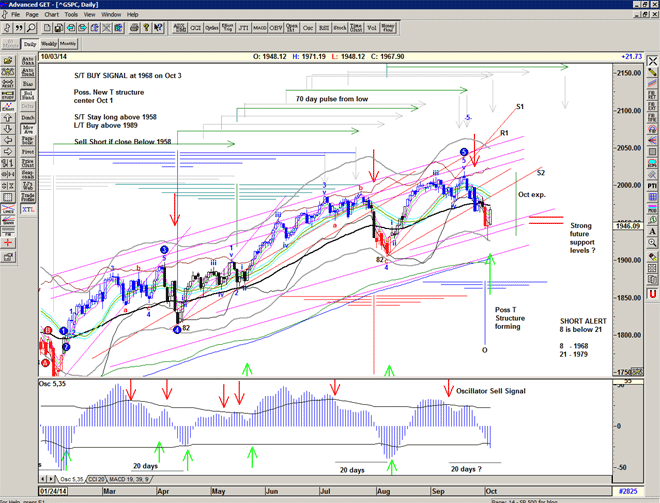
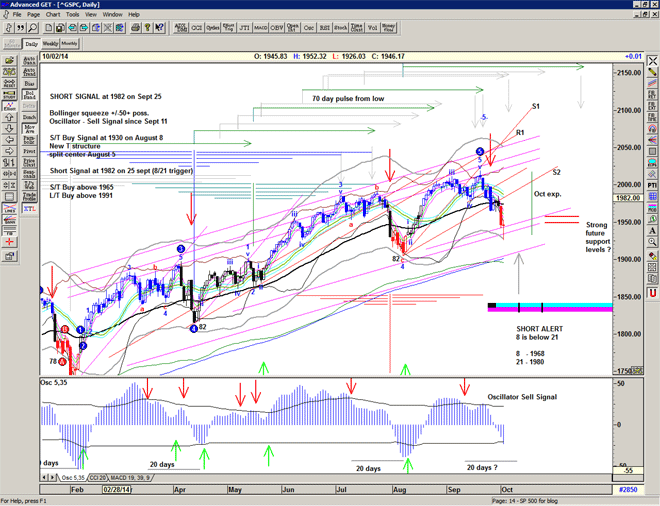
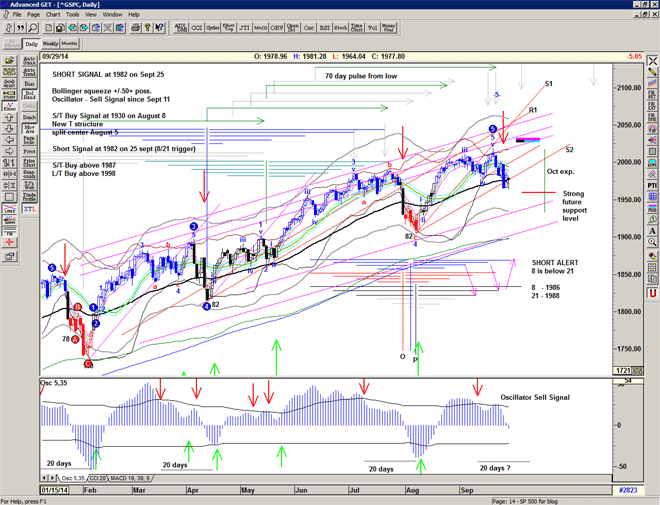
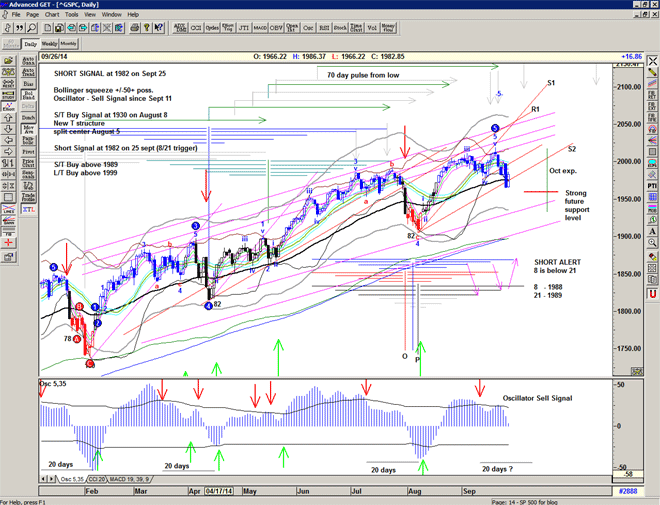
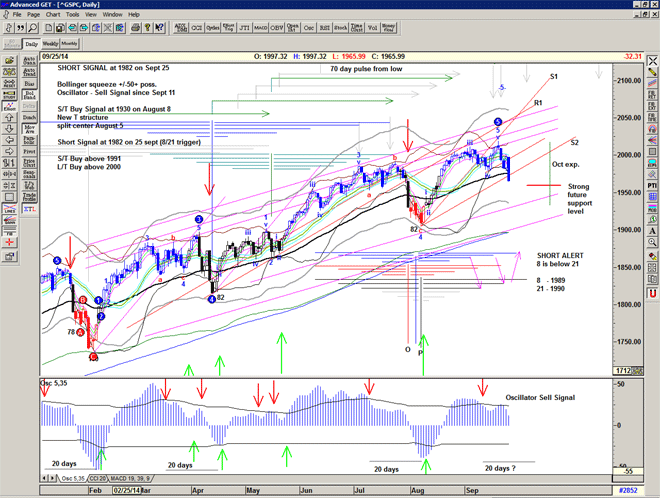
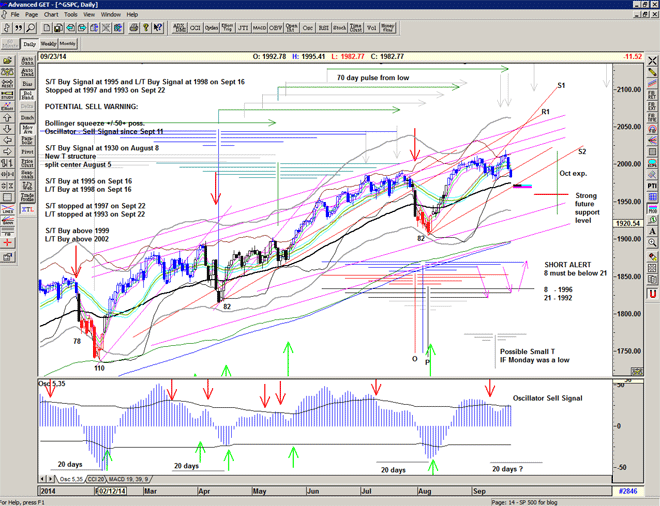
and now some real selling
Elevator down.
Reminders for future reference:
– use Vol. Oscillator low to determine peaks when there is a discrepancy between oscillator and price lows.
– when you have an oscillator sell signal in play, and then a token new high, look for a kiss goodbye of the rising trendline that it broke
And so where do we bounce?
Maybe here
But ideally a bit lower – 1930 or 1908
Watch for stabilisation just below or near to the grey lower boundary of the channel
More ugly
Rally into October
more ugly?
Only kidding
megaphone
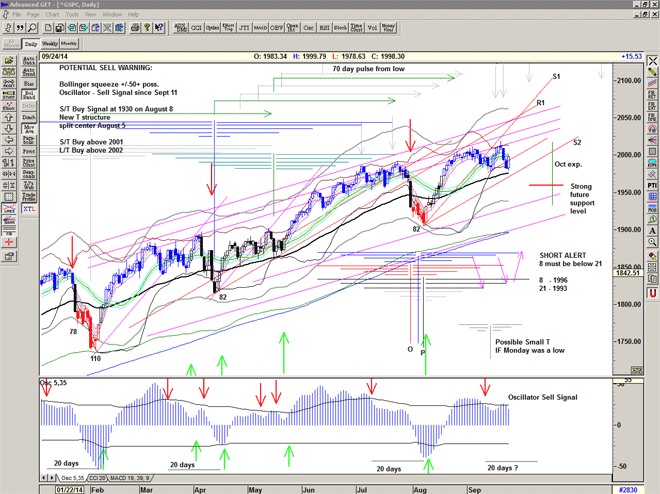
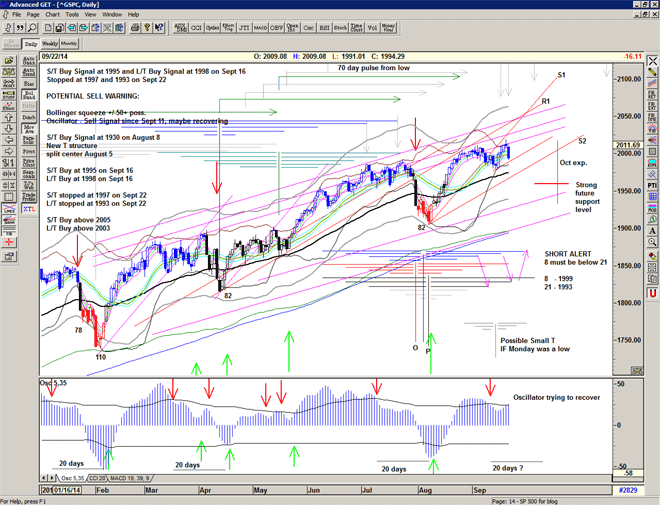
Sell Warning ?
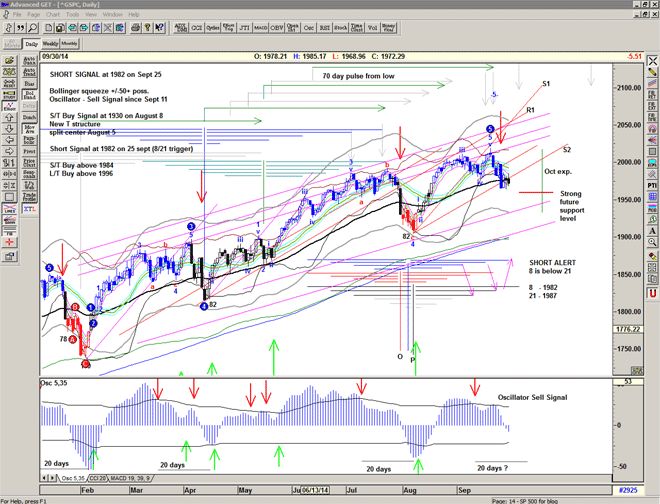
Stopped out on S/T at 1997 and L/T at 1993 for small net loss of -3 points
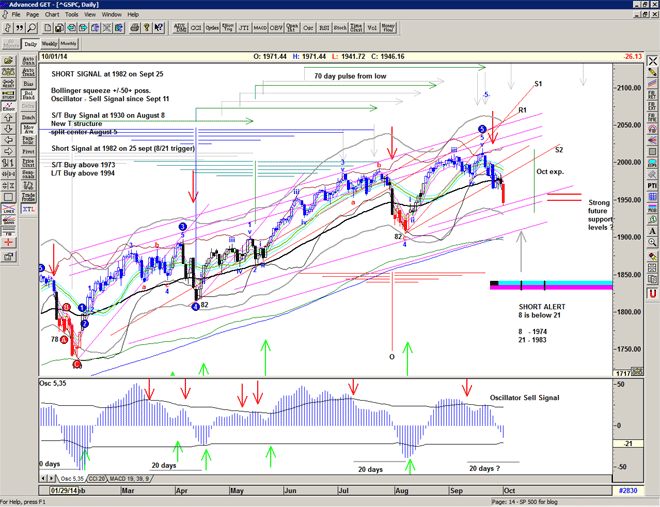
The Blue T structure certainly does seem to be working out, in which case expect to see a few days of weakness, perhaps a test of the 55 at about 1975 and S2 in the low 1970s.
And then an attempt at a rally into October 1/2
Market starting to look a bit weaker now, but this ol lady aint done just yet
(maybe soon though)