Swing pretty girl, Swing

She is an imaginary girl, A fiction
I am a dog on a chain, A prisoner
When I see her walk To and Fro
My teeth grope on
All reason goes
Swing pretty girl, Swing
It ain't real anyway
Fields so blue, All drenched in red
Clouds up in the sun, I feel so dead

Imaginary Girl, David Lynch, 2007

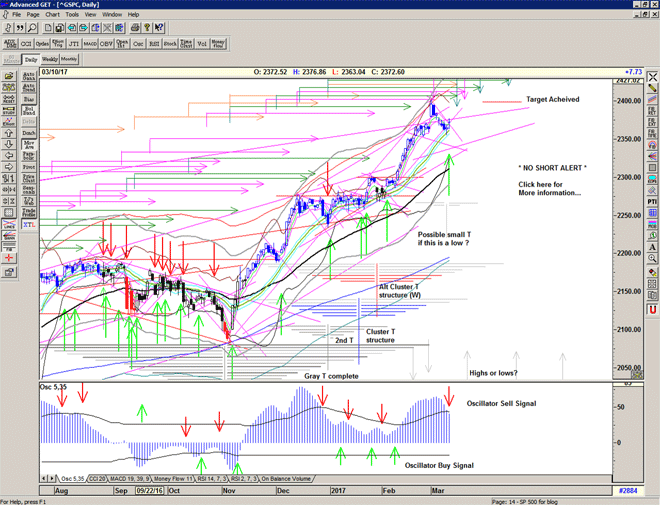
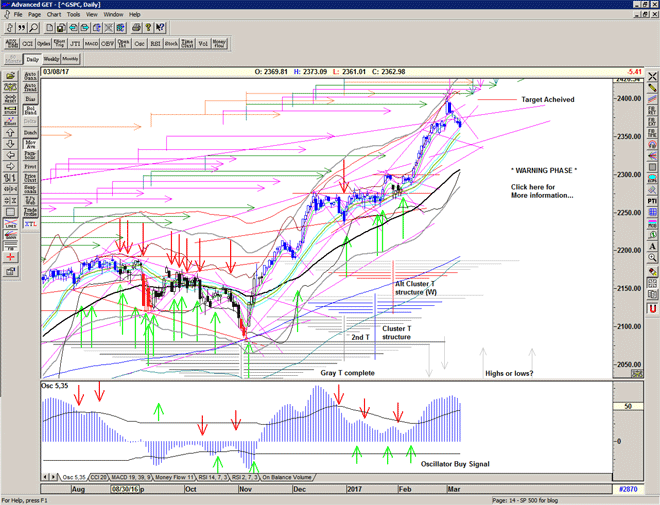
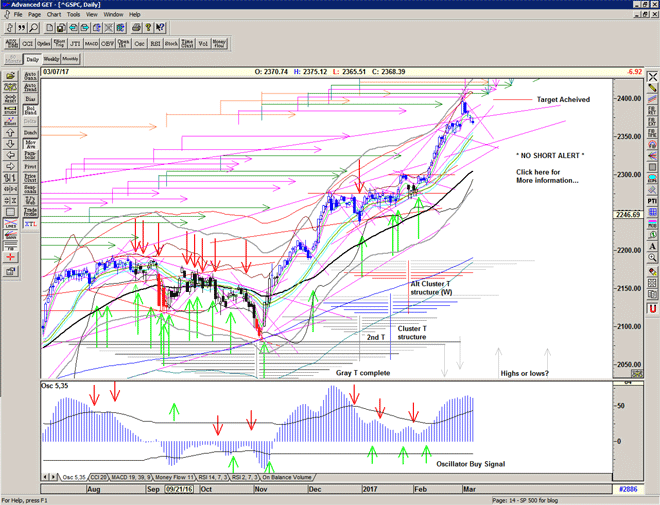
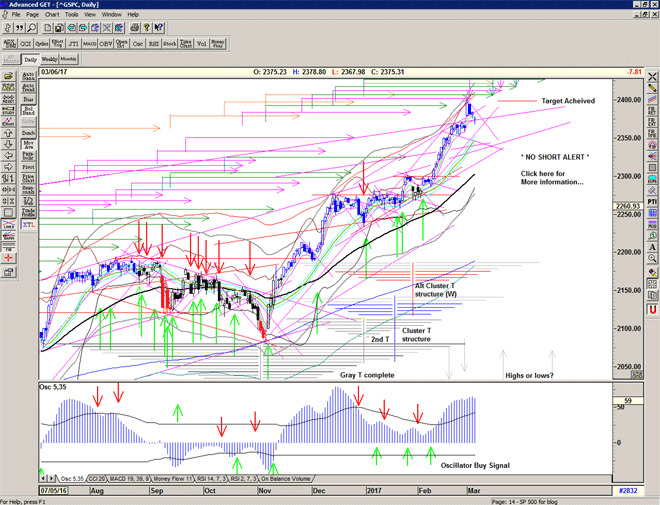
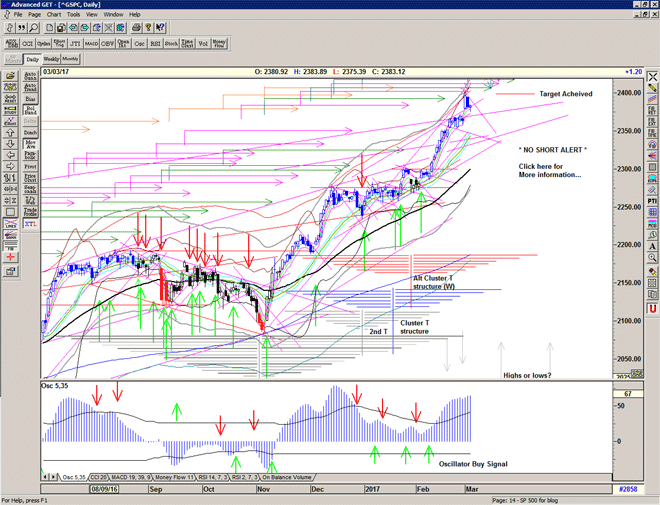
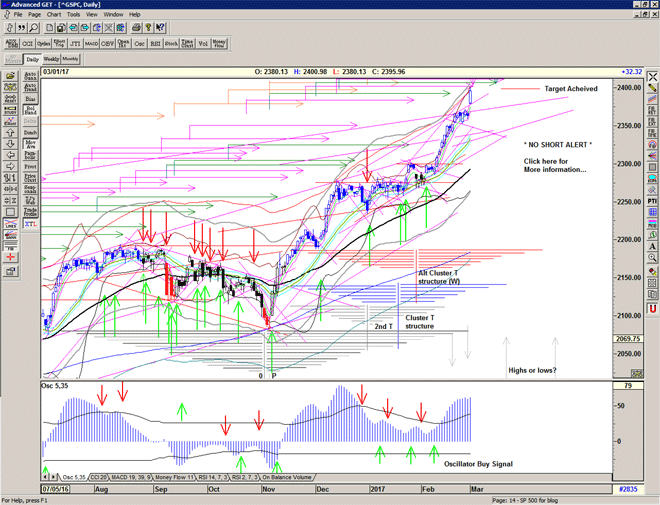
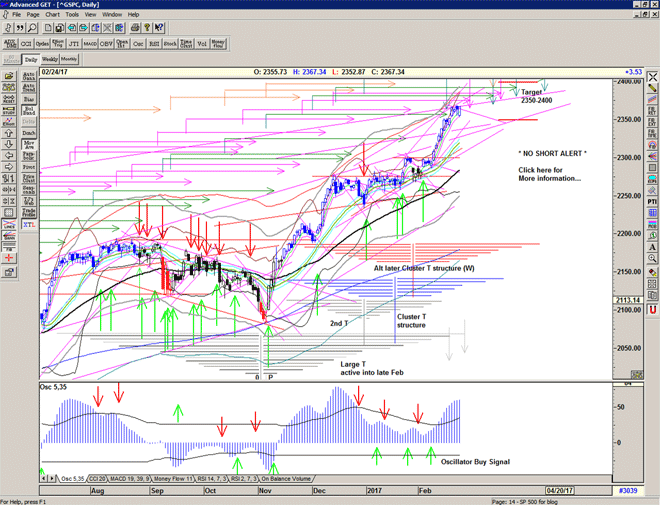
Another grind higher, feels familiar huh?
T volume oscillator recovers somewhat and back close to zero

Is that a small megaphone pattern forming at the highs, I wonder… see if we come down and test the lower line in a few days or so.
Otherwise move along please, nothing to see here, bulls still buying the dips…

Chart of S&P 500 for 28 February 2017

Be prepared: To receive detailed daily analysis, guidance and the updated daily Buy / Sell trigger levels being generated by the system before the market opens, and intraday alerts when appropriate, please become a Member and Sign up for Alerts & Observations – includes access to Members Area and the Explanatory Notes which explain how this system works.

Disclaimer: This is the diary of a personal trading system, its methodology and the signals that it is producing. You are welcome to follow along but please understand that the information presented here is for educational purposes only. No recommendations are being made to buy, or sell stocks, options or futures contracts. Please consult your own financial advisor before making any investment decisions.


Feel the Heat

Don't let yourself get attached to anything you are not willing to walk out on in 30 seconds flat if you feel the heat around the corner.
Heat, 1995, Dir: Michael Mann

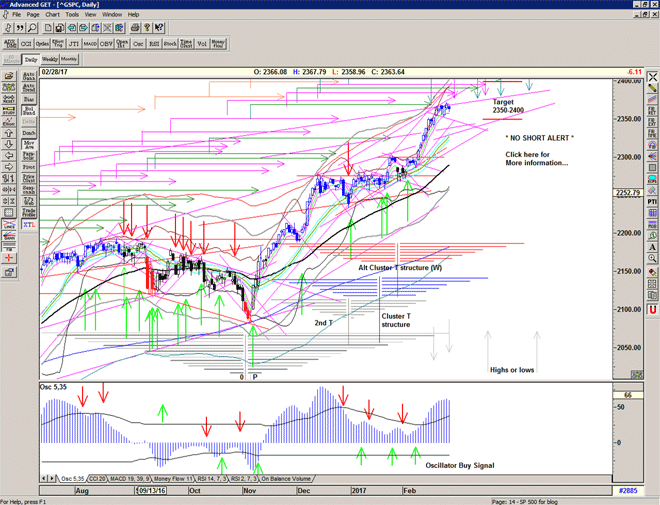
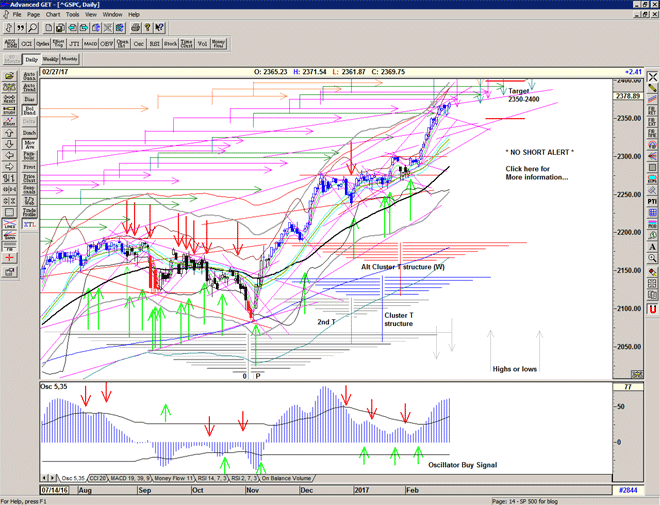
Market heats up and the Bulls take control again in late afternoon trade to close the week in style, and remind us that this is a bull market, baby…

Expect the choppy and toppy grind away higher to continue until we get a cover signal.

We have an important peak projection for a high scheduled for 28 February inline with the end of the Large gray Election low T structure (+ possibly 1-2 days because the oscillator low is 2 days prior to the price low, and we have seen this reflected at previous peaks in the T structure).

We also have an important Echo high sheduled for 2 March.

Chart of S&P500 for 27 February 2017

Be prepared: To receive detailed daily analysis, guidance and the updated daily Buy / Sell trigger levels being generated by the system before the market opens, and intraday alerts when appropriate, please become a Member and Sign up for Alerts & Observations – includes access to Members Area and the Explanatory Notes which explain how this system works.

Disclaimer: This is the diary of a personal trading system, its methodology and the signals that it is producing. You are welcome to follow along but please understand that the information presented here is for educational purposes only. No recommendations are being made to buy, or sell stocks, options or futures contracts. Please consult your own financial advisor before making any investment decisions.


Move along now

Pop and drop, and a Long probe down to have a look at 2355 before returning to the highs.
Nothing going on here, move along now, please…

We are building a small flag at the highs, possible slight descending line.

T volume oscillator turns neutral – a potential warning.

Chart of S&P500 for 23 February 2017

Be prepared: To receive detailed daily analysis, guidance and the updated daily Buy / Sell trigger levels being generated by the system before the market opens, and intraday alerts when appropriate, please become a Member and Sign up for Alerts & Observations – includes access to Members Area and the Explanatory Notes which explain how this system works.

Disclaimer: This is the diary of a personal trading system, its methodology and the signals that it is producing. You are welcome to follow along but please understand that the information presented here is for educational purposes only. No recommendations are being made to buy, or sell stocks, options or futures contracts. Please consult your own financial advisor before making any investment decisions.


A bit giddy

A rather mute reaction to the Fed mention of a rate increase, probably already priced in anyways, and a much needed rest with an inside day. I can see for miles and miles and I'm feeling a bit giddy.

Some consolidation needed, before a decision can be made whether to go a bit higher, or whether to retrace.
Lots of disbelievers in this recent rally – just what Mr Market likes – to confuse the majority – and this will provide plenty of fuel for further advances in due course…

Chart of S&P500 for 23 February 2017

Be prepared: To receive detailed daily analysis, guidance and the updated daily Buy / Sell trigger levels being generated by the system before the market opens, and intraday alerts when appropriate, please become a Member and Sign up for Alerts & Observations – includes access to Members Area and the Explanatory Notes which explain how this system works.

Disclaimer: This is the diary of a personal trading system, its methodology and the signals that it is producing. You are welcome to follow along but please understand that the information presented here is for educational purposes only. No recommendations are being made to buy, or sell stocks, options or futures contracts. Please consult your own financial advisor before making any investment decisions.


I Can See for Miles

I know you've deceived me, now here's a surprise
I know that you have 'cause there's magic in my eyes
I can see for miles and miles and miles and miles and miles
Oh yeah
Pete Townshend, (The Who), I Can See for Miles, 1967

Mr Market makes another interesting move up to an important line, and from here (at 2366) we can look back to a rising line from the late February 2015 peak – an important turn.

The T volume oscillator responds and strengthens indicating strong support for the gap and go and suggesting continued higher prices or at the very least a consolidation at these levels.

Chart of S&P500 for 22 February 2017

Be prepared: To receive detailed daily analysis, guidance and the updated daily Buy / Sell trigger levels being generated by the system before the market opens, and intraday alerts when appropriate, please become a Member and Sign up for Alerts & Observations – includes access to Members Area and the Explanatory Notes which explain how this system works.

Disclaimer: This is the diary of a personal trading system, its methodology and the signals that it is producing. You are welcome to follow along but please understand that the information presented here is for educational purposes only. No recommendations are being made to buy, or sell stocks, options or futures contracts. Please consult your own financial advisor before making any investment decisions.


Ex Presidents

Fear causes hesitation, and hesitation will cause your worst fears to come true.

Point Break, 1991 Dir: Kathryn Bigelow

Bulls bought the early expiration weakness and took the market back up for the logical pin at the recent highs.
Still very much on a Buy Signal and any dips are to be seen as buying opportunities.

The next target is the final arm of the Large T structure which should coincide with the Echo high at the end of the month as well as the first major arm of the alternative later cluster T structure.

Perhaps we can reach out to 2370 before any major pullback in the index. Obviously this is getting somewhat extended and so we will keep an eye on the T volume oscillator for hints of weakness and the beginning of a consolidation period.

Chart of S&P 500 for 20 February 2017

Be prepared: To receive detailed daily analysis, guidance and the updated daily Buy / Sell trigger levels being generated by the system before the market opens, and intraday alerts when appropriate, please become a Member and Sign up for Alerts & Observations – includes access to Members Area and the Explanatory Notes which explain how this system works.

Disclaimer: This is the diary of a personal trading system, its methodology and the signals that it is producing. You are welcome to follow along but please understand that the information presented here is for educational purposes only. No recommendations are being made to buy, or sell stocks, options or futures contracts. Please consult your own financial advisor before making any investment decisions.


February Expiration

Market takes a breather as we move into February expiration and look forward to President's Day.
A bearish tease with the 2240 level, and bulls back in control in afternoon trade.
That looks to me like the pulse high doing its thing…

The next test is to negociate the penultimate arm of the Large (Election low) T structure today – this arm extends back to the price peak on 20 July 2016, the final arm extends back to the oscillator peak on 12 July 2016.

Expect the usual expiration tussle as the market resets for March, and a logical closure pin would be right at the current highs with a predominance of SPY calls at the 235 mark.

There are quite a few sell signals flashing – indicating that the rally is under threat and that we may have a pullback from this level, perhaps prior to the next run up.

But remember that this market has punished the bears repeatedly, and if too many think this is the top they will be rewarded with failure yet again.

Chart of S&P 500 for 17 February 2017

Be prepared: To receive detailed daily analysis, guidance and the updated daily Buy / Sell trigger levels being generated by the system before the market opens, and intraday alerts when appropriate, please become a Member and Sign up for Alerts & Observations – includes access to Members Area and the Explanatory Notes which explain how this system works.

Disclaimer: This is the diary of a personal trading system, its methodology and the signals that it is producing. You are welcome to follow along but please understand that the information presented here is for educational purposes only. No recommendations are being made to buy, or sell stocks, options or futures contracts. Please consult your own financial advisor before making any investment decisions.


Afraid to See

What if everything around you
Isn't quite as it seems
What if all the world you used to know
Is an elaborate dream?
And if you look at your reflection
Is that all you want it to be?
What if you could look right through the cracks
Would you find yourself – find yourself afraid to see?

Trent Reznor (Nine Inch Nails – Right Where it Belongs, from 'With Teeth', 2005)

The market seems unstoppable as it heads into an important pulse high scheduled for today, and continues into the Endgame of the Large 'Trump' T structure. Notice the linearity of the expected Endgame move which was first discussed in the Free Report on 29 January 'Are We There Yet?'

*a Pulse High is one of my proprietary observations that relates to the current bull market's behaviour – read more about this and other important tools in my Explanatory Notes which is available to all of my Members.

Chart of S&P 500 for 16 February 2017

Be prepared: To receive detailed daily analysis, guidance and the updated daily Buy / Sell trigger levels being generated by the system before the market opens, and intraday alerts when appropriate, please become a Member and Sign up for Alerts & Observations – includes access to Members Area and the Explanatory Notes which explain how this system works.

Disclaimer: This is the diary of a personal trading system, its methodology and the signals that it is producing. You are welcome to follow along but please understand that the information presented here is for educational purposes only. No recommendations are being made to buy, or sell stocks, options or futures contracts. Please consult your own financial advisor before making any investment decisions.


Double Tap

Ideas are like fish. If you want to catch little fish, you can stay in the shallow water.
But if you want to catch the big fish, you’ve got to go deeper.
Down deep, the fish are more powerful and more pure.They’re huge and abstract. And they’re very beautiful.

David Lynch, Catching the Big Fish: Meditation, Consciousness, and Creativity

Whilst observing the additional strength in this market, I have found it fascinating to consider its source.

As you can see from the previous posts I have discussed the appearance of what I call a cluster T structure – a normal T structure is centred over a low in the market but a cluster T structure is centred over a series of lows, and the market gains considerable internal power from a series of lows that do not release to the downside, but release to the upside instead. Call it short covering if you like.

It seems clear that the market has been re-cycling its energy, whilst also continuing to rise – an interesting phenomenon in itself.

Whilst trying to assess where the turn in the market might have been, I am looking at the T volume oscillator for clues, because this will assist in projecting the future highs. However it is also important to compare price action.

It is obvious to me that the market is now using the cash-build up that was produced in the December and January period and that in effect a new T structure has emerged projecting into late March. Because there is no obvious low, the question is where does one place the centre for this new structure?

The blue Cluster T structure drawn below centres on January 19 – the final low of the flat period before the market bounces higher, but I have also drawn an alternative (in red) that is centred at 30 January because this is the final oscillator low before the recent push higher.

Interestingly the action at 30 January into 2nd February is like a series of double taps, and the oscillator makes a W pattern – a signature T Theory pattern for a low.

The market has been building the power that is now being revealed… and it has some way to go.

Chart of S&P 500 for 15 February 2017

Be prepared: To receive detailed daily analysis, guidance and the updated daily Buy / Sell trigger levels being generated by the system before the market opens, and intraday alerts when appropriate, please become a Member and Sign up for Alerts & Observations – includes access to Members Area and the Explanatory Notes which explain how this system works.

Disclaimer: This is the diary of a personal trading system, its methodology and the signals that it is producing. You are welcome to follow along but please understand that the information presented here is for educational purposes only. No recommendations are being made to buy, or sell stocks, options or futures contracts. Please consult your own financial advisor before making any investment decisions.


Light that Beacon

Thus we find that … Love … is the ancient source of all our highest good. …
For Neither family, nor privilege, nor wealth, nor anything but Love can light that beacon which a man must steer by when he sets out to live the better life.
How shall I describe [love], but [as] that contempt for the vile, and emulation of the good, without neither cities nor citizens are capable of any great or noble work.

Plato, The Symposium, 178d

The T volume oscillator moves higher and above its previous high confirming the new provisionally placed cluster T structure. The placement of this is provisional because there are a number of possible placements – all of which could be correct to some degree.

The OSC oscillator moves above its upper band indicating strong upward momentum.

The total Put/Call ratio reaches a level associated with tops, but this is not reflected in the cumulative Arms index.

Relative Strength reaches levels associated with tops, and the Vix moves up with the market – usually a contrary indication but this may be due to Vix Futures expiration tomorrow.

Chart of S&P 500 for 14 February 2017

Be prepared: To receive detailed daily analysis, guidance and the updated daily Buy / Sell trigger levels being generated by the system before the market opens, and intraday alerts when appropriate, please become a Member and Sign up for Alerts & Observations – includes access to Members Area and the Explanatory Notes which explain how this system works.

Disclaimer: This is the diary of a personal trading system, its methodology and the signals that it is producing. You are welcome to follow along but please understand that the information presented here is for educational purposes only. No recommendations are being made to buy, or sell stocks, options or futures contracts. Please consult your own financial advisor before making any investment decisions.