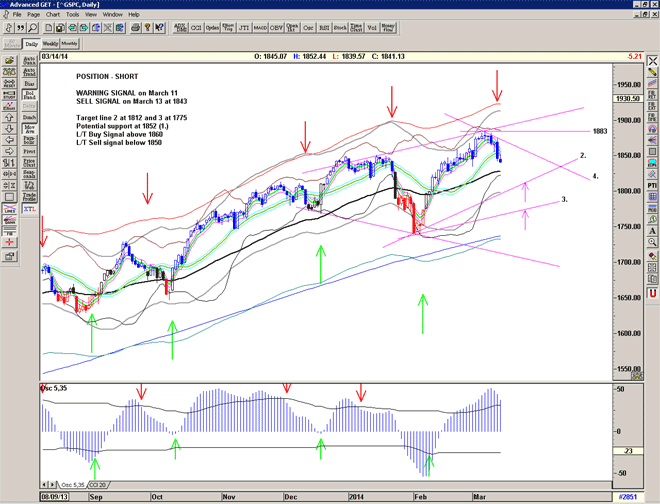
10 point spike down

An interesting probe down and found support in the vicinity of line 2. Potentially a bullish signal.

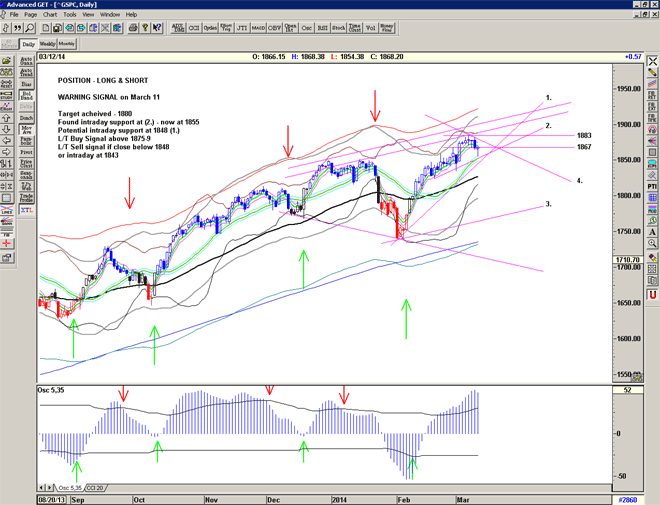
Stuck between 1855 and 1882 and may need some time to resolve direction.

Changing position to LONG and SHORT at the open unless futures indicate a drop of more than 10 points (currently +3).

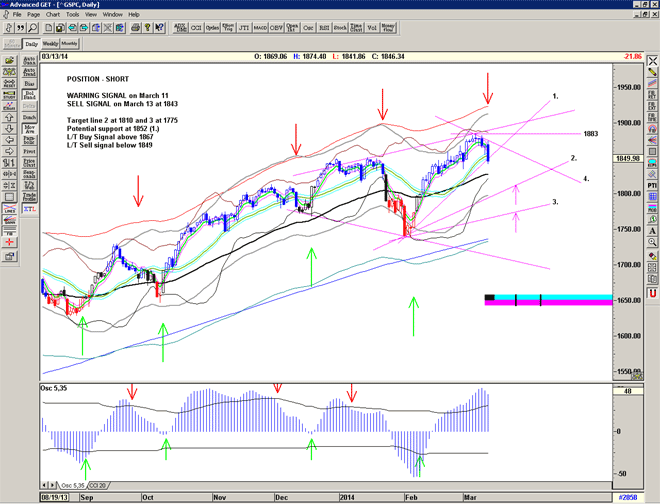
S&P500 chart for 13 March 2014

Blow off alert ?

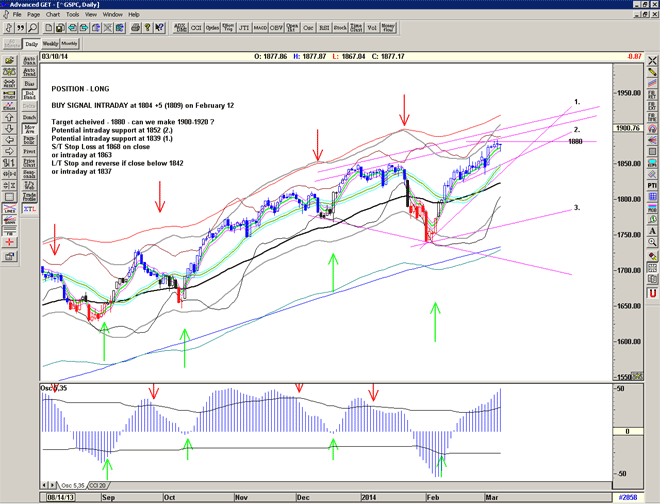
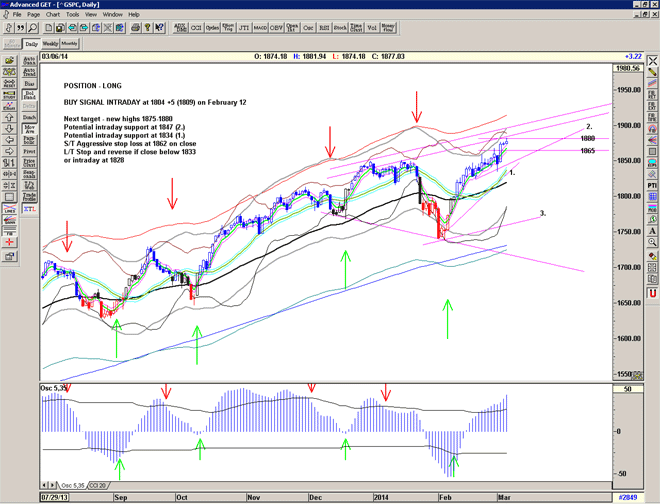
Having taken out 1865 yeserday we are now within reach of 1880-1885 which takes us back up to a long term resistance angle projected from the May 22, 2013 peak. Can we go higher? Of course. If we can move up thru 1885 then 1940-50 becomes a potential target.

5 March 2014

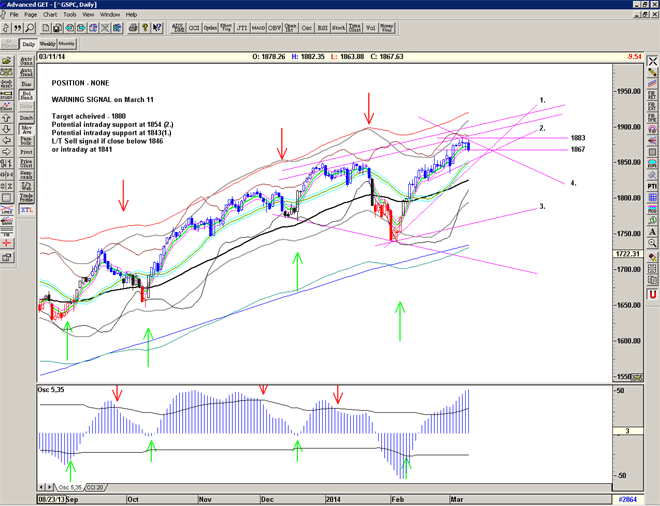
10 point spike

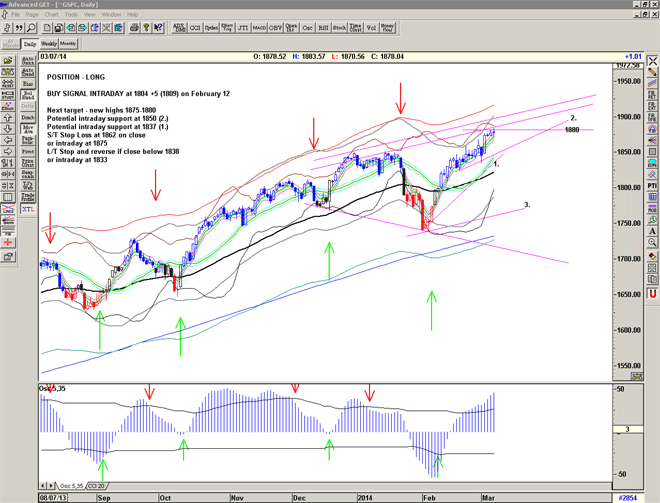
Survived the first major test of this recent bull move. Which way will we go – above 1867 or below 1835.

The oscillator has started to weaken, but we still have several lines of support before a short signal.

Starting to look a bit like May 22, 2013.

4 March 2014