He deals the cards as a meditation
And those he plays never suspect
He doesn't play for the money he wins
He don't play for respect
He deals the cards to find the answer
The sacred geometry of chance
The hidden law of a probable outcome
The numbers lead a dance
Sting, Shape of My Heart, 1993
(Gordon Sumner, Dominic Miller)
–
Welcome to the Trading the Line Free Report.
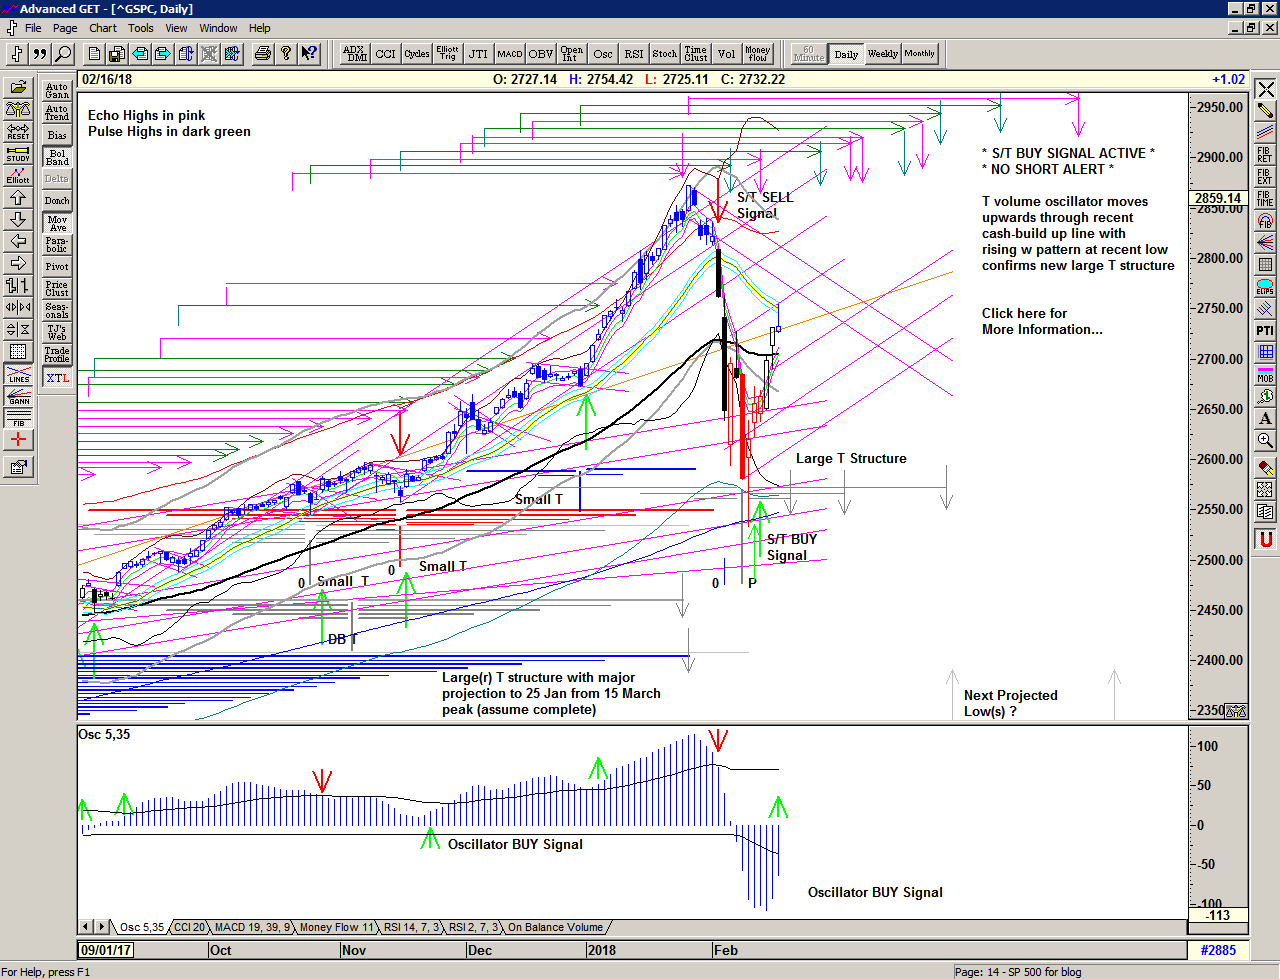
On 09 February the market tested the 200 day moving average at 2530 – a major sweet spot for the S&Ps in a bull market – and bounced, with a vengeance, in a short covering rally that will be remembered for some time.
The subsequent move upwards through 2661 triggered an S/T Buy Signal and the market continued higher into the Mid-channel on Friday to make a short-term peak at 2754 and this, finally, initiated some profit-taking prior to the extended weekend. It was quite a week.
Save the image to your desktop to view a larger version
Throughout this week the T volume oscillator has been rising upwards from a classic W pattern at a very low level – the signature of a new T structure being formed – and on 14 February it intersected the recent cash-build up line to confirm the prescence of a powerful T structure.
Strong momentum has also turned the OSc oscillator up from a deep low and makes a momentum Buy Signal.
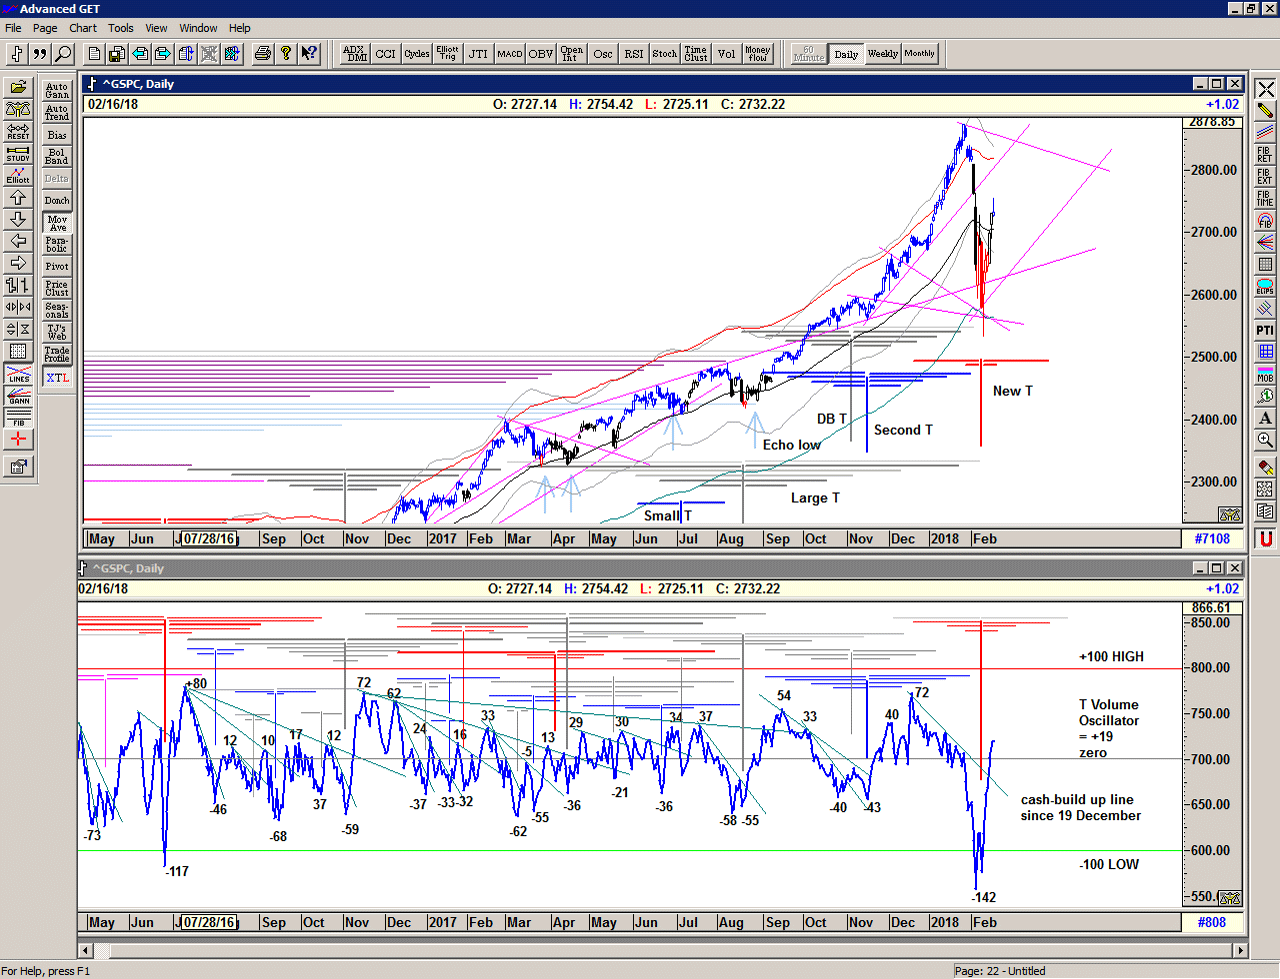
The profit-taking at 2750 now raises the question: is that the end of the move?
Let's look at the evidence:
Very strong breadth and momentum indicated by the T volume oscillator and OSc oscillator support the current new T structure's projection for highs in the days and weeks to come.
A recovery of the market above a number of key moving averages provides technical support, at least for now.
Volatility remains elevated, and could easily trigger another slide in price to re-test either rising support lines or to look for renewed support at lower price levels.
Save the image to your desktop to view a larger version
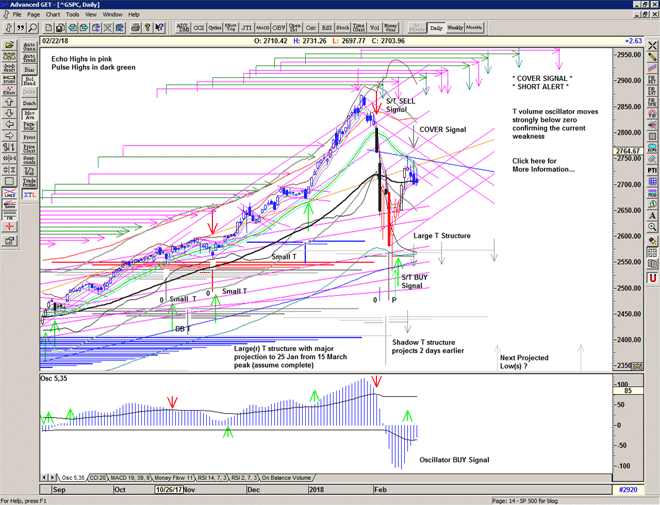
I am sometimes asked, what if you are wrong, what if the T structure isn't correct, what if the T structure turns 'bearish' and collapses?. And the answer is that you go with what you have before you, and let the market show you what is correct. This is why we use the S/T signalling system, and it will show you if we need to change our perspective.
The new T structure could collapse, and if it does we would look for a larger structure to develop in due course. We will continue to watch price and the oscillators for evidence. With volatility levels still very high, there is always the possibility of fast moves down, but likewise also fast moves back up.
Whether a pull-back into rising support is required, or whether Friday afternoon's selling is the beginning of another phase down is unclear. Watch the rising support lines and averages for confirmation of a continuation higher or the beginnings of another sell-down.
Price is currently still well above the S/T Buy Signal line and it may just be that the market got a little bit too far ahead of itself.
Save the image to your desktop to view a larger version
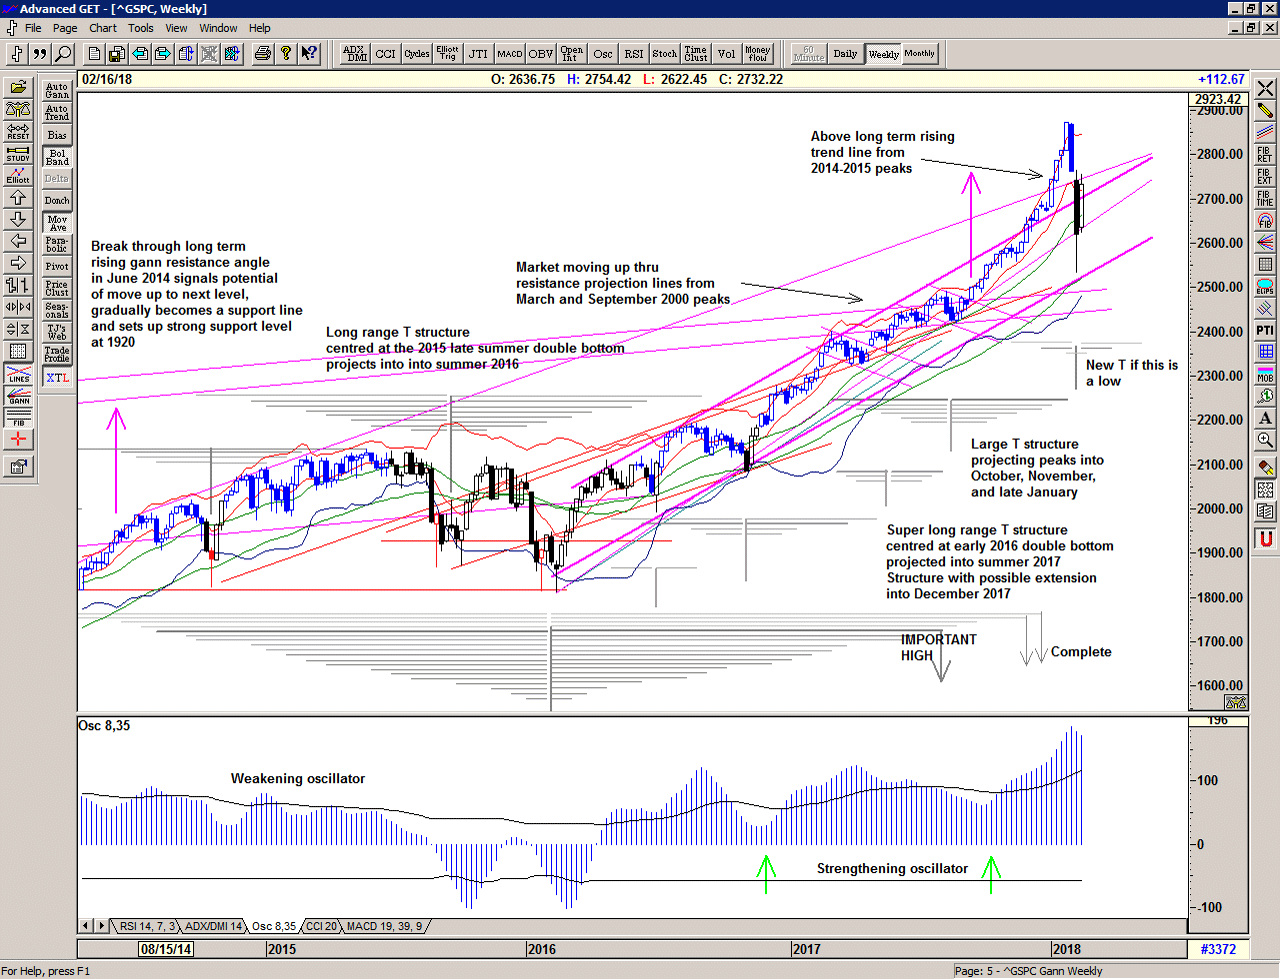
As we can see from the bigger picture on a weekly chart, price became unstable above the long-term rising trend line from the 2014-2015 peaks.
Two weeks down, and one week back up.
The rapid recovery from what could be described as the lower level of a rising channel puts the market back on that trend line and how the market performs moving forward will be revealing.
For now, the long spike down to 2530 looks like an anomaly, an over-reaction, perhaps exacerbated by an explosion in volatility which undoubtably has seriously harmed a lot of traders and investors and will have taken a lot of stops out in the process.
If the market continues higher many of those shaken out by the disturbing and excessive daily range will ultimately be obliged to re-enter at higher prices and this is what provides further fuel for the bull market – the fear of missing out.
If the market pukes yet again, we may be looking at a more extensive corrective period but there will be plentiful supply at lower prices – buyers and sellers – to build a larger more powerful T structure.
Regardless, for now, it seems that 2018 has brought with it some very exciting trading and a range that is far beyond recent experience. We should expect it to continue and trade accordingly. This is a Brave New World.
–
In the meantime, the simplicity of my proprietary price based S/T Signalling System continues to keep us on the correct side of the market, providing a timely Buy signal and a green light again, for now
If you would like to learn more about using the S/T Signalling System please get in touch.
–
Be prepared for what is coming next and trade with confidence:
To receive detailed daily analysis, guidance and the updated daily Buy / Sell trigger levels being generated by the Trading the Line system before the market opens, and intraday alerts when appropriate, please become a Member and Sign up for Alerts & Observations – includes access to Members Area and the Explanatory Notes for all of the concepts discussed.

 No Comments


