Welcome to the Trading the Line Special Report.
I do apologise, it has been rather a long time since my last free report.
On the edge of a recovery , maybe. Let's recap.
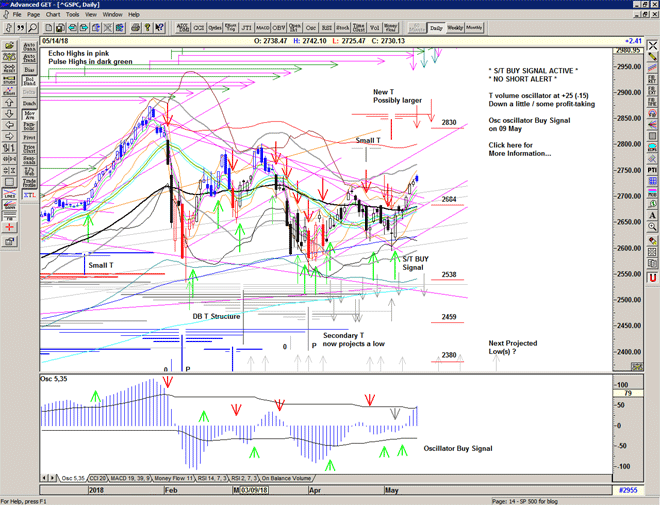
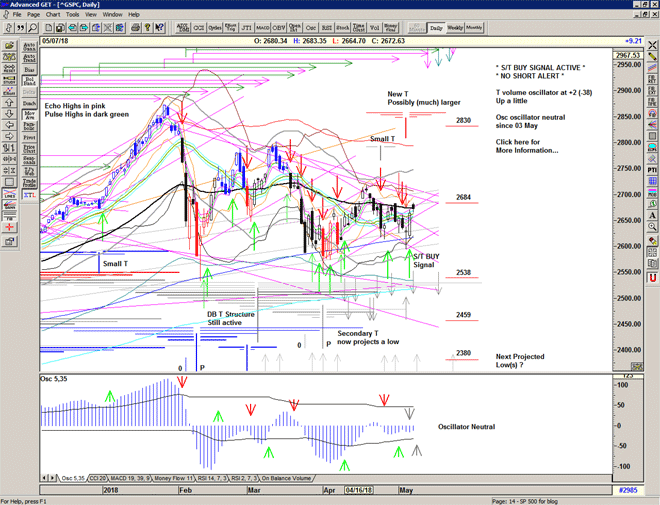
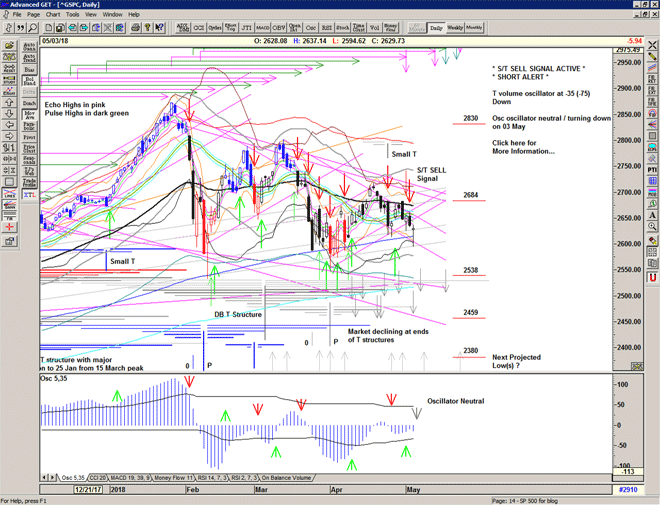
On 18 April the market succumbed to the declining resistance angle from the January and March highs and was forced to re-test the bounce from the April lows. It seems that each drop towards the 2600 level was met with an increasingly bullish response.
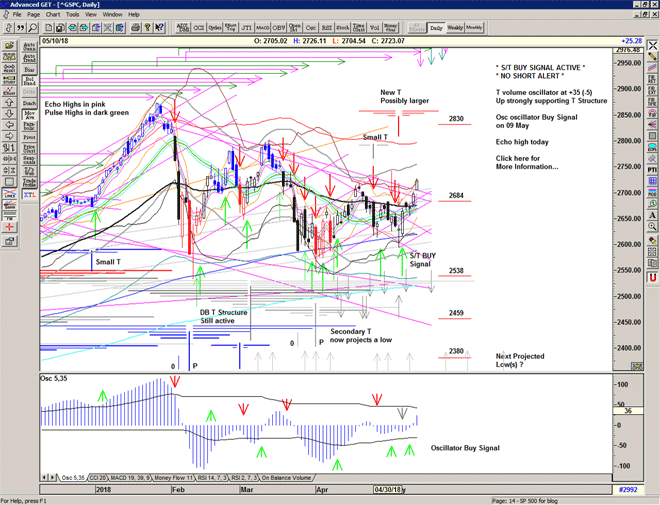
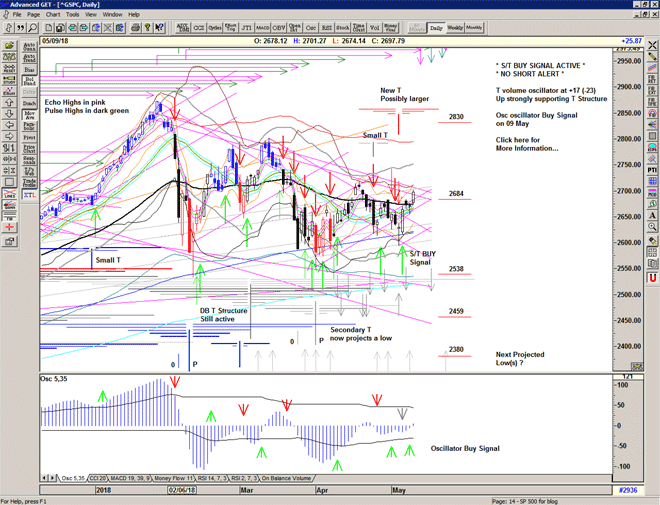
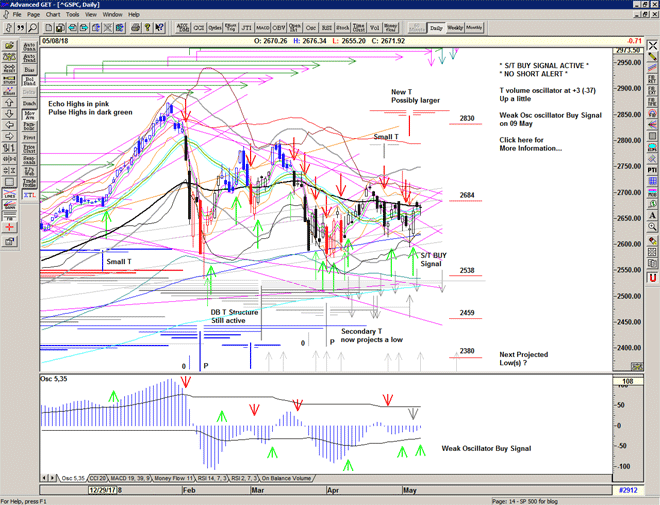
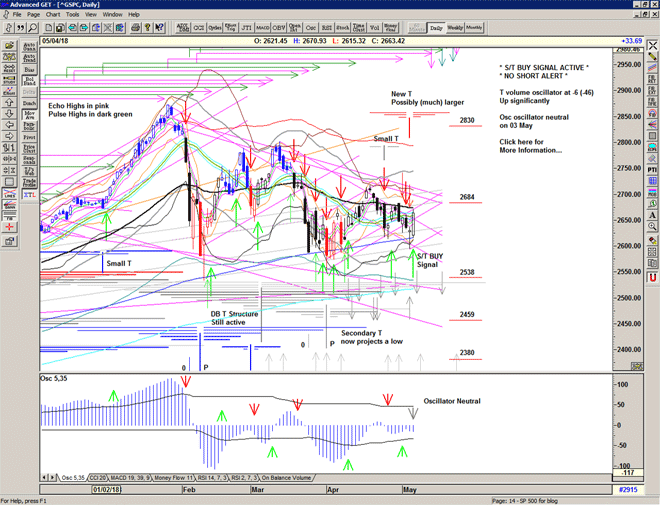
On the 04 May the market rapidly moved higher from a touch of the 200 day moving average and triggered an S/T Buy Signal at 2649 that is still active today some 75 points higher.
The S/T system is my proprietary price based system that requires the market to prove itself by moving beyond a particular level. The system then runs a cover stop level under the market until price performance deteriorates significantly. This system does not capture the exact turns in the market but captures the meat of the moves. It has performed particularly well under the stresses of the recent volatile market, keeping us informed of the general direction of the market.
The thrust on 04 May provided an early warning of a change in the market structure as the T volume oscillator – an indicator that descibes the market's internal rate of change of buying or selling pressure – moved upwards through the recent declining trend-line or cash-build up line and defined a new T structure. This new T structure utilises the selling since the most recent high on 18 April and projects the next highs today, on the 14 May and a more important high on 18 May, with the possibility of further waves beyond.
So, as the market makes a relative new high and hints at the possibility of further recovery, the question on every trader's mind is – is this just a bounce before the bearish action continues, or has the market finally returned to its previous calm bullish discovery of new all time highs.
Let's take a look.
Save the image to your desktop to view a larger version
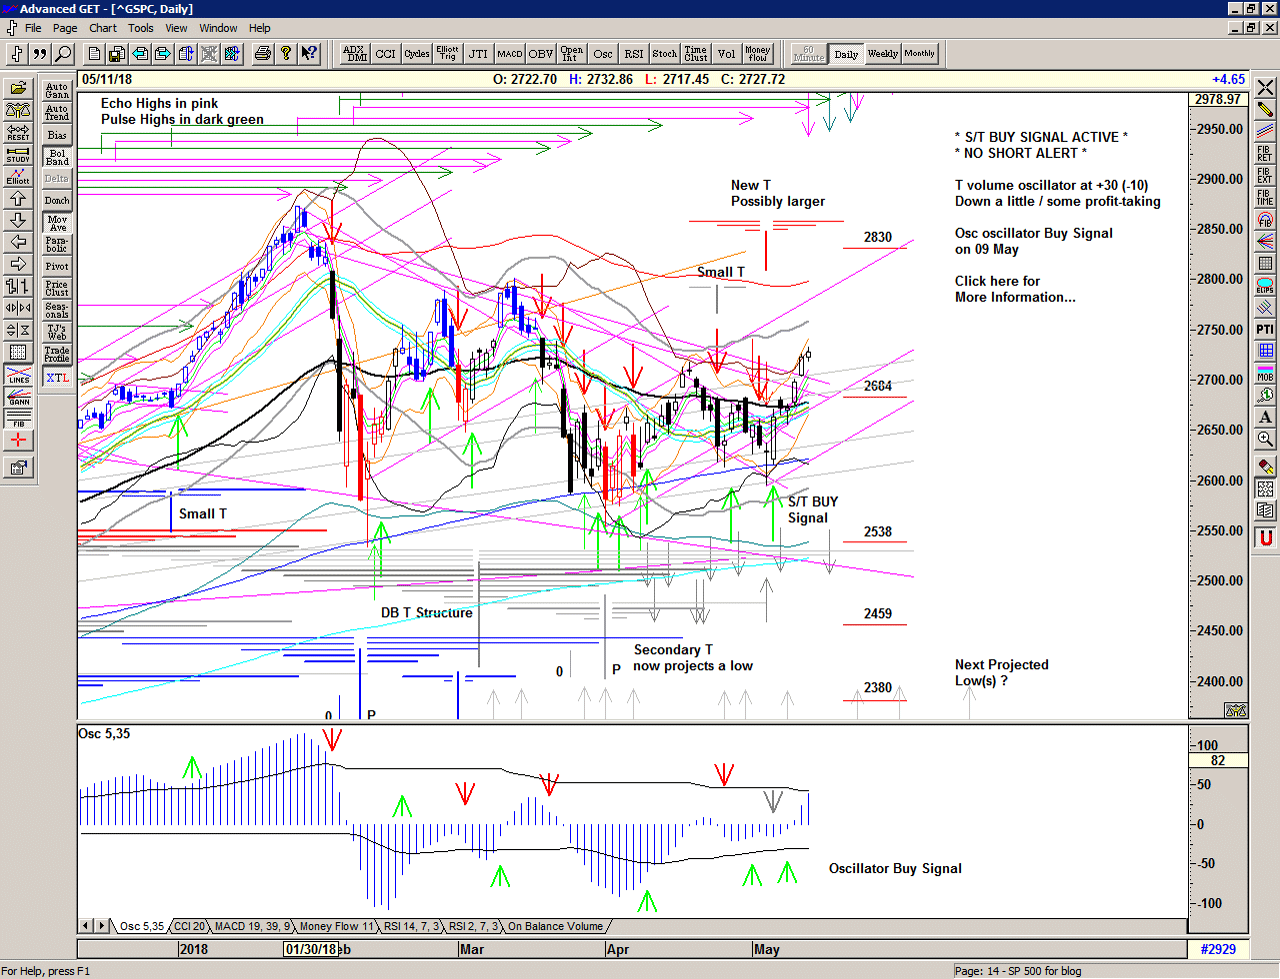
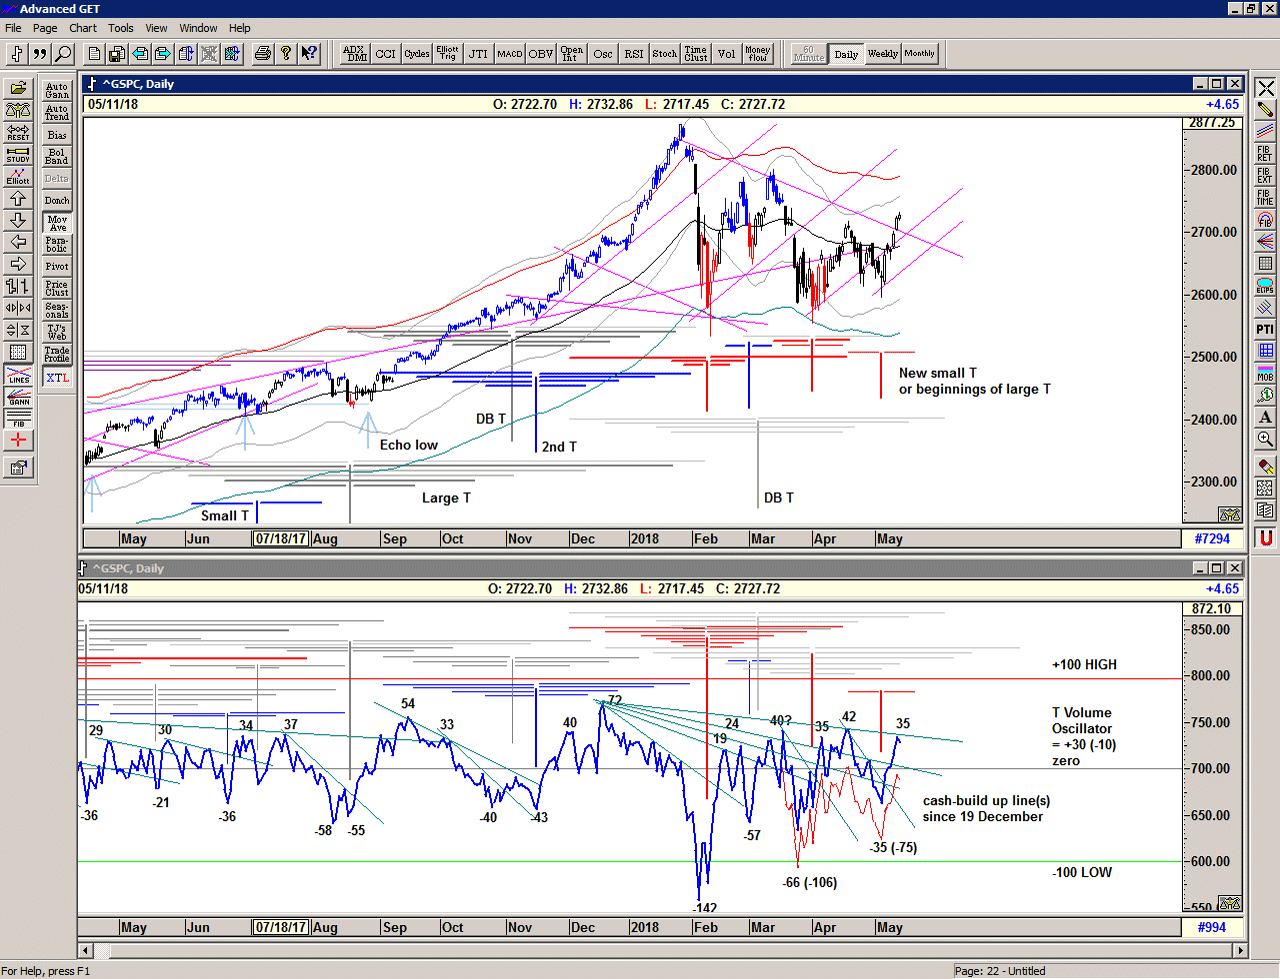
The market has moved up through and beyond the declining angles from the January highs, and we can see that the oscillators are displaying relatively bullish behaviour at the most recent low in comparioson to the previous lows, suggesting that the bearish pressure has been steadily reducing.
The Osc oscillator in the chart above is a momentum indicator which of course lags the market but is now moving up strongly, suggesting that there is strong upward momentum behind this move.
The T volume oscillator in the chart below is an indication of overall buying or selling pressure as it measures the rate of change of advancing vs. declining stocks in the NYSE as a whole. The blue line is the readings as is, and the red line is an adjustment to take into account an anomaly that occured at March options expiration due to some very heavy buying back of hedges. Both versions look bullish, displaying a series of higher lows and a general cash-build up since the oscillator high on 19 December.
Save the image to your desktop to view a larger version
The DB (double bottom) structure centred inbetween the February and April lows has generally been bearish, projecting a series of lower highs. At some point these type of structures collapse into a final low or morph into a larger structure. The most recent projection for a high from the DB structure was 07 May and as the market is now moving above that low, we can see that the DB structure is turning bullish or losing its negative influence.
Save the image to your desktop to view a larger version
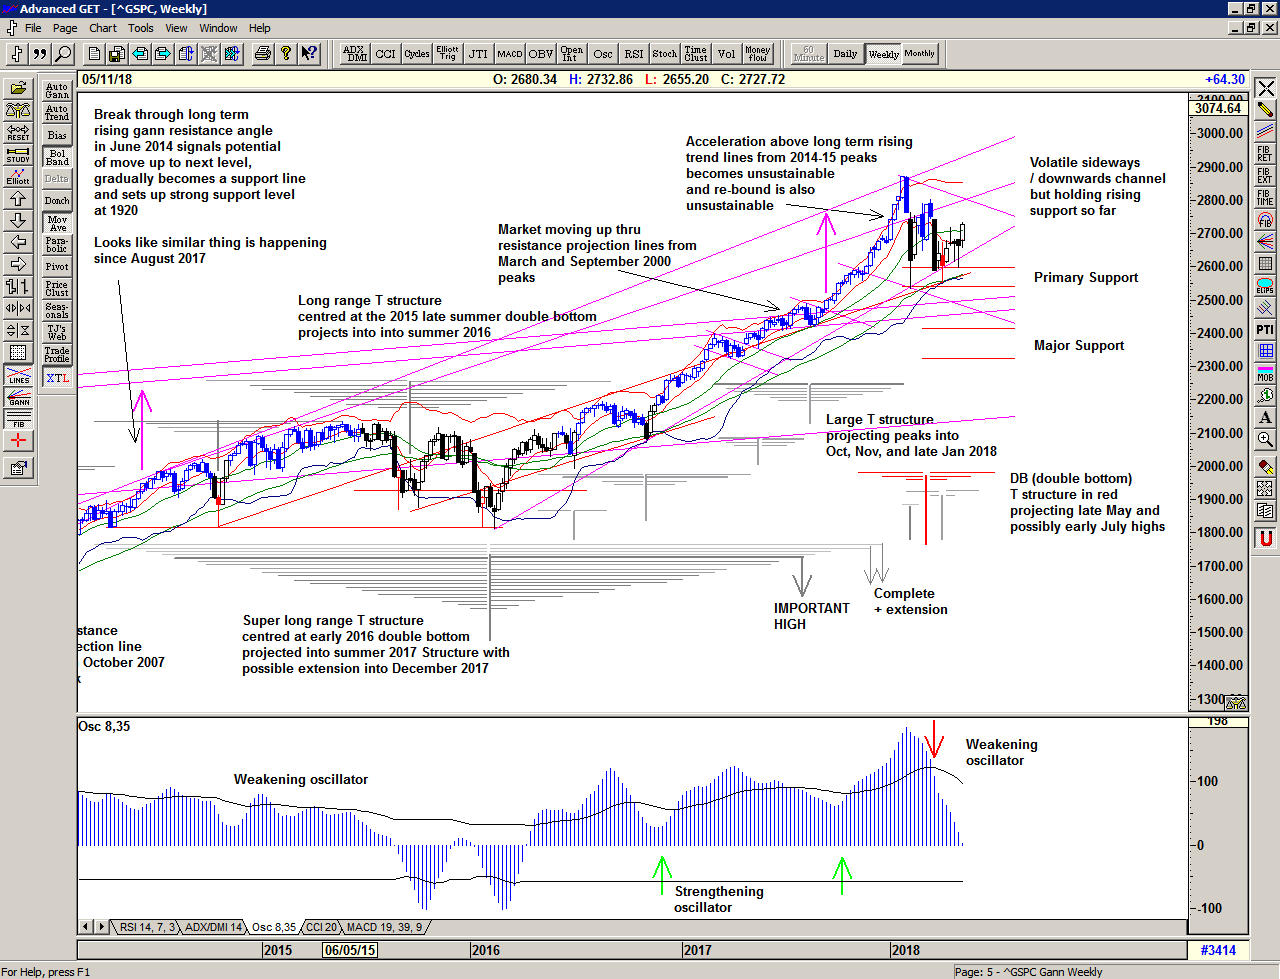
The weekly chart above shows that the market is still holding a long-term trend line rising from the February 2016 low, as it continues to absorb and digest the breakaway move into the January 2018 high. For now, primary support is holding, with the possibility that a later re-test of the major support area may still be necessary.
I am still seeing some interesting comparisons between the 2015-2016 bearish phase and 2018 where the important breakaway move requires re-testing of earlier support lines to consolidate the market's advance, in effect the building of a large T structure. Notice also that important resistance still resides at about 2800 and may of course be the current target.
2018 continues to bring with it some very exciting trading and a range that is far beyond the experience of recent years. We should expect it to continue and trade accordingly. This is a Brave New World.
–
Regardless of whether the market can sustain its current advance or whether another, perhaps deeper, low is ahead of us, the simplicity of the proprietary price based S/T Signalling System continues to keep us on the correct side of the market, providing a timely Buy signal and a green light, for now.
If you would like to learn more about using the S/T Signalling System please get in touch.
–
Be prepared for whatever is coming next, and trade with confidence:
To receive detailed daily analysis, guidance and the updated daily Buy / Sell trigger levels being generated by the Trading the Line system before the market opens, and intraday alerts when appropriate, please become a Member and Sign up for Alerts & Observations – includes access to Members Area and the Explanatory Notes for all of the concepts discussed.
Disclaimer: This is the diary of a personal trading system, its methodology and the signals that it is producing. You are welcome to follow along but please understand that the information presented here is for educational purposes only. No recommendations are being made to buy, or sell stocks, options or futures contracts. Please consult your own financial advisor before making any investment decisions.

 No Comments