Walburga

The end of April and the beginning of the summer months.

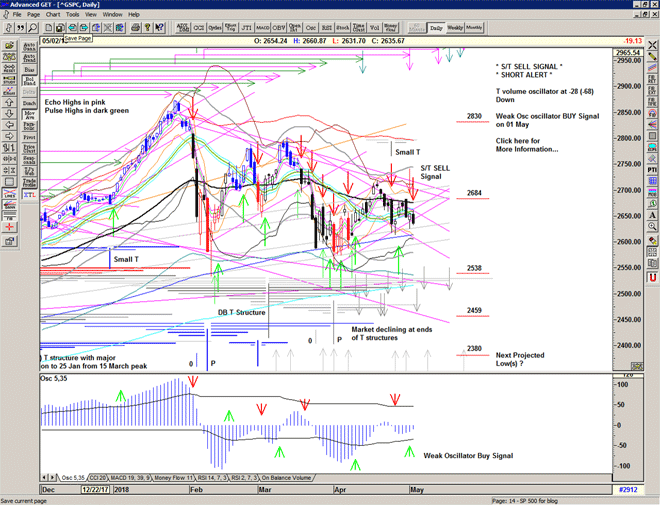
The open gap up is not held and the market looks back at 2659 for support. Consolidation at the highs and finding some resistance here.

Market in equivalence holding above support lines but just below an important major pivot level.

Still in a holding pattern and a move up from here would release a significant amount of energy. A move downwards from here would again re-focus the market on the recent lows and the possibility of a deeper low.

What happens next will be important.

Chart of S&P 500 for 30 April 2018

Be prepared for whatever is coming next, and trade with confidence:

To receive detailed daily analysis, guidance and the updated daily Buy / Sell trigger levels being generated by the Trading the Line system before the market opens, and intraday alerts when appropriate, please become a Member and Sign up for Alerts & Observations – includes access to Members Area and the Explanatory Notes for all of the concepts discussed.

Disclaimer: This is the diary of a personal trading system, its methodology and the signals that it is producing. You are welcome to follow along but please understand that the information presented here is for educational purposes only. No recommendations are being made to buy, or sell stocks, options or futures contracts. Please consult your own financial advisor before making any investment decisions.


Liberalis

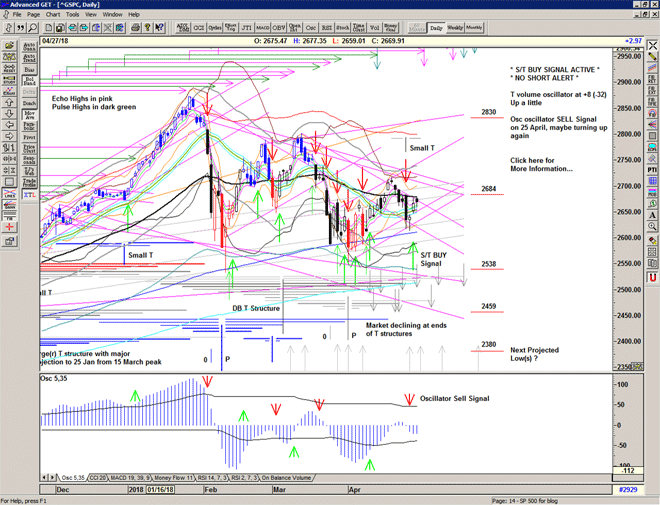
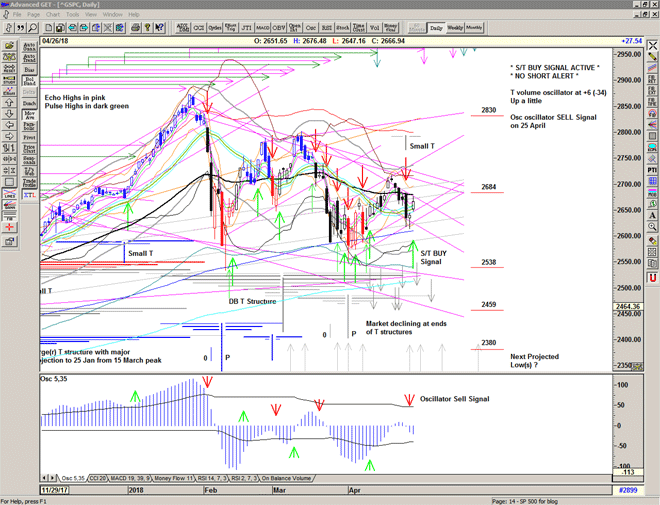
A strong bounce underway, with a gap and go day, pushing up through the Buy Signal level at 2662 and making a high on the day at 2676.

A dead cat bounce perhaps, and some residual projections for highs from the recent structures, the possibility of a small T centred on Tuesday's sell off, adn some end of month re-balancing.

Strength above 2680 would focus the market on challenging the recent high and weakness below 2640 would suggest more work to do below.

For now, a Buy Signal is active.

Chart of S&P 500 for 27 April 2018

Be prepared for whatever is coming next, and trade with confidence:

To receive detailed daily analysis, guidance and the updated daily Buy / Sell trigger levels being generated by the Trading the Line system before the market opens, and intraday alerts when appropriate, please become a Member and Sign up for Alerts & Observations – includes access to Members Area and the Explanatory Notes for all of the concepts discussed.

Disclaimer: This is the diary of a personal trading system, its methodology and the signals that it is producing. You are welcome to follow along but please understand that the information presented here is for educational purposes only. No recommendations are being made to buy, or sell stocks, options or futures contracts. Please consult your own financial advisor before making any investment decisions.


Object Shelter

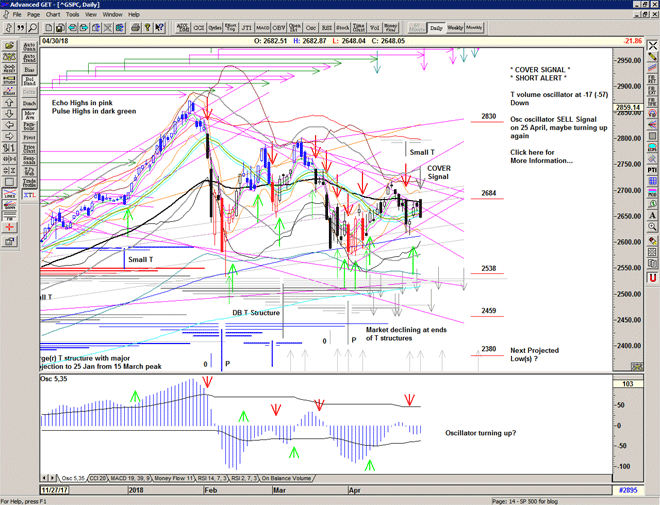
An early flush to 2612 is bought back up and the market continues to stabilise throughout the day.

Sell Signal still active below the current price, but with the 2 spikes down the market appears to be holding up above 2635, for now.

Although weakened by Wednesday's heavy selling there is the possibility of some residual projections for highs towards the end of the month, perhaps a dead cat bounce prior to a more significant move down.

Chart of S&P 500 for 26 April 2018

Be prepared for whatever is coming next, and trade with confidence:

To receive detailed daily analysis, guidance and the updated daily Buy / Sell trigger levels being generated by the Trading the Line system before the market opens, and intraday alerts when appropriate, please become a Member and Sign up for Alerts & Observations – includes access to Members Area and the Explanatory Notes for all of the concepts discussed.

Disclaimer: This is the diary of a personal trading system, its methodology and the signals that it is producing. You are welcome to follow along but please understand that the information presented here is for educational purposes only. No recommendations are being made to buy, or sell stocks, options or futures contracts. Please consult your own financial advisor before making any investment decisions.


Elbe

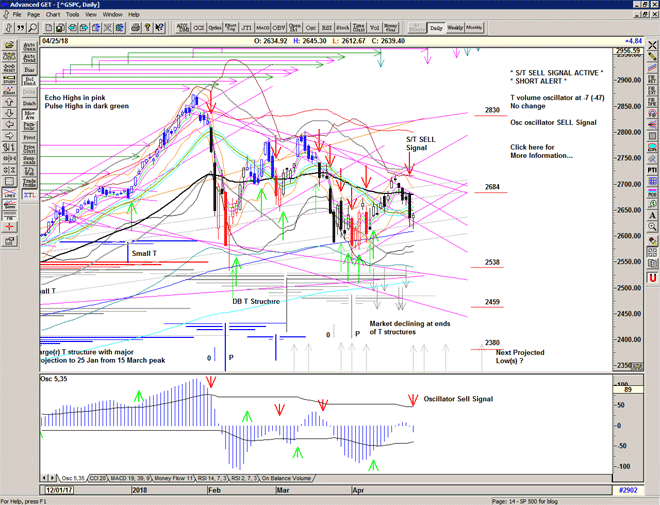
Overnight the market rises towards the Buy signal line and opens at the important 2680 level. Failure at this level and then subsequently also at 2660, initiates a sell sequence that ultimately finds the market 60 points lower, before a short-covering rally into the close.

An S/T Sell Signal is triggered at 2644, and a cover recommended at the or prior to the close as it is likely that the market will attempt to recover from the selling.

Yesterday's move down displays similarities with 02 February and 19 March with the market penetrating the Mid-channel in a decisive manner after a sequence which looks a bit like a megaphone – range expansion and dropping away.

On those 2 occasions we saw a bit of a bounce followed by a much deeper and significant low, presumably as the market resolves the problem that it is having with the current price level, and of course providing those with deep pockets the opportunity to buy at bargain prices.

And so, I suspect that we shall see some kind of bounce or recovery that those who didn't sell yesterday will sell into. Failure of that will trigger further selling, and then maybe we will see another move down to the lower extreme and to the pivot level at 2538.

The last few days selling comes at the recent projections for highs from the recent T structure and DB structure and the size of yesterday's move suggests that those structures are now complete and we should therefore look for a new structure to emerge.

Some strong target support lies in the 2510-2530 level and also in the 2530-2460 level, where the market may need to establish a deep low to form the next new large T structure.

Chart of S&P 500 for 25 April 2018

Be prepared for whatever is coming next, and trade with confidence:

To receive detailed daily analysis, guidance and the updated daily Buy / Sell trigger levels being generated by the Trading the Line system before the market opens, and intraday alerts when appropriate, please become a Member and Sign up for Alerts & Observations – includes access to Members Area and the Explanatory Notes for all of the concepts discussed.

Disclaimer: This is the diary of a personal trading system, its methodology and the signals that it is producing. You are welcome to follow along but please understand that the information presented here is for educational purposes only. No recommendations are being made to buy, or sell stocks, options or futures contracts. Please consult your own financial advisor before making any investment decisions.


S/T SELL Signal at 2644

This morning's gap up into the 2680 area found little interest as traders sold into the gap.

Some interest in the 2670 area gave way to more selling and triggered an S/T SELL Signal at 2644

On Sell Signals such as this one I recommend covering at or prior to the close.

Cover temporarily at 2634

Franck-Hertz

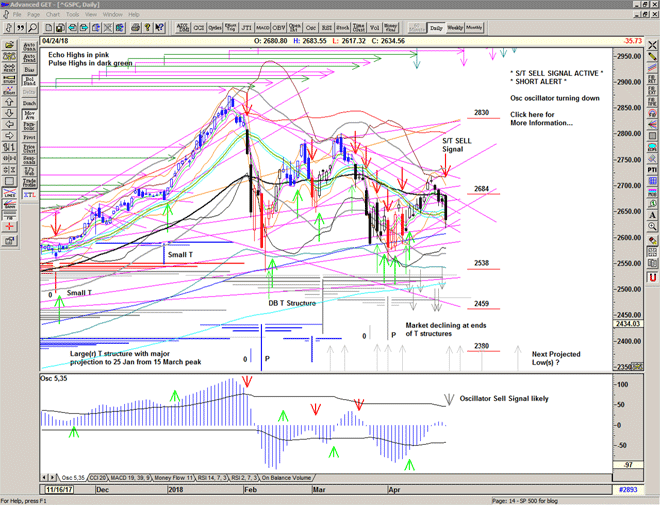
A re-test of the important 2683 level is rejected but the market finds some support at the previous low at 2660.

Market still very much responding to the declining angles, selling into strength, but looking for value at lower prices.

The Mid channel starts to turn up, and this could provide some support in the days to come.

Chart of S&P 500 for 24 April 2018

Be prepared for whatever is coming next, and trade with confidence:

To receive detailed daily analysis, guidance and the updated daily Buy / Sell trigger levels being generated by the Trading the Line system before the market opens, and intraday alerts when appropriate, please become a Member and Sign up for Alerts & Observations – includes access to Members Area and the Explanatory Notes for all of the concepts discussed.

Disclaimer: This is the diary of a personal trading system, its methodology and the signals that it is producing. You are welcome to follow along but please understand that the information presented here is for educational purposes only. No recommendations are being made to buy, or sell stocks, options or futures contracts. Please consult your own financial advisor before making any investment decisions.


George and the Dragon

I will not cease from Mental Fight,
Nor shall my Sword sleep in my hand:
Till we have built Jerusalem,
In Englands green and pleasant Land.

William Blake, Jerusalem, 1804

On Thursday the market showed support at 2380 and on Friday it gave way, triggering a 'Cover' signal as the market looks lower and there is more work to be done.

Strong penetration of this level (the 55 ema) again is a reminder of the previous weaknesses that led to the recent lows – on 05 February, 01 March and 19 March – and certainly brings with it the possibility of another deep(er) low ahead perhaps another re-test of the important 2530s support level, perhaps somewhat lower in due course.

A rapid recovery would signal a different series of events and perhaps another attempt at 2750+.

Lines in the sand…

Chart of S&P 500 for 23 April 2018

Be prepared for whatever is coming next, and trade with confidence:

To receive detailed daily analysis, guidance and the updated daily Buy / Sell trigger levels being generated by the Trading the Line system before the market opens, and intraday alerts when appropriate, please become a Member and Sign up for Alerts & Observations – includes access to Members Area and the Explanatory Notes for all of the concepts discussed.

Disclaimer: This is the diary of a personal trading system, its methodology and the signals that it is producing. You are welcome to follow along but please understand that the information presented here is for educational purposes only. No recommendations are being made to buy, or sell stocks, options or futures contracts. Please consult your own financial advisor before making any investment decisions.


Cover Signal at 2681

Market triggered a Cover Signal at 2681, dropped hard into the 2660s with a short covering rally into the close for good measure.

We shall await the next signal.

Chart of S&P 500 for 23 April 2018

Be prepared for whatever is coming next, and trade with confidence:

To receive detailed daily analysis, guidance and the updated daily Buy / Sell trigger levels being generated by the Trading the Line system before the market opens, and intraday alerts when appropriate, please become a Member and Sign up for Alerts & Observations – includes access to Members Area and the Explanatory Notes for all of the concepts discussed.

Disclaimer: This is the diary of a personal trading system, its methodology and the signals that it is producing. You are welcome to follow along but please understand that the information presented here is for educational purposes only. No recommendations are being made to buy, or sell stocks, options or futures contracts. Please consult your own financial advisor before making any investment decisions.


April expiration

A weak open and selling down into last week's gap and a bounce at 2682.

A re-test of the rising trend or the beginning of another leg down?

Chart of S&P 500 for 20 April 2018

Be prepared for whatever is coming next, and trade with confidence:

To receive detailed daily analysis, guidance and the updated daily Buy / Sell trigger levels being generated by the Trading the Line system before the market opens, and intraday alerts when appropriate, please become a Member and Sign up for Alerts & Observations – includes access to Members Area and the Explanatory Notes for all of the concepts discussed.

Disclaimer: This is the diary of a personal trading system, its methodology and the signals that it is producing. You are welcome to follow along but please understand that the information presented here is for educational purposes only. No recommendations are being made to buy, or sell stocks, options or futures contracts. Please consult your own financial advisor before making any investment decisions.