Wash away

Rain, rain, rain discard out the side of me
Disguising the side of me to wash the love away
Oh Joy, love, light recede it away of me
Recede it away of me the day I'd only say,
Oh saying so lone away
I'm giving the lie away…

Unkle Ft Gavin Clark, Wash the Love Away, 2010

The market pops up above the important 200 day moving average.

Recovery target achieved.

Chart of S&P 500 for 19 February 2019

Be prepared for whatever is coming next, and trade with confidence:

To receive detailed daily analysis, guidance and the updated daily Buy / Sell trigger levels being generated by the Trading the Line system before the market opens, and intraday alerts when appropriate, please become a Member and Sign up for Alerts & Observations – includes access to Members Area and the Explanatory Notes for all of the concepts discussed.

Disclaimer: This is the diary of a personal trading system, its methodology and the signals that it is producing. You are welcome to follow along but please understand that the information presented here is for educational purposes only. No recommendations are being made to buy, or sell stocks, options or futures contracts. Please consult your own financial advisor before making any investment decisions.


Washington

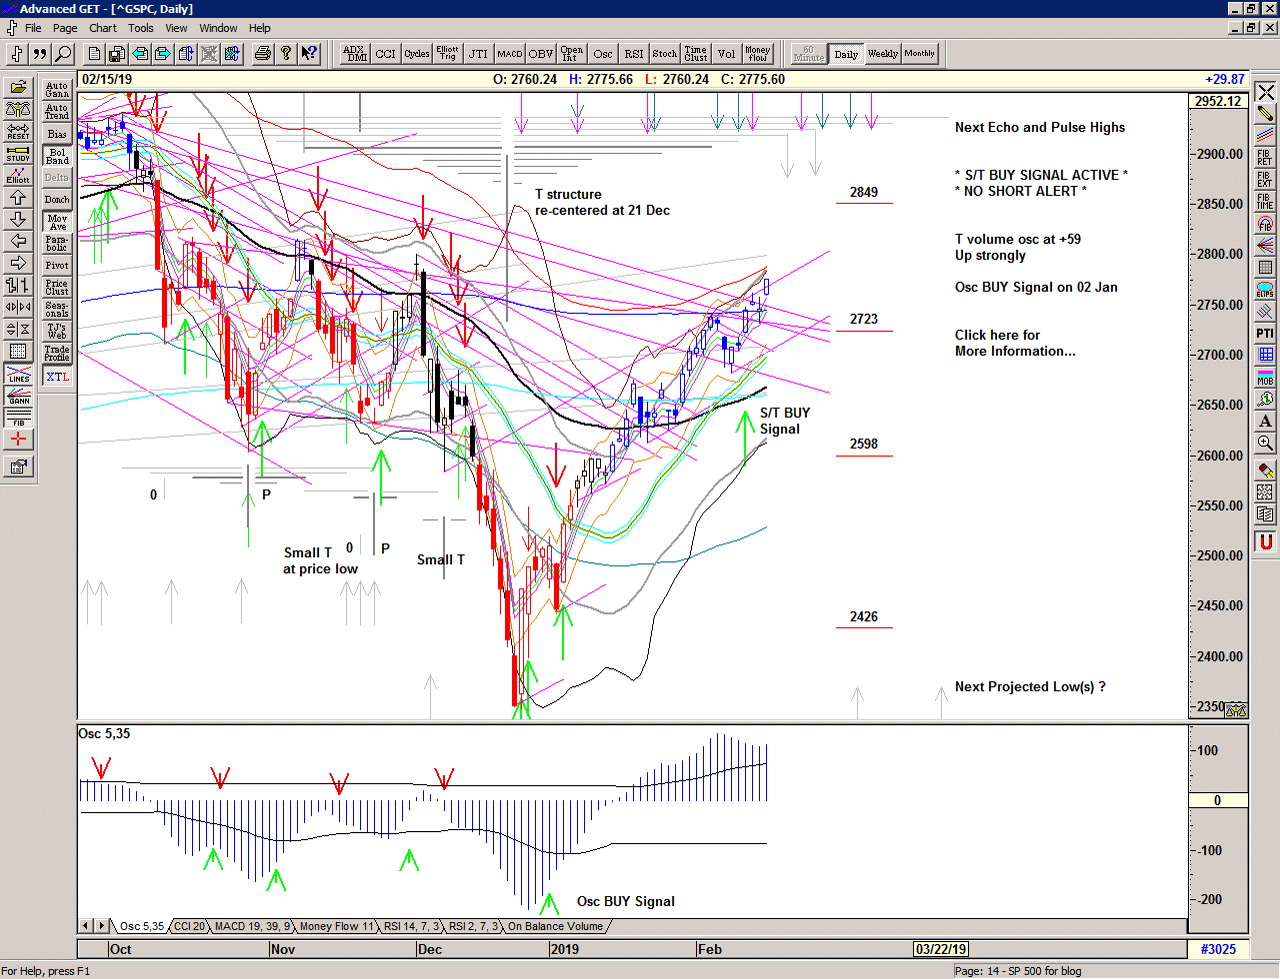
Since my last report the market has continued to surge higher with some stabilization at the 2600 level and again at the 2700 level. The drop on 07 February signalled to cover but the important 2680 level held firm and buying has pushed the market back up through the important target 2740 area with a continuation S/T Buy Signal confirmed on 12 February.

Daily chart of S&P 500 for 19 February 2019

Save the image to your desktop to view a larger version

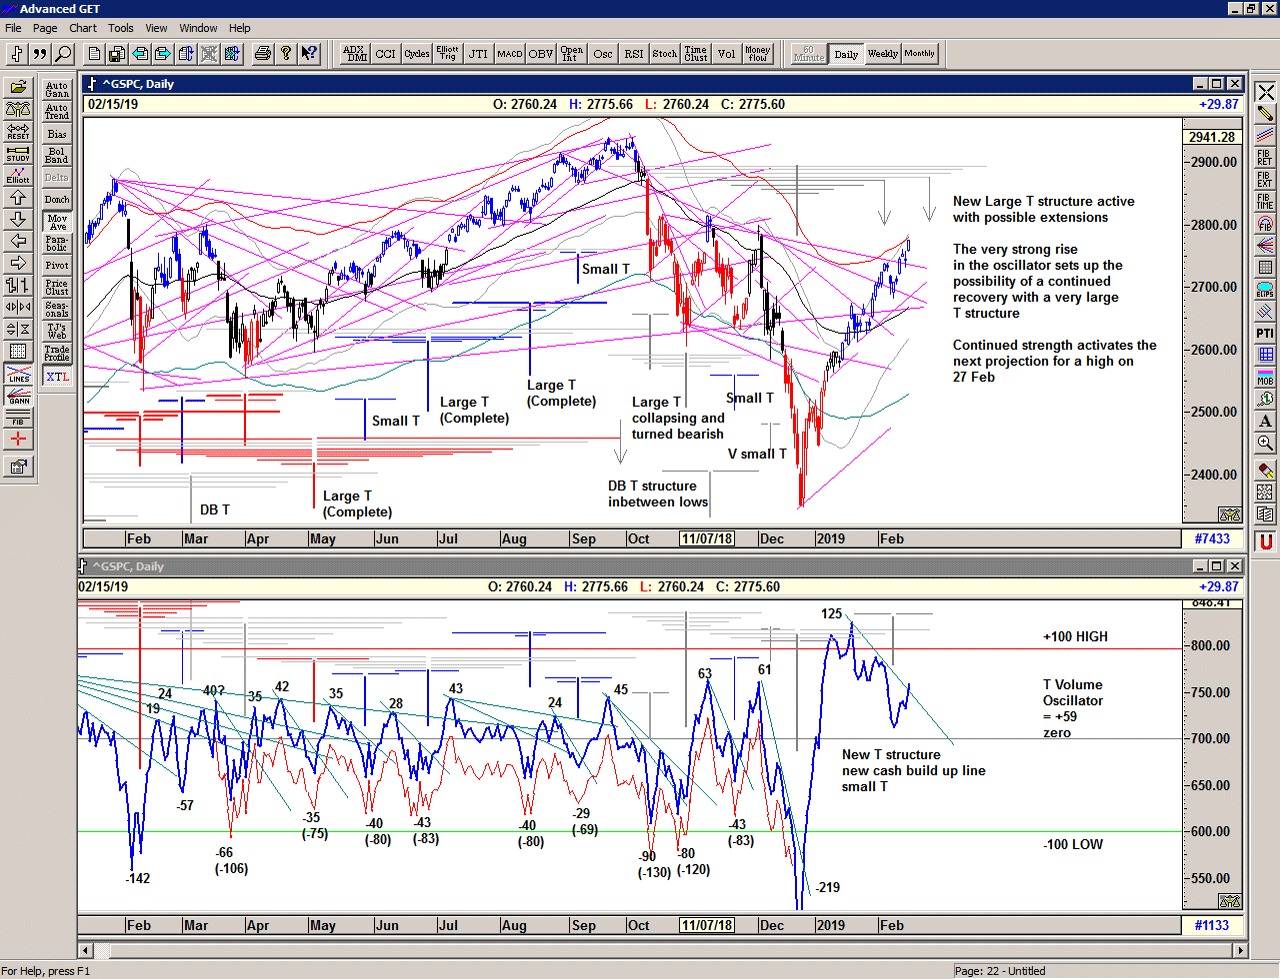
As we can see in the chart below, the T volume oscillator – an indication of relative Buying Power within the market as a whole – continues to be very strong and supportative of a continued recovery into (at least) the next series of projections for highs, and until we see significant profit-taking going on under the hood * , we should assume that the panic is over (at least for now) and that bullish liquidity and momentum are supportative of the market in general.

* For an example: Looking back a year ago to the January 2018 move, we can see that the T volume oscillator was already declining towards zero well before the end of the huge rise into the January peak.

Chart of S&P 500 for19 February 2019

Save the image to your desktop to view a larger version

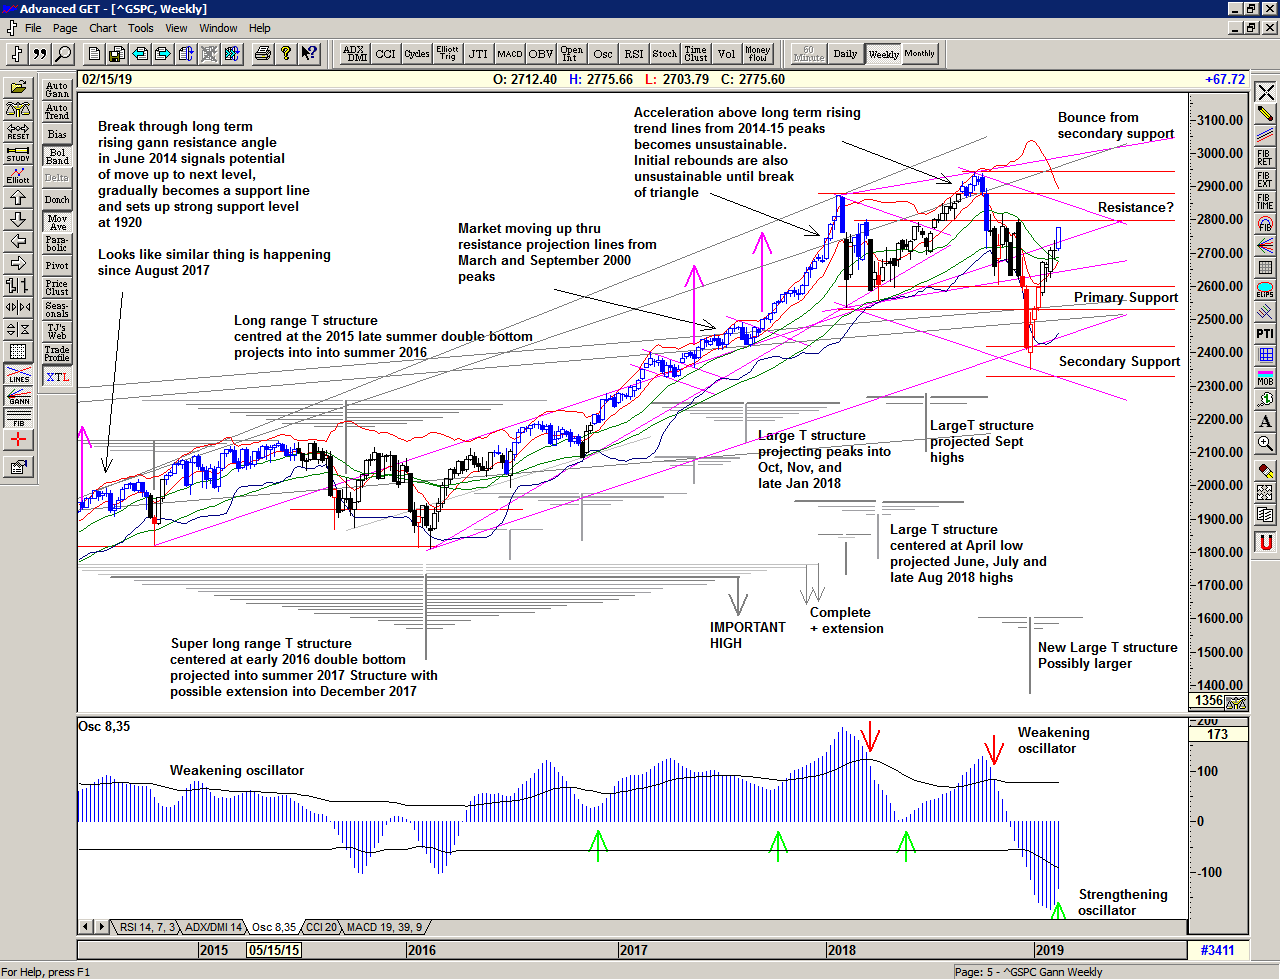
Zooming out to the weekly chart below. What I am seeing is that the market has been going through a process of re-establishing major support (ie where exceptional value lies) and that this is something necessary after moving upwards through an important trend line.

The movement upwards above 2400 in summer 2017 which accelerated into the January 2018 peak became unsustainable above the long term rising trend line, and therefore led to to the February collapse, and subsequently also to the April collapse.

When the market recovered to new all time highs – again above the long term trend-line – it became unstable again and looked for support once again. This time the market was considerably weaker and looked for more important support below the original breakout area of 2400 and at the important untested Summer 2017 lows.

Once the secondary support level was reached the market's reaction was very swift and sure indicating significant support and exceptional value.

If this ricochet move off the December lows is anything similar to the rise off the February 2016 low, then we should see a challenge to the most recent area of price resistance (2800) and once (or if) that challenge is successful, we could see another very large and extended move higher in due course, in the right-hand side of a very long range T structure of similar proportion to the 2016 structure.

Weekly Chart of S&P 500 for 19 February 2019

Save the image to your desktop to view a larger version

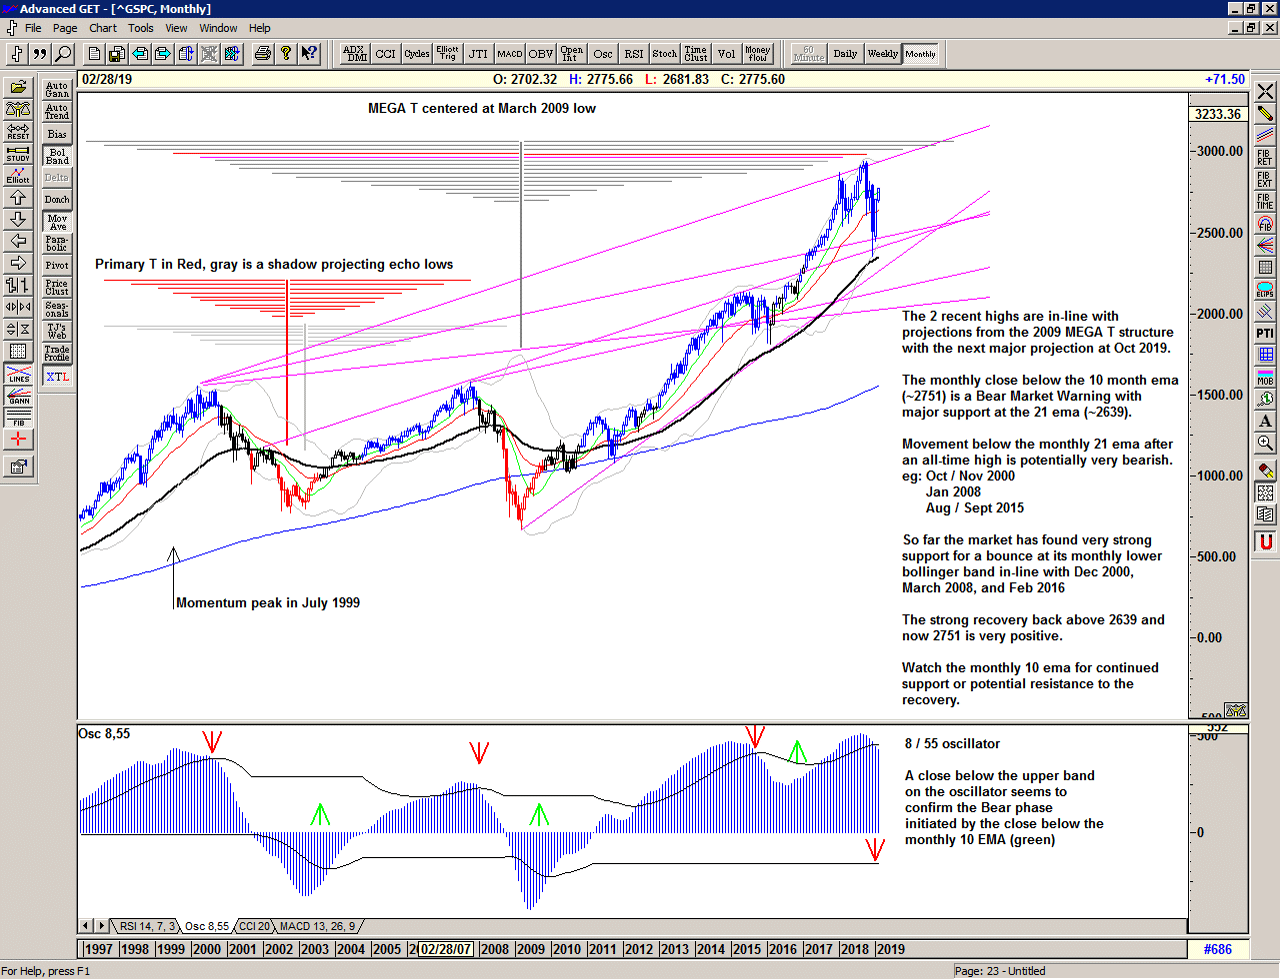
As we can see in the monthly chart the strong bounce back above the warning level of 2639 (21 ema) and the subsequent move back above the important bull market support level of 2751 (10 ema) is very encouraging.

If the market is to continue to recover and proceed to new all time highs, as per the next monthly projection for a high in the September – October time frame, we would like to see continued support at and above the monthly 10 ema.

The caveat is that the long range oscillator is warning of potential further trouble ahead, and so we should not discount the possibility of a re-test and a double dip of some sort as we saw in 2016 when the market recovered to its challenge area and then moved back lower.

Monthly chart of S&P 500 for 19 February 2019

Save the image to your desktop to view a larger version

All in all, 2019 has started with a move that continues the dynamic range of 2018 – far beyond the experience of the previous years. We should expect price volatility to continue and trade accordingly. This is a Brave New World.

Be prepared for whatever is coming next, and trade with confidence:

To receive detailed daily analysis, guidance and the updated daily Buy / Sell trigger levels being generated by the Trading the Line system before the market opens, and intraday alerts when appropriate, please become a Member and Sign up for Alerts & Observations – includes access to Members Area and the Explanatory Notes for all of the concepts discussed.

Disclaimer: This is the diary of a personal trading system, its methodology and the signals that it is producing. You are welcome to follow along but please understand that the information presented here is for educational purposes only. No recommendations are being made to buy, or sell stocks, options or futures contracts. Please consult your own financial advisor before making any investment decisions.


Lupercalia

The market checks out the recent range with an early drop to 2731 and another look see above 2750 as the market finds some resistance to price above the declining angle from the previous highs.

Chart of S&P500 for 15 February 2019

Be prepared for whatever is coming next, and trade with confidence:

To receive detailed daily analysis, guidance and the updated daily Buy / Sell trigger levels being generated by the Trading the Line system before the market opens, and intraday alerts when appropriate, please become a Member and Sign up for Alerts & Observations – includes access to Members Area and the Explanatory Notes for all of the concepts discussed.

Disclaimer: This is the diary of a personal trading system, its methodology and the signals that it is producing. You are welcome to follow along but please understand that the information presented here is for educational purposes only. No recommendations are being made to buy, or sell stocks, options or futures contracts. Please consult your own financial advisor before making any investment decisions.


Eros

A pop and drive to 2760 finds some resistance as the current Buy Signal continues.

Chart of S&P 500 for 14 February 2019

Be prepared for whatever is coming next, and trade with confidence:

To receive detailed daily analysis, guidance and the updated daily Buy / Sell trigger levels being generated by the Trading the Line system before the market opens, and intraday alerts when appropriate, please become a Member and Sign up for Alerts & Observations – includes access to Members Area and the Explanatory Notes for all of the concepts discussed.

Disclaimer: This is the diary of a personal trading system, its methodology and the signals that it is producing. You are welcome to follow along but please understand that the information presented here is for educational purposes only. No recommendations are being made to buy, or sell stocks, options or futures contracts. Please consult your own financial advisor before making any investment decisions.


Transmission

And we would go on as though nothing was wrong
And hide from these days we remained all alone
Staying in the same place, just staying out the time
Touching from a distance
Further all the time

Joy Division, Transmission, 1980

The market gaps up, well above the Buy Signal line, triggering a Buy Signal at 2728, and continues higher into the area of the 200 day moving average.

Chart of S&P 500 for 13 February 2019

Be prepared for whatever is coming next, and trade with confidence:

To receive detailed daily analysis, guidance and the updated daily Buy / Sell trigger levels being generated by the Trading the Line system before the market opens, and intraday alerts when appropriate, please become a Member and Sign up for Alerts & Observations – includes access to Members Area and the Explanatory Notes for all of the concepts discussed.

Disclaimer: This is the diary of a personal trading system, its methodology and the signals that it is producing. You are welcome to follow along but please understand that the information presented here is for educational purposes only. No recommendations are being made to buy, or sell stocks, options or futures contracts. Please consult your own financial advisor before making any investment decisions.


Lincoln

The best way to predict your future is to create it.

Abraham Lincoln

A gap up and stabilization above 2700. Not quite a Buy Signal.

Chart of S&P 500 for 12 February 2019

Be prepared for whatever is coming next, and trade with confidence:

To receive detailed daily analysis, guidance and the updated daily Buy / Sell trigger levels being generated by the Trading the Line system before the market opens, and intraday alerts when appropriate, please become a Member and Sign up for Alerts & Observations – includes access to Members Area and the Explanatory Notes for all of the concepts discussed.

Disclaimer: This is the diary of a personal trading system, its methodology and the signals that it is producing. You are welcome to follow along but please understand that the information presented here is for educational purposes only. No recommendations are being made to buy, or sell stocks, options or futures contracts. Please consult your own financial advisor before making any investment decisions.


Thread

Will cut a thread
Write yourself as dead
Catch every single spark
There's tracks inside my head
Will find it there
You believe, you swear
Will the beads around your wrist
Capture every single prayer

Unkle (feat. Gavin Clark), Every Single Prayer, 2010

Songwriters: Gavin Michael Clark, James Lavelle, Pablo Clements, Aiden Lavelle

The market takes another look at the 2680s, stabilizes and heads back up into the 2700 area with a strong finish to the week.

Still below the Buy Signal level but an encouraging test of the market's recent resilience.

Chart of S&P 500 for 11 February 2019

Be prepared for whatever is coming next, and trade with confidence:

To receive detailed daily analysis, guidance and the updated daily Buy / Sell trigger levels being generated by the Trading the Line system before the market opens, and intraday alerts when appropriate, please become a Member and Sign up for Alerts & Observations – includes access to Members Area and the Explanatory Notes for all of the concepts discussed.

Disclaimer: This is the diary of a personal trading system, its methodology and the signals that it is producing. You are welcome to follow along but please understand that the information presented here is for educational purposes only. No recommendations are being made to buy, or sell stocks, options or futures contracts. Please consult your own financial advisor before making any investment decisions.


Darkness

A portion like madness in season
Bracing all like a breaking of reason
With every night lost and every day torn
With the drama feeling calmer and it's calmer in the storm
Speakers are crying like a forrest in the rain
I was so alone with my thoughts and my pain
And the darkness closed like a mouth on a wild night
I'll never be free

Ooh, in this darkness
Please light my way
Light my way

Moby, This Wild Darkness, 2018

A significant drop at the open triggering a Cover signal below 2711, and the lack of sufficient recovery back above that level completes the Buy Signal from the 03 January low.

The long spike to 2687 indicates temporary support which may need to be re-visited while we wait to see if there is another move higher or if this is the beginning of another period of bearish weakness.

The recent structure has been re-drawn centered one day earlier on the 21st December  – the oscillator low rather than the actual price low – as this clearly is a better fit. Although there are additional projections for highs, it is not clear yet whether these will be higher highs.

Chart of S&P500 for 08 February 2019

Be prepared for whatever is coming next, and trade with confidence:

To receive detailed daily analysis, guidance and the updated daily Buy / Sell trigger levels being generated by the Trading the Line system before the market opens, and intraday alerts when appropriate, please become a Member and Sign up for Alerts & Observations – includes access to Members Area and the Explanatory Notes for all of the concepts discussed.

Disclaimer: This is the diary of a personal trading system, its methodology and the signals that it is producing. You are welcome to follow along but please understand that the information presented here is for educational purposes only. No recommendations are being made to buy, or sell stocks, options or futures contracts. Please consult your own financial advisor before making any investment decisions.