Inveigle

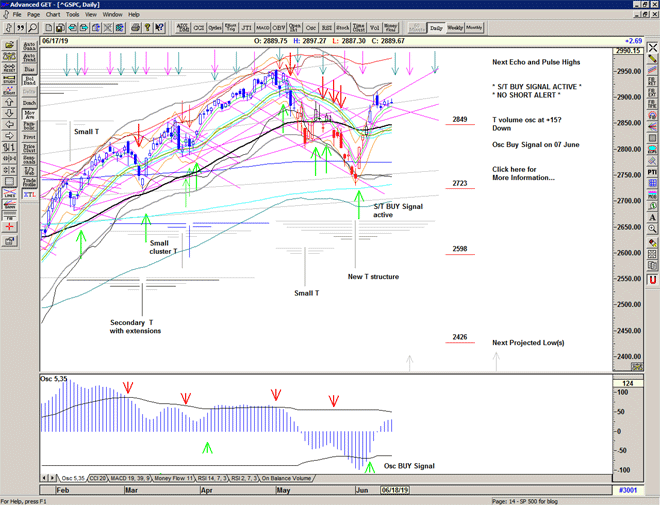
The market takes a look above 2900 and finds it unsustainable, releasing some of the pressure from the recent advance.

Buy Signal still active as price catches up with itself.

Chart of S&P 500 for 12 June 2019

Be prepared for whatever is coming next, and trade with confidence:

To receive detailed daily analysis, guidance and the updated daily Buy / Sell trigger levels being generated by the Trading the Line system before the market opens, and intraday alerts when appropriate, please become a Member and Sign up for Alerts & Observations – includes access to Members Area and the Explanatory Notes for all of the concepts discussed.

Disclaimer: This is the diary of a personal trading system, its methodology and the signals that it is producing. You are welcome to follow along but please understand that the information presented here is for educational purposes only. No recommendations are being made to buy, or sell stocks, options or futures contracts. Please consult your own financial advisor before making any investment decisions.

Trojan

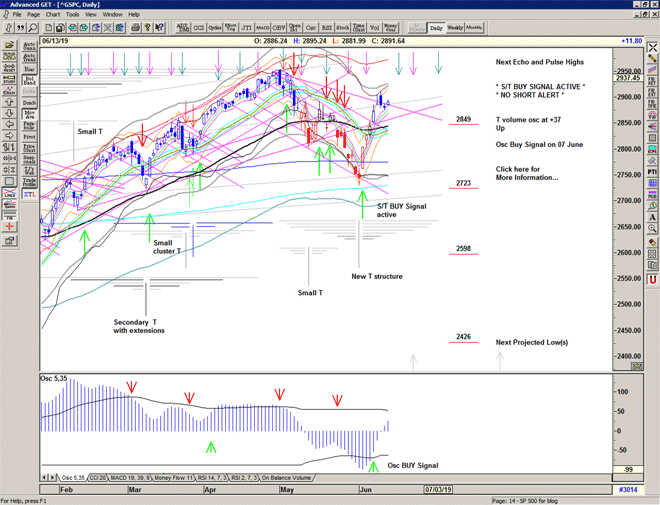
The market continues higher with a gap up and push into 2904 before fading into the close.

Chart of S&P 500 for 11 June 2019

Be prepared for whatever is coming next, and trade with confidence:

To receive detailed daily analysis, guidance and the updated daily Buy / Sell trigger levels being generated by the Trading the Line system before the market opens, and intraday alerts when appropriate, please become a Member and Sign up for Alerts & Observations – includes access to Members Area and the Explanatory Notes for all of the concepts discussed.

Disclaimer: This is the diary of a personal trading system, its methodology and the signals that it is producing. You are welcome to follow along but please understand that the information presented here is for educational purposes only. No recommendations are being made to buy, or sell stocks, options or futures contracts. Please consult your own financial advisor before making any investment decisions.


Spirit

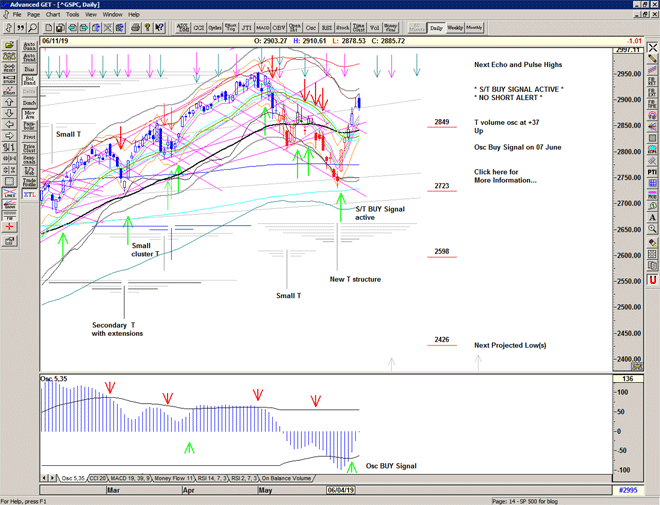
The market moves hurriedly higher into recent resistance at 2885.

The momentum oscillator turns positive in support of last week's recovery.

Chart of S&P 500 for 10 June 2019

Be prepared for whatever is coming next, and trade with confidence:

To receive detailed daily analysis, guidance and the updated daily Buy / Sell trigger levels being generated by the Trading the Line system before the market opens, and intraday alerts when appropriate, please become a Member and Sign up for Alerts & Observations – includes access to Members Area and the Explanatory Notes for all of the concepts discussed.

Disclaimer: This is the diary of a personal trading system, its methodology and the signals that it is producing. You are welcome to follow along but please understand that the information presented here is for educational purposes only. No recommendations are being made to buy, or sell stocks, options or futures contracts. Please consult your own financial advisor before making any investment decisions.

Tuiles

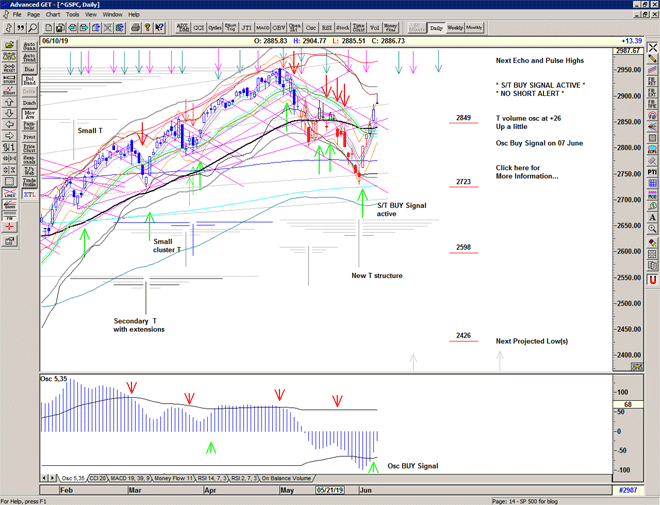
The market continues its fast recovery with a move back to the important pivot.

A significant improvement.

Untitled-1

Be prepared for whatever is coming next, and trade with confidence:

To receive detailed daily analysis, guidance and the updated daily Buy / Sell trigger levels being generated by the Trading the Line system before the market opens, and intraday alerts when appropriate, please become a Member and Sign up for Alerts & Observations – includes access to Members Area and the Explanatory Notes for all of the concepts discussed.

Disclaimer: This is the diary of a personal trading system, its methodology and the signals that it is producing. You are welcome to follow along but please understand that the information presented here is for educational purposes only. No recommendations are being made to buy, or sell stocks, options or futures contracts. Please consult your own financial advisor before making any investment decisions.


Normandy

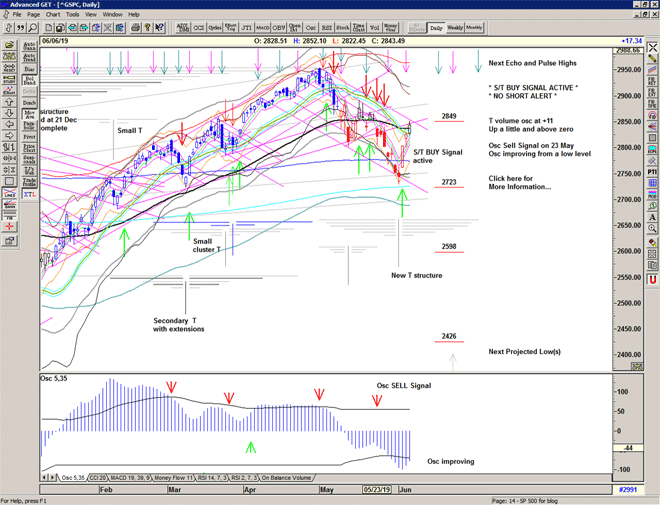
The market gaps higher, sells off the gap and proceeds higher to close at 2826, still on a rip and leaving 2800 behind.

Back in an area of previous interest with the two most recent highs at 2840 and site of the important pivots.

Chart of S&P 500 for 06 June 2019

Be prepared for whatever is coming next, and trade with confidence:

To receive detailed daily analysis, guidance and the updated daily Buy / Sell trigger levels being generated by the Trading the Line system before the market opens, and intraday alerts when appropriate, please become a Member and Sign up for Alerts & Observations – includes access to Members Area and the Explanatory Notes for all of the concepts discussed.

Disclaimer: This is the diary of a personal trading system, its methodology and the signals that it is producing. You are welcome to follow along but please understand that the information presented here is for educational purposes only. No recommendations are being made to buy, or sell stocks, options or futures contracts. Please consult your own financial advisor before making any investment decisions.


Condensate

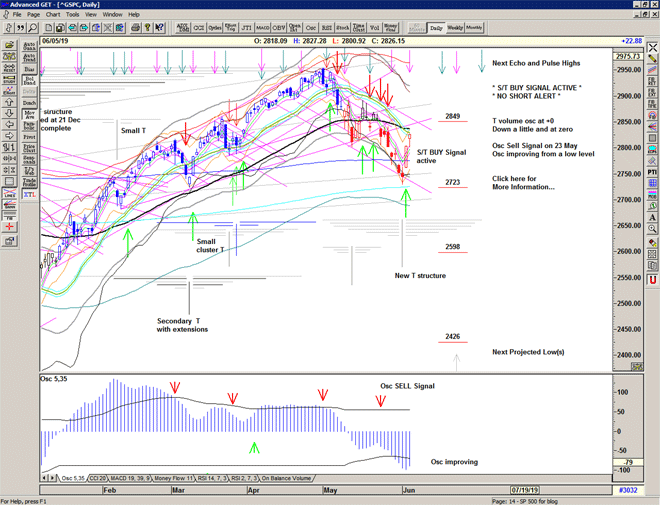
A mix of short-covering and buying interest ignites an impressive move up through the S/T Buy Signal level at 2779 taking the market firmly back above the 200 day moving average and removing the Bear market warning for now.

The T volume oscillator moves strongly up and turns positive in support of the new structure that projects strength through June, assuming, of course, that the 03 June low is not taken out.

Chart of S&P 500 for 05 June 2019

Be prepared for whatever is coming next, and trade with confidence:

To receive detailed daily analysis, guidance and the updated daily Buy / Sell trigger levels being generated by the Trading the Line system before the market opens, and intraday alerts when appropriate, please become a Member and Sign up for Alerts & Observations – includes access to Members Area and the Explanatory Notes for all of the concepts discussed.

Disclaimer: This is the diary of a personal trading system, its methodology and the signals that it is producing. You are welcome to follow along but please understand that the information presented here is for educational purposes only. No recommendations are being made to buy, or sell stocks, options or futures contracts. Please consult your own financial advisor before making any investment decisions.


Brissim

An extremely choppy day with strong selling and strong buying as the market reacts to last week's drop but defends 2730.

A strong move up in the T volume oscillator is encouraging and opens up the possibility of a recovery, and a possible new T structure under construction.

Chart of S&P 500 for 04 June 2019

Be prepared for whatever is coming next, and trade with confidence:

To receive detailed daily analysis, guidance and the updated daily Buy / Sell trigger levels being generated by the Trading the Line system before the market opens, and intraday alerts when appropriate, please become a Member and Sign up for Alerts & Observations – includes access to Members Area and the Explanatory Notes for all of the concepts discussed.

Disclaimer: This is the diary of a personal trading system, its methodology and the signals that it is producing. You are welcome to follow along but please understand that the information presented here is for educational purposes only. No recommendations are being made to buy, or sell stocks, options or futures contracts. Please consult your own financial advisor before making any investment decisions.


Under Pressure

Welcome to the Trading the Line Special Report.

The market is back under pressure as a series of gaps down and manic attempts to recover reveal the distributive nature of May and find the market back below the important 200 day moving average.

For me, that is a Bear Market Warning flashing.

Of course, a rapid recovery back above the 200 day moving average would be a very welcome sign, but in the meantime the market continues to look for stability in what looks like an increasingly unstable World.

Daily chart of S&P 500 for 03 June 2019

Save the image to your desktop to view a larger version

As we can see in the chart below with the T volume oscillator*, the market was starting to weaken from mid April – as the oscillator starts to diverge with price. The oscillator is declining below zero whilst price is making new highs.

The market was running on vapors, and it was running out of time.

The large T structure projected a high on about 16 April with a possible subsequent high on about 09-10 May but the 01 May engulfing down day was enough to signal the end of the spring advance as each subsequent attempt to move back up has been rapidly sold into.

* The T volume oscillator is an indication of Buying Power within the market as a whole

Chart of S&P 500 for 03 June 2019

Save the image to your desktop to view a larger version

Zooming out to the weekly chart below.

We can see that the market stretched up through the previous resistance levels at 2800 and 2870 into a token new high at 2950 before its completion of the Spring advance.

The weekly and monthly close below important support looks, at least for now, rather ominous.

As we can see there is important rising support in the 2690s, but much lower starts another tipping over effect, and the 'delights' of Pandora's Box below that.

Weekly Chart of S&P 500 for 03 June 2019

Save the image to your desktop to view a larger version

As we can see in the monthly chart the rising trend line from the 2000 high continues to be very strong resistance.

The monthly close below 2780 (10 ema) is a bearish indication. Whilst strong potential support lies at the 2690 level (21 ema), further weakness would be a very ominous sign.

The next very long range projection for a high is in the September – October time frame. If the market is to recover and proceed back to new all time highs or perhaps an important lower high, we need to see some kind of recovery back above the 10 ema.

The long range oscillator continues to be in decline and is potentially warning of further trouble ahead.

Monthly chart of S&P 500 for 03 June 2019

Save the image to your desktop to view a larger version

All in all, 2019 continues the dynamic range of 2018 – far beyond the experience of the previous years. We should expect price volatility and price expansion to continue and trade accordingly. This is a Brave New World.

Regardless of whether the market can recover or whether deeper low(s) are ahead of us, the simplicity of the proprietary price based S/T Signalling System continues to keep us on the correct side of the market, with price firmly below Sell Signal levels.

If you would like to learn more about using the S/T Signalling System please get in touch.

Be prepared for whatever is coming next, and trade with confidence:

To receive detailed daily analysis, guidance and the updated daily Buy / Sell trigger levels being generated by the Trading the Line system before the market opens, and intraday alerts when appropriate, please become a Member and Sign up for Alerts & Observations – includes access to Members Area and the Explanatory Notes for all of the concepts discussed.

Disclaimer: This is the diary of a personal trading system, its methodology and the signals that it is producing. You are welcome to follow along but please understand that the information presented here is for educational purposes only. No recommendations are being made to buy, or sell stocks, options or futures contracts. Please consult your own financial advisor before making any investment decisions.


Kalka

Market at a critical juncture attempting to hold onto the 200 day moving average.

Bear market warning flashing with Futures down significantly overnight.

Chart of S&P 500 for 31 May 2019

Be prepared for whatever is coming next, and trade with confidence:

To receive detailed daily analysis, guidance and the updated daily Buy / Sell trigger levels being generated by the Trading the Line system before the market opens, and intraday alerts when appropriate, please become a Member and Sign up for Alerts & Observations – includes access to Members Area and the Explanatory Notes for all of the concepts discussed.

Disclaimer: This is the diary of a personal trading system, its methodology and the signals that it is producing. You are welcome to follow along but please understand that the information presented here is for educational purposes only. No recommendations are being made to buy, or sell stocks, options or futures contracts. Please consult your own financial advisor before making any investment decisions.