Arbola

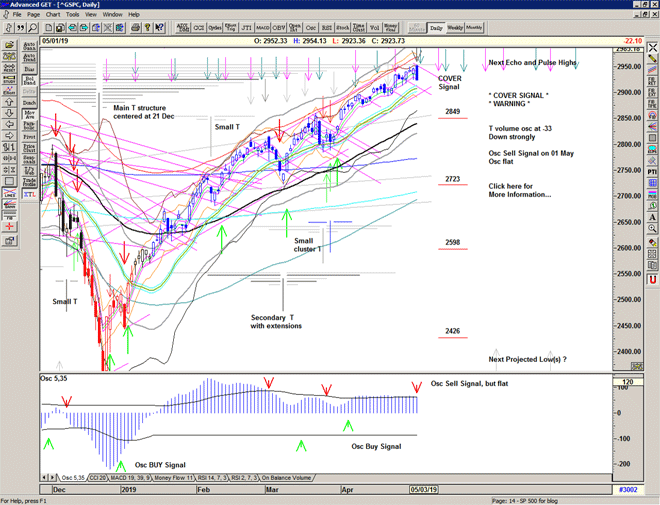
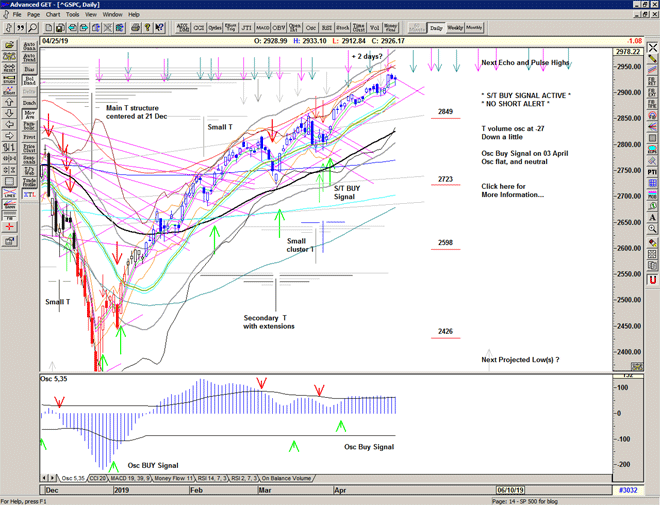
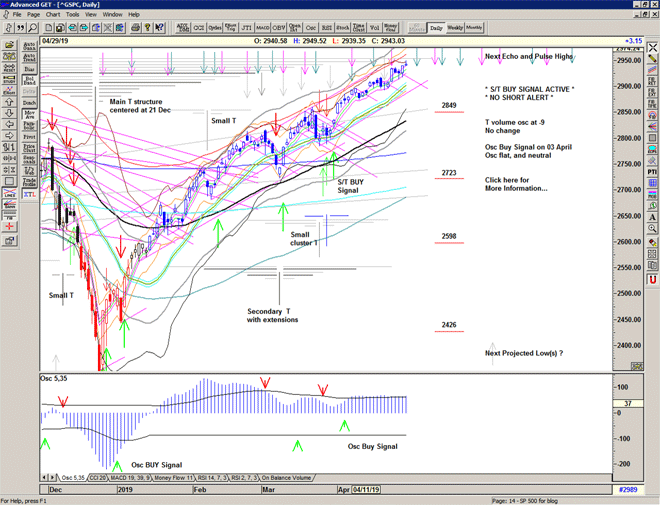
Early weakness and a test of 2913 finds buyers for another look at the 2930s as the market continues to be resilient at the new high.

Chart of S&P 500 for 26 April 2019

Be prepared for whatever is coming next, and trade with confidence:

To receive detailed daily analysis, guidance and the updated daily Buy / Sell trigger levels being generated by the Trading the Line system before the market opens, and intraday alerts when appropriate, please become a Member and Sign up for Alerts & Observations – includes access to Members Area and the Explanatory Notes for all of the concepts discussed.

Disclaimer: This is the diary of a personal trading system, its methodology and the signals that it is producing. You are welcome to follow along but please understand that the information presented here is for educational purposes only. No recommendations are being made to buy, or sell stocks, options or futures contracts. Please consult your own financial advisor before making any investment decisions.


Helix

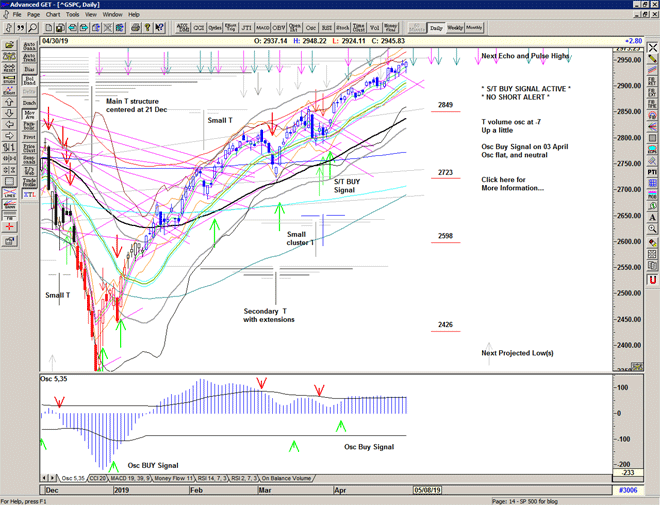
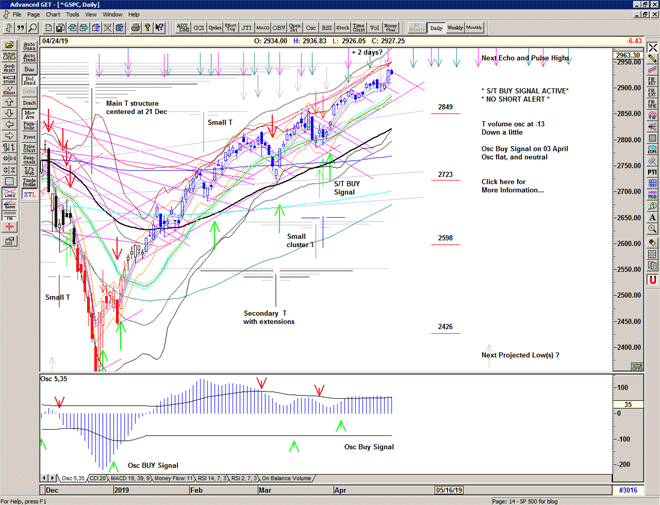
Another look at the 2936 level as the market takes a pause after the echo high.

Chart of S&P 500 for 25 April 2019

Be prepared for whatever is coming next, and trade with confidence:

To receive detailed daily analysis, guidance and the updated daily Buy / Sell trigger levels being generated by the Trading the Line system before the market opens, and intraday alerts when appropriate, please become a Member and Sign up for Alerts & Observations – includes access to Members Area and the Explanatory Notes for all of the concepts discussed.

Disclaimer: This is the diary of a personal trading system, its methodology and the signals that it is producing. You are welcome to follow along but please understand that the information presented here is for educational purposes only. No recommendations are being made to buy, or sell stocks, options or futures contracts. Please consult your own financial advisor before making any investment decisions.


Mirror

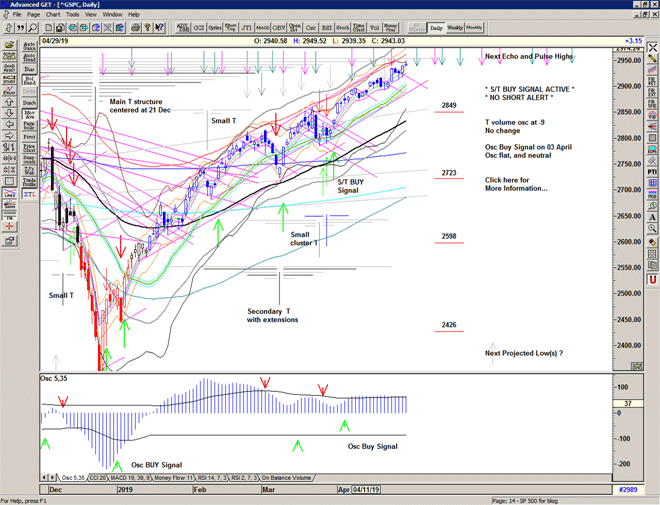
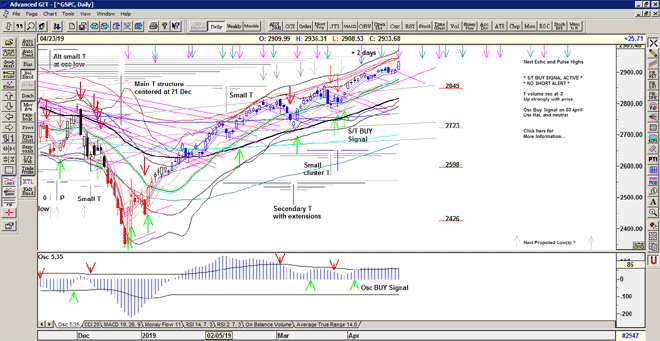
The market heads higher into another echo high and the current Buy Signal continues into the all time high.

Chart of S&P500 for 24 April 2019

Be prepared for whatever is coming next, and trade with confidence:

To receive detailed daily analysis, guidance and the updated daily Buy / Sell trigger levels being generated by the Trading the Line system before the market opens, and intraday alerts when appropriate, please become a Member and Sign up for Alerts & Observations – includes access to Members Area and the Explanatory Notes for all of the concepts discussed.

Disclaimer: This is the diary of a personal trading system, its methodology and the signals that it is producing. You are welcome to follow along but please understand that the information presented here is for educational purposes only. No recommendations are being made to buy, or sell stocks, options or futures contracts. Please consult your own financial advisor before making any investment decisions.


Gorge

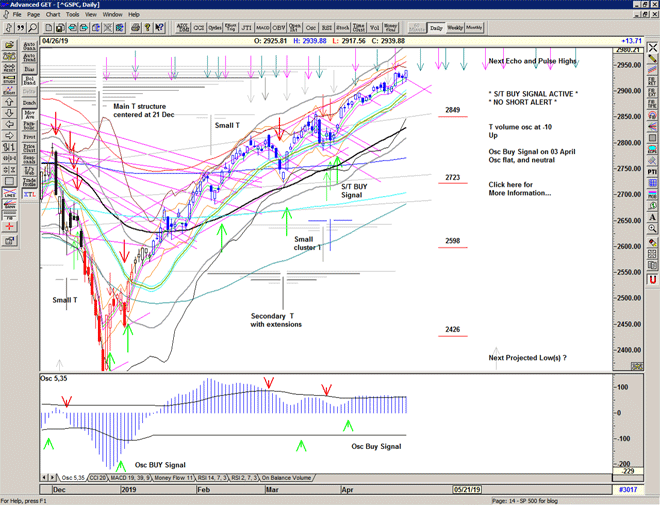
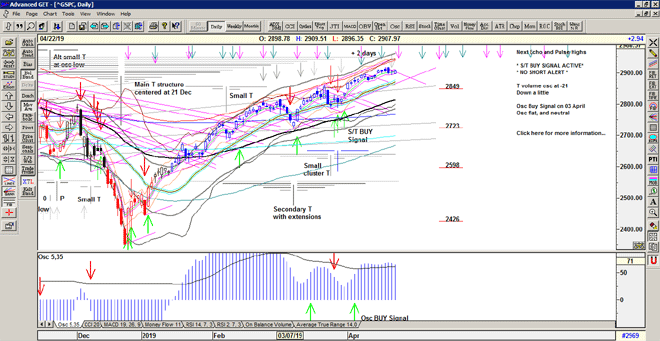
The market opens lower and finds early strength to hold above 2900.

An echo high is scheduled for today.

Chart of S&P500 for 23 April 2019

Be prepared for whatever is coming next, and trade with confidence:

To receive detailed daily analysis, guidance and the updated daily Buy / Sell trigger levels being generated by the Trading the Line system before the market opens, and intraday alerts when appropriate, please become a Member and Sign up for Alerts & Observations – includes access to Members Area and the Explanatory Notes for all of the concepts discussed.

Disclaimer: This is the diary of a personal trading system, its methodology and the signals that it is producing. You are welcome to follow along but please understand that the information presented here is for educational purposes only. No recommendations are being made to buy, or sell stocks, options or futures contracts. Please consult your own financial advisor before making any investment decisions.


Oeuf poché

The market shrugs off the early morning nerves and holds up above the Buy Signal line into the Easter break.

Light holiday week action without a catalyst for selling, yet, with the expectation of a continuation of range-bound processing of 2900 until a decision is made either to proceed higher, or to break lower and re-stabilize again.

Chart of S&P 500 for 22 April 2019

Be prepared for whatever is coming next, and trade with confidence:

To receive detailed daily analysis, guidance and the updated daily Buy / Sell trigger levels being generated by the Trading the Line system before the market opens, and intraday alerts when appropriate, please become a Member and Sign up for Alerts & Observations – includes access to Members Area and the Explanatory Notes for all of the concepts discussed.

Disclaimer: This is the diary of a personal trading system, its methodology and the signals that it is producing. You are welcome to follow along but please understand that the information presented here is for educational purposes only. No recommendations are being made to buy, or sell stocks, options or futures contracts. Please consult your own financial advisor before making any investment decisions.


Pesach

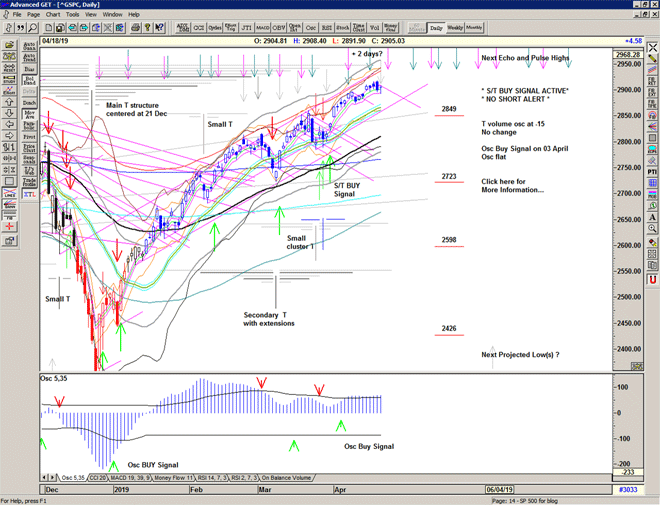
The market winds down into the Pesach / Passover / Easter / Eostre / Ostara weekend with a series of looks higher, at 2910 to 2916.

A small megaphone suggesting that the market is not yet ready to move above this level, and the T volume oscillator turns negative flashing a warning.

Price has remained firmly above the S/T Buy Signal level since the gap up on 29 March, but that now looks under threat.

The market is currently at a long projection from the main T structure for a high from the important 29 August high with additional highs projected by the smaller structures for early next week.

Spring in the air.

Chart of S&P 500 for 18 April 2019

Be prepared for whatever is coming next, and trade with confidence:

To receive detailed daily analysis, guidance and the updated daily Buy / Sell trigger levels being generated by the Trading the Line system before the market opens, and intraday alerts when appropriate, please become a Member and Sign up for Alerts & Observations – includes access to Members Area and the Explanatory Notes for all of the concepts discussed.

Disclaimer: This is the diary of a personal trading system, its methodology and the signals that it is producing. You are welcome to follow along but please understand that the information presented here is for educational purposes only. No recommendations are being made to buy, or sell stocks, options or futures contracts. Please consult your own financial advisor before making any investment decisions.


Market closing at 2900

The market gaps up into 2916 and immediately starts selling strongly.

Another gap up and strong selling from the morning high continues the theme of the week.

As we have a major projection for a high at this time (from the main structure), I am taking the weakness and deterioration in price today seriously.

Still holding up above the Buy Signal / Cover level, and back in the S/T channel, but the reactions above 2900 are telling.

The T volume oscillator drops below zero flashing a warning.

Formula

For those who believe in God, most of the big questions are answered. But for those of us who can't readily accept the God formula, the big answers don't remain stone-written. We adjust to new conditions and discoveries. We are pliable. Love need not be a command nor faith a dictum. I am my own god. We are here to unlearn the teachings of the church, state, and our educational system. We are here to drink beer. We are here to kill war. We are here to laugh at the odds and live our lives so well that Death will tremble to take us.

Charles Bukowski

The market opens higher and backs away from 2916, continuing to process price above 2900.

The market is in the area for a projection of a high from the main T structure, and the secondary and cluster structure project into early next week. An echo high is scheduled for 23 April. The combined forces may lead to a conclusion of the current advance.

Chart of S&P 500 for 17 April 2019

Be prepared for whatever is coming next, and trade with confidence:

To receive detailed daily analysis, guidance and the updated daily Buy / Sell trigger levels being generated by the Trading the Line system before the market opens, and intraday alerts when appropriate, please become a Member and Sign up for Alerts & Observations – includes access to Members Area and the Explanatory Notes for all of the concepts discussed.

Disclaimer: This is the diary of a personal trading system, its methodology and the signals that it is producing. You are welcome to follow along but please understand that the information presented here is for educational purposes only. No recommendations are being made to buy, or sell stocks, options or futures contracts. Please consult your own financial advisor before making any investment decisions.


Just as lightning…

Just as lightning makes no sound until it strikes, the Negro Revolution generated quietly. But when it struck, the revealing flash of its power and the impact of its sincerity and fervor displayed a force of a frightening intensity. Three hundred years of humiliation, abuse, and deprivation cannot be expected to find voice in a whisper.

Martin Luther King Jr, Why We Can't Wait, 1964

The market pulls back a little and grinds processing price just above 2900.

Mixed signals continue, but price remains defiantly resilient.

Close to an important projection for a high.

Chart of S&P 500 for 16 April 2019

Be prepared for whatever is coming next, and trade with confidence:

To receive detailed daily analysis, guidance and the updated daily Buy / Sell trigger levels being generated by the Trading the Line system before the market opens, and intraday alerts when appropriate, please become a Member and Sign up for Alerts & Observations – includes access to Members Area and the Explanatory Notes for all of the concepts discussed.

Disclaimer: This is the diary of a personal trading system, its methodology and the signals that it is producing. You are welcome to follow along but please understand that the information presented here is for educational purposes only. No recommendations are being made to buy, or sell stocks, options or futures contracts. Please consult your own financial advisor before making any investment decisions.


Serse

The market pops up and processes price above 2900.

The T volume oscillator turns back up above zero but is relatively muted considering the jump in price, suggesting some lack of commitment.

Chart of S&P 500 for 15 April 2019

Be prepared for whatever is coming next, and trade with confidence:

To receive detailed daily analysis, guidance and the updated daily Buy / Sell trigger levels being generated by the Trading the Line system before the market opens, and intraday alerts when appropriate, please become a Member and Sign up for Alerts & Observations – includes access to Members Area and the Explanatory Notes for all of the concepts discussed.

Disclaimer: This is the diary of a personal trading system, its methodology and the signals that it is producing. You are welcome to follow along but please understand that the information presented here is for educational purposes only. No recommendations are being made to buy, or sell stocks, options or futures contracts. Please consult your own financial advisor before making any investment decisions.