Prima Aprilis

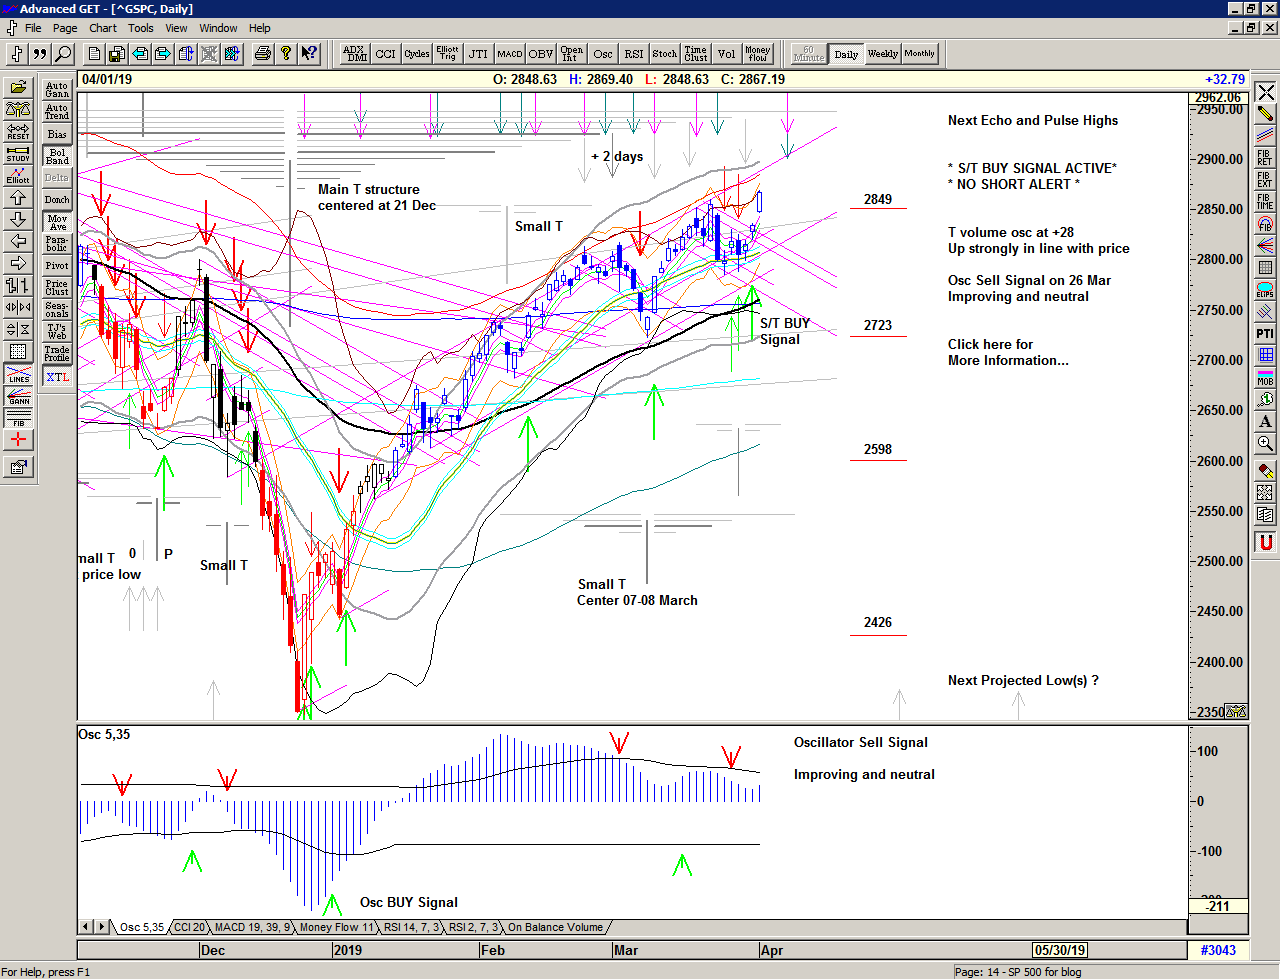
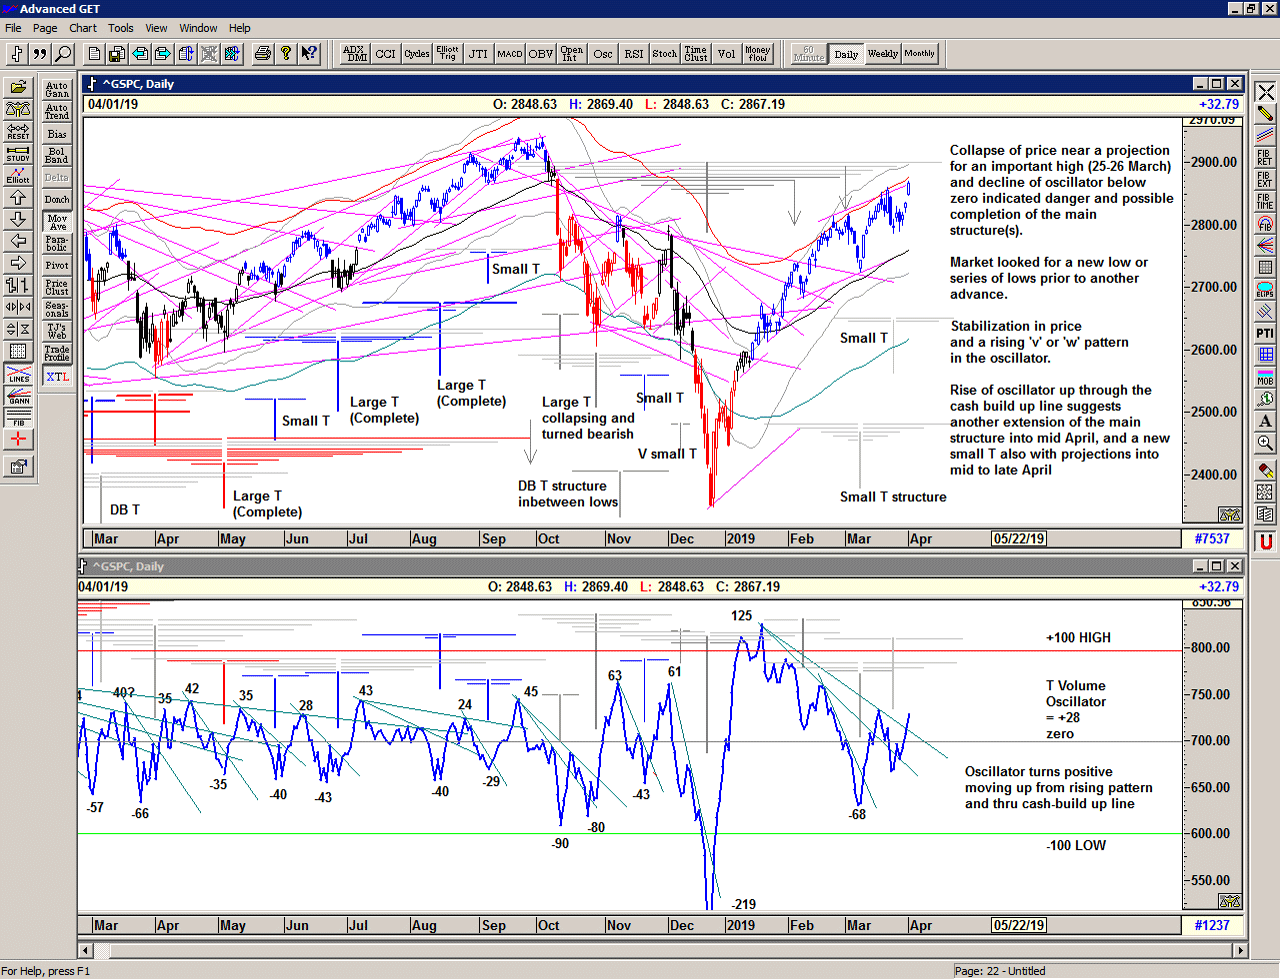
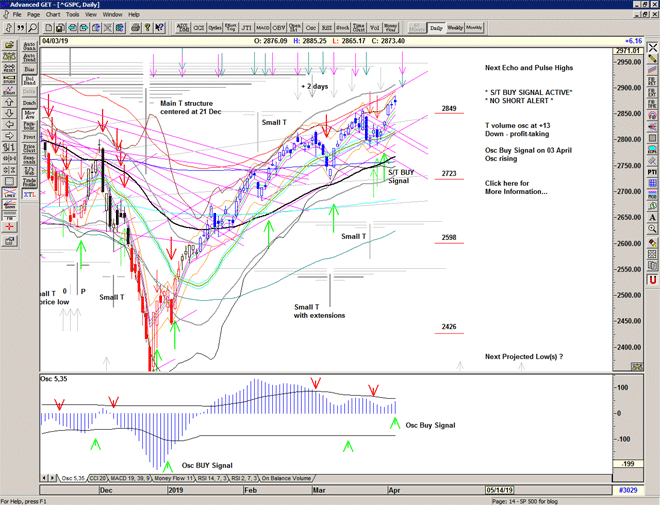
The market gaps up above the recent holding pattern above 2820 triggering an S/T Buy Signal at 2827.

Finally some movement out of last week's congestion or holding pattern which, for now, looks like strong support at and just below 2800 has been thoroughly tested.

The numerous reversals of direction last week, although frustrating, is a phenomenon that occurs from time to time. The last occasion was late June / early July 2018 as the market consolidated around 2700. This process builds significant energy for a strong directional move, and so the ejection on Friday upwards is a very positive development.

Chart of S&P 500 for 01 April 2019

Be prepared for whatever is coming next, and trade with confidence:

To receive detailed daily analysis, guidance and the updated daily Buy / Sell trigger levels being generated by the Trading the Line system before the market opens, and intraday alerts when appropriate, please become a Member and Sign up for Alerts & Observations – includes access to Members Area and the Explanatory Notes for all of the concepts discussed.

Disclaimer: This is the diary of a personal trading system, its methodology and the signals that it is producing. You are welcome to follow along but please understand that the information presented here is for educational purposes only. No recommendations are being made to buy, or sell stocks, options or futures contracts. Please consult your own financial advisor before making any investment decisions.

 

Drive

A man's attitude… a man's attitude goes some ways. The way his life will be. Is that somethin' you agree with?

Mulholland Drive, Dir. David Lynch, 2001

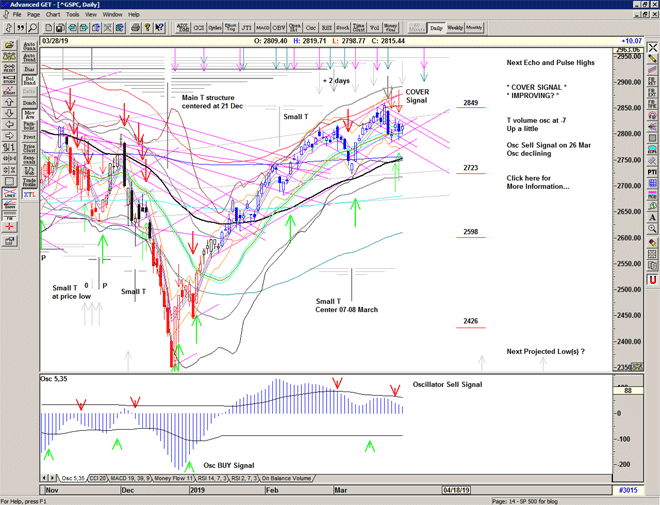
The market still held within its recent choppy range as the two channels merge, but seemingly improving with another day resolving back towards the upper level of the recent range and near to a Buy Signal.

Mindful of the declining nature of the momentum oscillator and recent drop in the T volume oscillator indicating negative breadth, and of course with one eye on the exhaustion high on 21 March, the gradual but choppy improvement in price is hinting at higher prices in due course. If that is correct, then the large T structure is larger with another extension in mid April.

Chart of S&P 500 for 29 March 2019

Be prepared for whatever is coming next, and trade with confidence:

To receive detailed daily analysis, guidance and the updated daily Buy / Sell trigger levels being generated by the Trading the Line system before the market opens, and intraday alerts when appropriate, please become a Member and Sign up for Alerts & Observations – includes access to Members Area and the Explanatory Notes for all of the concepts discussed.

Disclaimer: This is the diary of a personal trading system, its methodology and the signals that it is producing. You are welcome to follow along but please understand that the information presented here is for educational purposes only. No recommendations are being made to buy, or sell stocks, options or futures contracts. Please consult your own financial advisor before making any investment decisions.


Rikyu

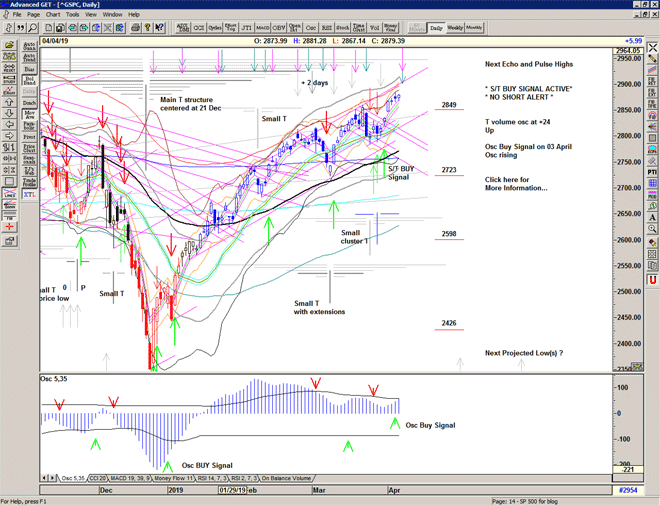
Another turbulent day with a touch of the Buy Signal level at 2822 and a sell off through the Sell Signal level at 2794 before recovery back above 2800.

The market is currently trapped within the channels and chopping about violently making holding a position extremely difficult, and is in effect preparing for the next big move, direction uncertain.

Chart of S&P 500 for 28 March 2019

Be prepared for whatever is coming next, and trade with confidence:

To receive detailed daily analysis, guidance and the updated daily Buy / Sell trigger levels being generated by the Trading the Line system before the market opens, and intraday alerts when appropriate, please become a Member and Sign up for Alerts & Observations – includes access to Members Area and the Explanatory Notes for all of the concepts discussed.

Disclaimer: This is the diary of a personal trading system, its methodology and the signals that it is producing. You are welcome to follow along but please understand that the information presented here is for educational purposes only. No recommendations are being made to buy, or sell stocks, options or futures contracts. Please consult your own financial advisor before making any investment decisions.


Menaechmi

Teach me, dear creature, how to think and speak;
Lay open to my earthy-gross conceit,
Smother'd in errors, feeble, shallow, weak,
The folded meaning of your words' deceit.

William Shakespeare, The Comedy of Errors, c. 1594

A Buy Signal at 2821, as the market gaps up to have a look-see at 2829 before selling off hard and descending back to 2804, triggering a cover signal. Finally finding strong support and recovering into the close.

An unstable and confusing market.

Chart of S&P 500 for 27 March 2019

Be prepared for whatever is coming next, and trade with confidence:

To receive detailed daily analysis, guidance and the updated daily Buy / Sell trigger levels being generated by the Trading the Line system before the market opens, and intraday alerts when appropriate, please become a Member and Sign up for Alerts & Observations – includes access to Members Area and the Explanatory Notes for all of the concepts discussed.

Disclaimer: This is the diary of a personal trading system, its methodology and the signals that it is producing. You are welcome to follow along but please understand that the information presented here is for educational purposes only. No recommendations are being made to buy, or sell stocks, options or futures contracts. Please consult your own financial advisor before making any investment decisions.


Mighty Mountain

I'm in so deep
Baby, I can't sleep
Floating above me, the armies of the captain
Marching towards the mountain, the mighty mountain
In the car window I saw you smile
The screams of traffic
Flying through the streets, I saw it again
You and the captain
His armies surround you
Leading me off the edge
Of the mighty mountain

The mountain's falling

David Lynch & John Neff, Mountains Falling, 2001

A choppy day of stabilization after the harsh drop on Friday.

Sell Signals triggered below 2793 but not much follow through on either occasion.

Price remains above the Sell Signal level and below the Buy Signal level.

Chart of S&P 500 for 26 March 2019

Be prepared for whatever is coming next, and trade with confidence:

To receive detailed daily analysis, guidance and the updated daily Buy / Sell trigger levels being generated by the Trading the Line system before the market opens, and intraday alerts when appropriate, please become a Member and Sign up for Alerts & Observations – includes access to Members Area and the Explanatory Notes for all of the concepts discussed.

Disclaimer: This is the diary of a personal trading system, its methodology and the signals that it is producing. You are welcome to follow along but please understand that the information presented here is for educational purposes only. No recommendations are being made to buy, or sell stocks, options or futures contracts. Please consult your own financial advisor before making any investment decisions.


S/T SELL Signal at 2793

S/T Sell Signals triggered at 2793 on 2 occasions but little follow through on either.

Stopped out of the first signal at 2804 and covered the second signal at the close at 2798.

Market in stabilization mode.

Medal

When night comes down
You lock the door.
The book falls to the floor.
As darkness falls
The waves roll by,
The seasons change
The wind is wry.

Now wakes the hour
Now sleeps the swan
Behold the dream
The dream is gone.
Green fields are calling
It's falling, in a golden door.

Pink Floyd, A Pillow of Winds, 1971, from Meddle
(Roger Waters, David Gilmour)

An about turn as the market finds price unsustainable at the upper extreme of the channel and profit-taking becomes strong selling.

Price moves below the Cover Signal level at 2825 and the T volume oscillator drops significantly below the important zero level.

A strong upward move followed by a collapse in price and breadth is characteristic of the end of a T structure and this has occurred just prior to an important projection for a high relative to the all time high in September 2018.

We should expect to see price look for a low or series of lows, and stabilize prior to the next advance.

We await the next signal.

Chart of S&P 500 for 25 March 2019

Be prepared for whatever is coming next, and trade with confidence:

To receive detailed daily analysis, guidance and the updated daily Buy / Sell trigger levels being generated by the Trading the Line system before the market opens, and intraday alerts when appropriate, please become a Member and Sign up for Alerts & Observations – includes access to Members Area and the Explanatory Notes for all of the concepts discussed.

Disclaimer: This is the diary of a personal trading system, its methodology and the signals that it is producing. You are welcome to follow along but please understand that the information presented here is for educational purposes only. No recommendations are being made to buy, or sell stocks, options or futures contracts. Please consult your own financial advisor before making any investment decisions.


COVER Signal at 2825

The market drops hard and volatility returns with a vengeance, revealing yesterday's rally to be an exhaustion move, followed by a lack of buying power – the characteristic of the end of a T structure.

A Cover Signal at 2825 is triggered and although there was some strong buying in the afternoon, the collapse in price in the last hour says it all.

So now we await the next signal.

The river is everywhere

"Have you also learned that secret from the river; that there is no such thing as time?" That the river is everywhere at the same time, at the source and at the mouth, at the waterfall, at the ferry, at the current, in the ocean and in the mountains, everywhere and that the present only exists for it, not the shadow of the past nor the shadow of the future.

Hermann Hesse, Siddhartha, 1922

The market throws caution to the wind and heads higher in a buying and short-covering frenzy that places price back near the upper extreme of the channel.

Today is a scheduled pulse high and the Put/Call ratios flash a warning that the market is not surprisingly somewhat vulnerable to a decline.

The oscillators remain subdued considering the rapid advance in price.

Chart of S&P 500 for 22 March 2019

Be prepared for whatever is coming next, and trade with confidence:

To receive detailed daily analysis, guidance and the updated daily Buy / Sell trigger levels being generated by the Trading the Line system before the market opens, and intraday alerts when appropriate, please become a Member and Sign up for Alerts & Observations – includes access to Members Area and the Explanatory Notes for all of the concepts discussed.

Disclaimer: This is the diary of a personal trading system, its methodology and the signals that it is producing. You are welcome to follow along but please understand that the information presented here is for educational purposes only. No recommendations are being made to buy, or sell stocks, options or futures contracts. Please consult your own financial advisor before making any investment decisions.