Eclipse

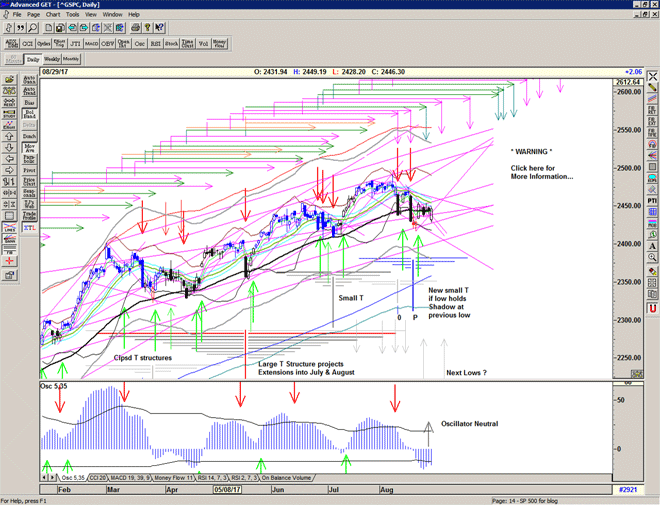
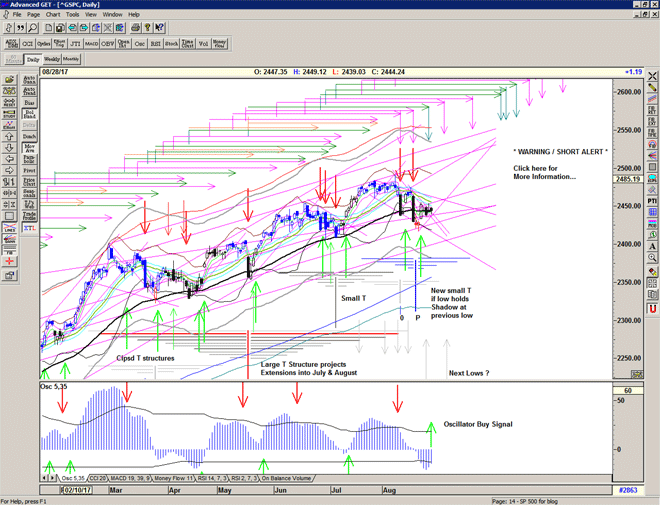
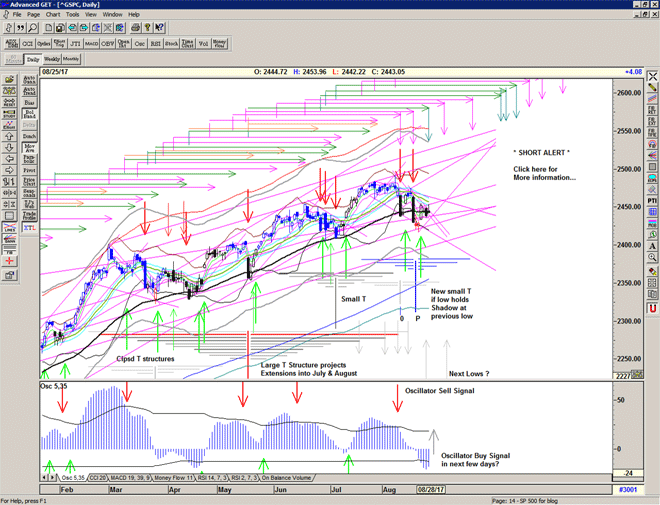
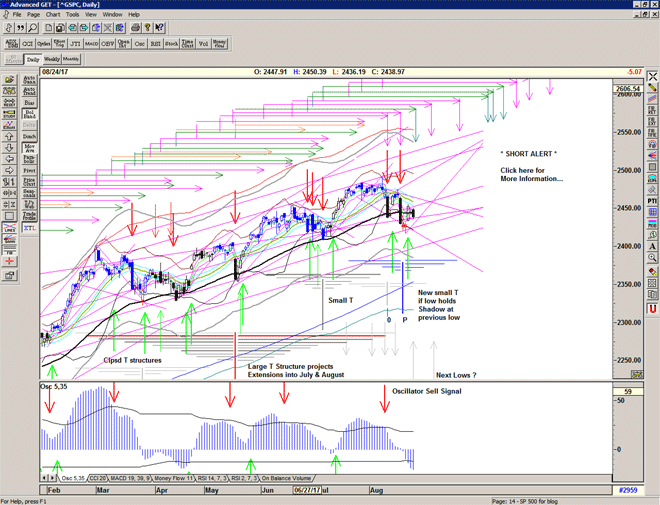
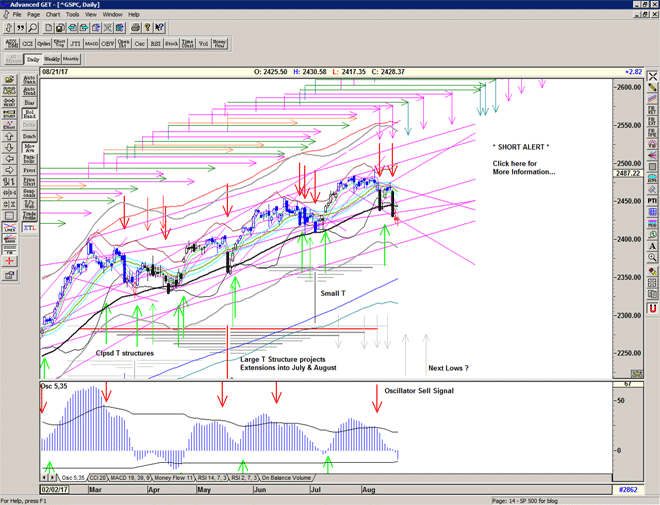
An attempt to recover the 55 ema stalls and the selling resumes into the week's close.

A visit to the lower reaches of the channel seems more and more likely as the market starts to stair-step downwards.

Chart of S&P 500 for 20 August 2017

Be prepared for whatever comes next:

To receive detailed daily analysis, guidance and the updated daily Buy / Sell trigger levels being generated by the Trading the Line system before the market opens, and intraday alerts when appropriate, please become a Member and Sign up for Alerts & Observations – includes access to Members Area and the Explanatory Notes for all of the concepts discussed.

Disclaimer: This is the diary of a personal trading system, its methodology and the signals that it is producing. You are welcome to follow along but please understand that the information presented here is for educational purposes only. No recommendations are being made to buy, or sell stocks, options or futures contracts. Please consult your own financial advisor before making any investment decisions.


Gravelotte

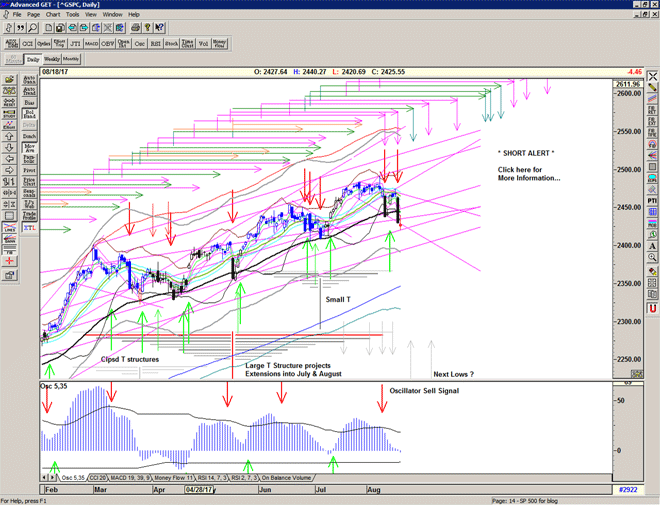
Another Sell Signal at an Echo high after a short-lived Buy Signal, after another kiss good-bye, and a significant drop below the 55 ema as the market starts to define a descending channel.

Again, look for stabilisation in price and oscillators before the next advance, as the market looks to build a platform for the next large T structure.

Chart of S&P 500 for 18 August 2017

Be prepared for whatever comes next:

To receive detailed daily analysis, guidance and the updated daily Buy / Sell trigger levels being generated by the Trading the Line system before the market opens, and intraday alerts when appropriate, please become a Member and Sign up for Alerts & Observations – includes access to Members Area and the Explanatory Notes for all of the concepts discussed.

Disclaimer: This is the diary of a personal trading system, its methodology and the signals that it is producing. You are welcome to follow along but please understand that the information presented here is for educational purposes only. No recommendations are being made to buy, or sell stocks, options or futures contracts. Please consult your own financial advisor before making any investment decisions.


Verneuil

An attempt to move higher is rejected at 2475 as the market finds declining resistance from the recent highs and meets the important rising line from the Election low – a kiss good-bye perhaps?

Still above the Buy Signal line but today is an Echo high which could add some fuel to any further selling.

Some improvements in the oscillators but not yet out of the woods.

Chart of S&P 500 for 17 August 2017

Be prepared for whatever comes next:

To receive detailed daily analysis, guidance and the updated daily Buy / Sell trigger levels being generated by the Trading the Line system before the market opens, and intraday alerts when appropriate, please become a Member and Sign up for Alerts & Observations – includes access to Members Area and the Explanatory Notes for all of the concepts discussed.

Disclaimer: This is the diary of a personal trading system, its methodology and the signals that it is producing. You are welcome to follow along but please understand that the information presented here is for educational purposes only. No recommendations are being made to buy, or sell stocks, options or futures contracts. Please consult your own financial advisor before making any investment decisions.


Peterloo

Still on a Buy Signal, but finding some resistance at the declining angle from the recent highs.

The final arm of the Large T structure centred at the 17 May low expires, and this could produce another wave of selling.

IF not we have a small T which isn't confirmed by the oscillator (yet) but projects highs next week and/or prior to the labor day holiday.

Chart of S&P 500 for 16 August 2017

Be prepared for whatever comes next:

To receive detailed daily analysis, guidance and the updated daily Buy / Sell trigger levels being generated by the Trading the Line system before the market opens, and intraday alerts when appropriate, please become a Member and Sign up for Alerts & Observations – includes access to Members Area and the Explanatory Notes for all of the concepts discussed.

Disclaimer: This is the diary of a personal trading system, its methodology and the signals that it is producing. You are welcome to follow along but please understand that the information presented here is for educational purposes only. No recommendations are being made to buy, or sell stocks, options or futures contracts. Please consult your own financial advisor before making any investment decisions.


India

A strong bounce through the Buy Signal level on a gap and go day and finding some resistance at the level where last week's selling started.

Not out of the woods yet – the possible small T looks good into late August, whereas the larger T structures are potentially projecting a peak here.

The Short alert is removed for now but we are only just above the warning level.

Chart of S&P 500 for 15 August 2017

Be prepared for whatever comes next:

To receive detailed daily analysis, guidance and the updated daily Buy / Sell trigger levels being generated by the Trading the Line system before the market opens, and intraday alerts when appropriate, please become a Member and Sign up for Alerts & Observations – includes access to Members Area and the Explanatory Notes for all of the concepts discussed.

Disclaimer: This is the diary of a personal trading system, its methodology and the signals that it is producing. You are welcome to follow along but please understand that the information presented here is for educational purposes only. No recommendations are being made to buy, or sell stocks, options or futures contracts. Please consult your own financial advisor before making any investment decisions.


Macbeth

Fair is foul, and foul is fair:
Hover through the fog and filthy air.

– William Shakespeare, Macbeth, c.1605

An attempt at a recovery at the important 55 ema, but showing some lack of conviction into the weekend.

IF the market stabilises and holds Thursday's low then we have the possibility of a small T projecting into 24 and 31 August.

IF not, the 55 ema is a key inflection point, and so a visit to the lower reaches of the gray channel and even the lower extreme channel become more likely, and this will in turn ultimately produce a larger T structure for the next recovery.

Chart of S&P 500 for 14 August 2017

Be prepared for whatever comes next:

To receive detailed daily analysis, guidance and the updated daily Buy / Sell trigger levels being generated by the Trading the Line system before the market opens, and intraday alerts when appropriate, please become a Member and Sign up for Alerts & Observations – includes access to Members Area and the Explanatory Notes for all of the concepts discussed.

Disclaimer: This is the diary of a personal trading system, its methodology and the signals that it is producing. You are welcome to follow along but please understand that the information presented here is for educational purposes only. No recommendations are being made to buy, or sell stocks, options or futures contracts. Please consult your own financial advisor before making any investment decisions.


Exodus

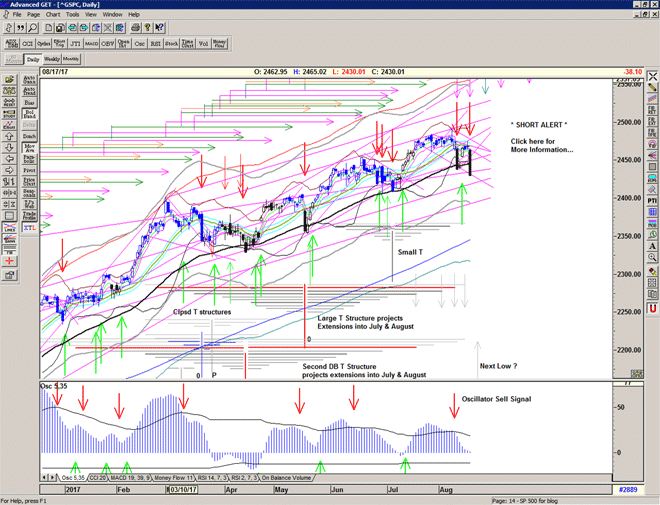
A decisive breakdown at the echo high and penultimate arm of the most recent Large T structures suggests that these structures are now complete and we should look for a new low to form a new T structure, as the market retreats from the recent all time high.

Interestingly, this breakdown also violates the long-standing rising support line from the Election low as well as the important 55 ema, suggesting that the whole Trump rally is now complete and that we may need to see some sideways and downwards corrective action, perhaps into the Fall, before the bull resumes its search for higher prices.

Of course an oversold bounce is still quite likely, and several indicators are at readings associated with short term lows.

Watch the T volume oscillator for signs of bullish divergence with price for hints of a recovery in the days or weeks to come.

Chart of S&P 500 for 11 August 2017

Be prepared for whatever comes next:

To receive detailed daily analysis, guidance and the updated daily Buy / Sell trigger levels being generated by the Trading the Line system before the market opens, and intraday alerts when appropriate, please become a Member and Sign up for Alerts & Observations – includes access to Members Area and the Explanatory Notes for all of the concepts discussed.

Disclaimer: This is the diary of a personal trading system, its methodology and the signals that it is producing. You are welcome to follow along but please understand that the information presented here is for educational purposes only. No recommendations are being made to buy, or sell stocks, options or futures contracts. Please consult your own financial advisor before making any investment decisions.


Magellan

A strong bounce off the important rising line at the penultimate arm of the current large T structure, but further deterioration in the oscillators suggests some distribution is occurring.
An echo high is scheduled for today.

Chart of S&P 500 for 10 August 2017

Be prepared for whatever comes next:

To receive detailed daily analysis, guidance and the updated daily Buy / Sell trigger levels being generated by the Trading the Line system before the market opens, and intraday alerts when appropriate, please become a Member and Sign up for Alerts & Observations – includes access to Members Area and the Explanatory Notes for all of the concepts discussed.

Disclaimer: This is the diary of a personal trading system, its methodology and the signals that it is producing. You are welcome to follow along but please understand that the information presented here is for educational purposes only. No recommendations are being made to buy, or sell stocks, options or futures contracts. Please consult your own financial advisor before making any investment decisions.

Fat Man

"Fat Man" was the codename for the atomic bomb that was detonated over the Japanese city of Nagasaki by the United States on 9 August 1945. It was the second of the only two nuclear weapons ever used in warfare, the first being "Little Boy", and its detonation marked the third-ever man-made nuclear explosion in history.
– Wikipedia

Testing a new high, perhaps a kiss goodbye and a reversal.

Still holding up above the Buy Signal level but a Warning is in development.

Chart of S&P 500 for 09 August 2017

Be prepared for whatever comes next:

To receive detailed daily analysis, guidance and the updated daily Buy / Sell trigger levels being generated by the Trading the Line system before the market opens, and intraday alerts when appropriate, please become a Member and Sign up for Alerts & Observations – includes access to Members Area and the Explanatory Notes for all of the concepts discussed.

Disclaimer: This is the diary of a personal trading system, its methodology and the signals that it is producing. You are welcome to follow along but please understand that the information presented here is for educational purposes only. No recommendations are being made to buy, or sell stocks, options or futures contracts. Please consult your own financial advisor before making any investment decisions.


Gravelines

At the end of the small T structure, and attempting to grind higher – the low volatilty drift continues.

The T volume oscillator remains negative and the OSc oscillator is neutral and close to a Sell Signal.

Chart of S&P 500 for 08 August 2017

Be prepared for whatever comes next:

To receive detailed daily analysis, guidance and the updated daily Buy / Sell trigger levels being generated by the Trading the Line system before the market opens, and intraday alerts when appropriate, please become a Member and Sign up for Alerts & Observations – includes access to Members Area and the Explanatory Notes for all of the concepts discussed.

Disclaimer: This is the diary of a personal trading system, its methodology and the signals that it is producing. You are welcome to follow along but please understand that the information presented here is for educational purposes only. No recommendations are being made to buy, or sell stocks, options or futures contracts. Please consult your own financial advisor before making any investment decisions.