In the Forest

In the forest lives a monster
he has done terrible things
so in the wood it's hiding
And this is the song he sings

Who will love me now
Who will ever love me?
Who will say to me
You are my desire
I'll set you free

(Who will love me now)
Who will forgive and make me live again
Who will bring me back to the world again
(to the world again)

PJ Harvey, Who Will Love Me Now?, 1998

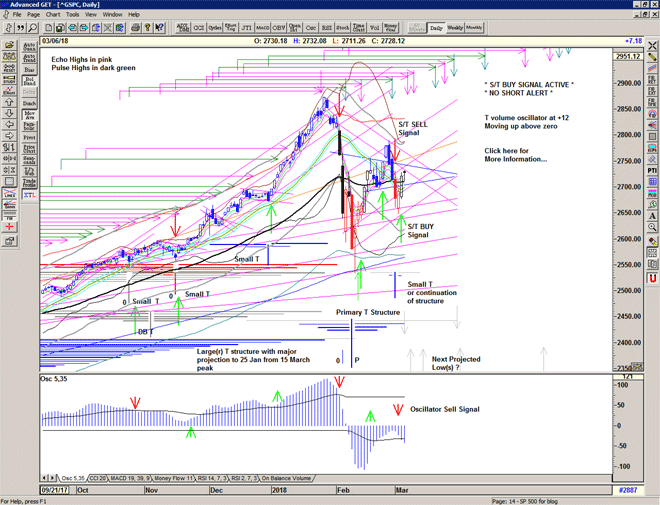
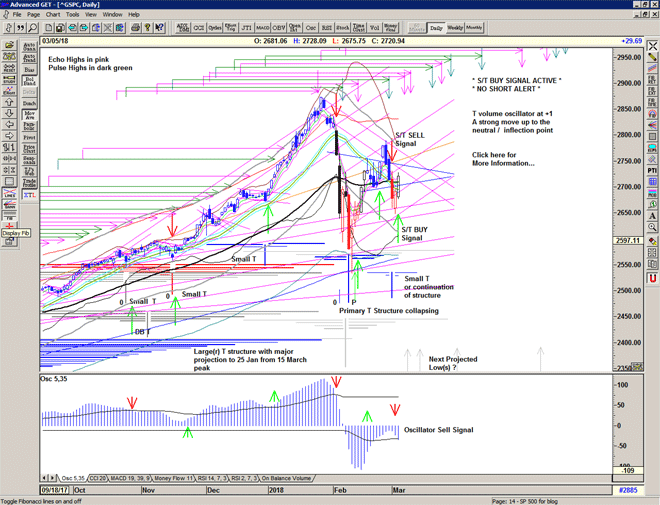
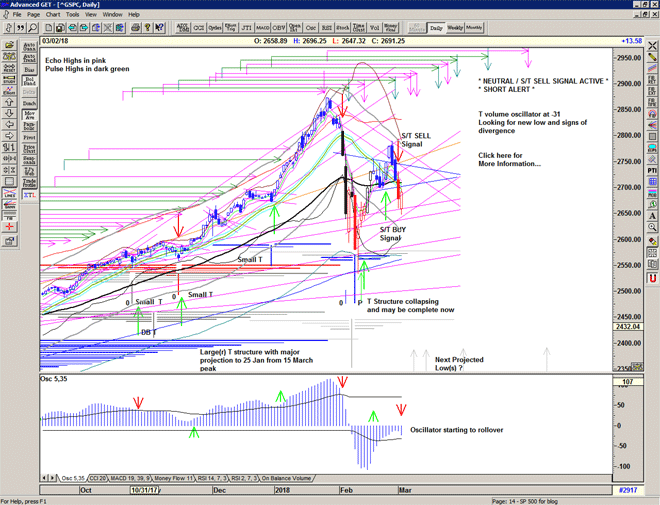
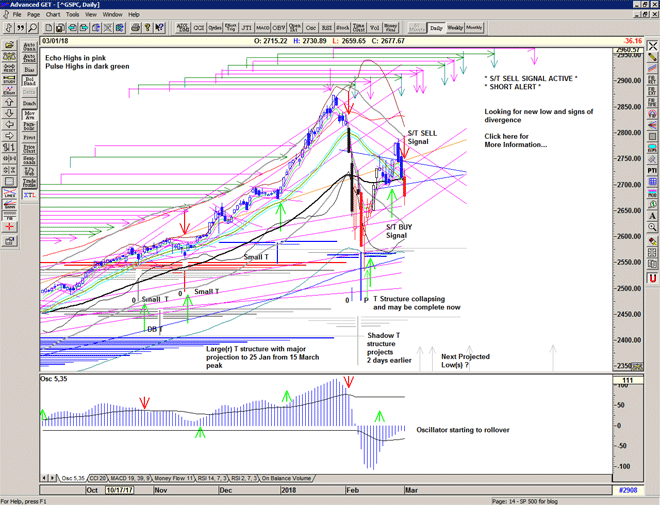
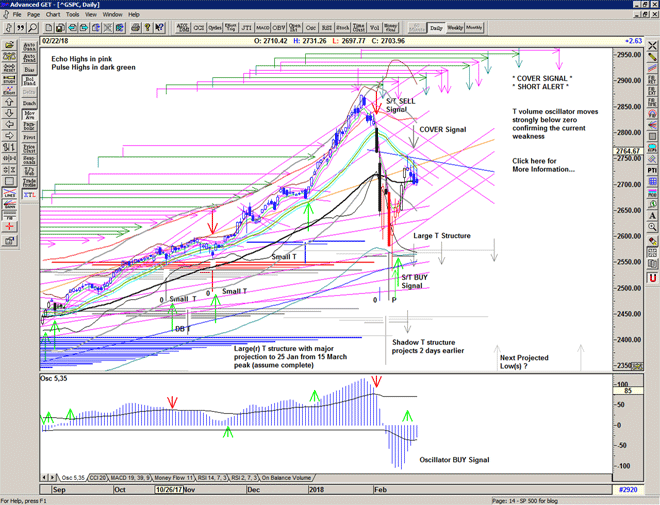
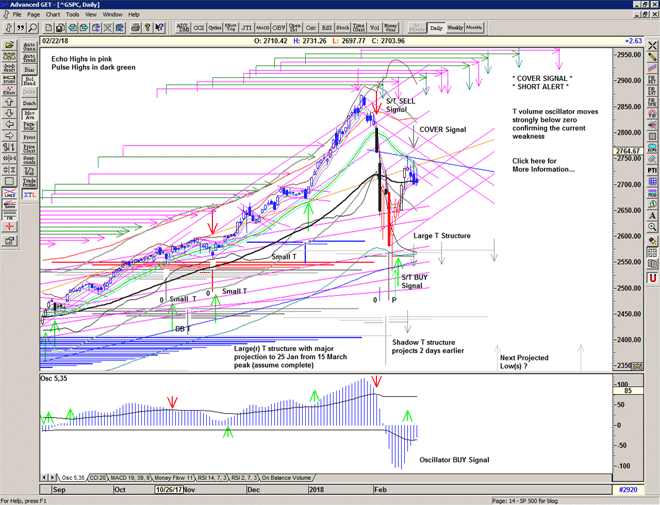
The Market gaps up and heads higher finding support above 2725 into the Fed announcement that adds a burst of adrenalin and a surge into 2747.

Unfortunately the market then reacts violently and the resulting sell off continues into the close and triggers a Cover Signal at 2701. Something is wrong.

The T volume oscillator drops hard below zero and the negative action in price raises a short alert and the possibility of further selling.

Again the market behaves in a a violent and unpredictable manner in-line with the high levels of volatility indicated by the Vix.

Dangerous market conditions continue.

Chart of S&P 500 for 22 February 2018

Be prepared for whatever is coming next, and trade with confidence:

To receive detailed daily analysis, guidance and the updated daily Buy / Sell trigger levels being generated by the Trading the Line system before the market opens, and intraday alerts when appropriate, please become a Member and Sign up for Alerts & Observations – includes access to Members Area and the Explanatory Notes for all of the concepts discussed.

Disclaimer: This is the diary of a personal trading system, its methodology and the signals that it is producing. You are welcome to follow along but please understand that the information presented here is for educational purposes only. No recommendations are being made to buy, or sell stocks, options or futures contracts. Please consult your own financial advisor before making any investment decisions.


Valverde

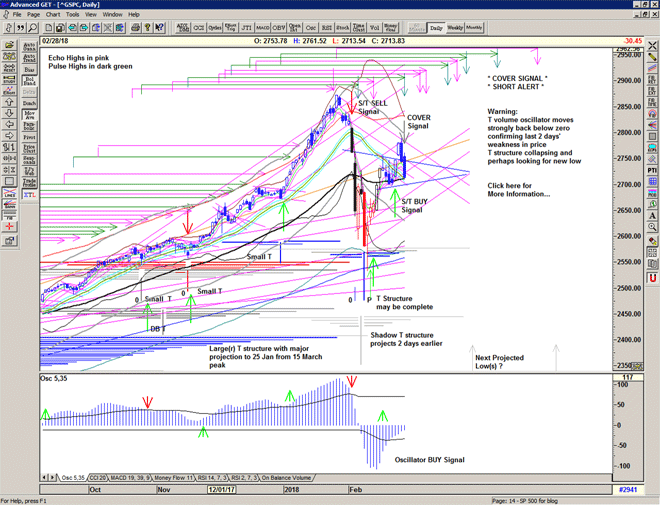
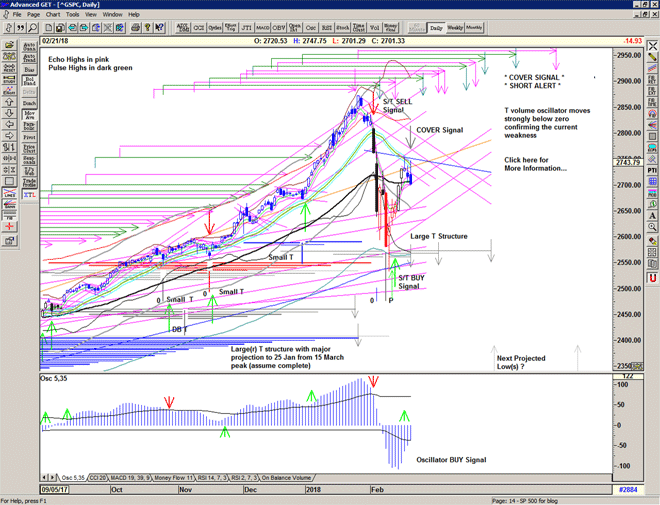
A negative development as the Market continues Friday's weakness looking for support and direction.

The T volume oscillator drops to just below zero flashing a warning sign.

There should be strong support in the vicinity of 2700 and a bounce here would be encouraging, but further weakness could certainly send the market much lower looking for another level of support.

Watch carefully for signs of strength or weakness at this level.

Chart of S&P 500 for 21 February 2018

Be prepared for whatever is coming next, and trade with confidence:

To receive detailed daily analysis, guidance and the updated daily Buy / Sell trigger levels being generated by the Trading the Line system before the market opens, and intraday alerts when appropriate, please become a Member and Sign up for Alerts & Observations – includes access to Members Area and the Explanatory Notes for all of the concepts discussed.

Disclaimer: This is the diary of a personal trading system, its methodology and the signals that it is producing. You are welcome to follow along but please understand that the information presented here is for educational purposes only. No recommendations are being made to buy, or sell stocks, options or futures contracts. Please consult your own financial advisor before making any investment decisions.


Sacred Geometry

He deals the cards as a meditation
And those he plays never suspect
He doesn't play for the money he wins
He don't play for respect

He deals the cards to find the answer
The sacred geometry of chance
The hidden law of a probable outcome
The numbers lead a dance

Sting, Shape of My Heart, 1993
(Gordon Sumner, Dominic Miller)

Welcome to the Trading the Line Free Report.

On 09 February the market tested the 200 day moving average at 2530 – a major sweet spot for the S&Ps in a bull market – and bounced, with a vengeance, in a short covering rally that will be remembered for some time.

The subsequent move upwards through 2661 triggered an S/T Buy Signal and the market continued higher into the Mid-channel on Friday to make a short-term peak at 2754 and this, finally, initiated some profit-taking prior to the extended weekend. It was quite a week.

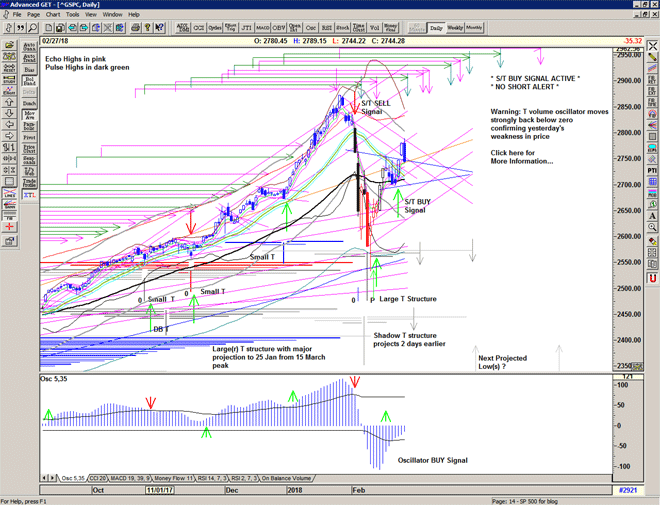
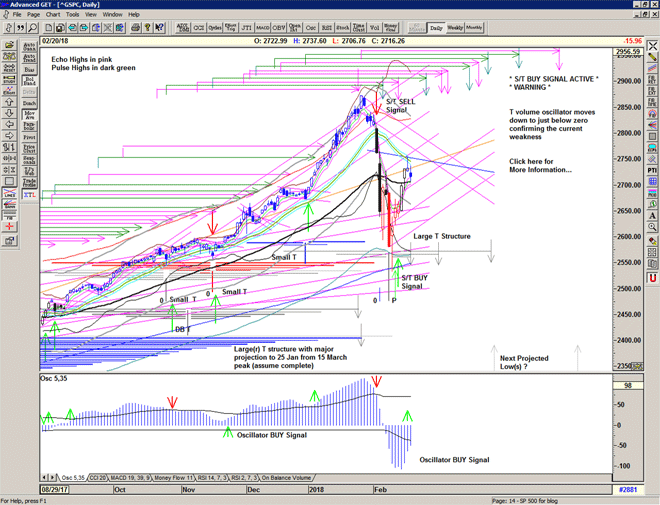
Chart of S&P 500 for 20 February 2018

Save the image to your desktop to view a larger version

Throughout this week the T volume oscillator has been rising upwards from a classic W pattern at a very low level – the signature of a new T structure being formed – and on 14 February it intersected the recent cash-build up line to confirm the prescence of a powerful T structure.

Strong momentum has also turned the OSc oscillator up from a deep low and makes a momentum Buy Signal.

The profit-taking at 2750 now raises the question: is that the end of the move?

Let's look at the evidence:

Very strong breadth and momentum indicated by the T volume oscillator and OSc oscillator support the current new T structure's projection for highs in the days and weeks to come.

A recovery of the market above a number of key moving averages provides technical support, at least for now.

Volatility remains elevated, and could easily trigger another slide in price to re-test either rising support lines or to look for renewed support at lower price levels.

Chart of S&P 500 for 20 February 2018

Save the image to your desktop to view a larger version

I am sometimes asked, what if you are wrong, what if the T structure isn't correct, what if the T structure turns 'bearish' and collapses?. And the answer is that you go with what you have before you, and let the market show you what is correct. This is why we use the S/T signalling system, and it will show you if we need to change our perspective.

The new T structure could collapse, and if it does we would look for a larger structure to develop in due course. We will continue to watch price and the oscillators for evidence. With volatility levels still very high, there is always the possibility of fast moves down, but likewise also fast moves back up.

Whether a pull-back into rising support is required, or whether Friday afternoon's selling is the beginning of another phase down is unclear. Watch the rising support lines and averages for confirmation of a continuation higher or the beginnings of another sell-down.

Price is currently still well above the S/T Buy Signal line and it may just be that the market got a little bit too far ahead of itself.

Chart of S&P 500 for 20 February 2018

Save the image to your desktop to view a larger version

As we can see from the bigger picture on a weekly chart, price became unstable above the long-term rising trend line from the 2014-2015 peaks.

Two weeks down, and one week back up.

The rapid recovery from what could be described as the lower level of a rising channel puts the market back on that trend line and how the market performs moving forward will be revealing.

For now, the long spike down to 2530 looks like an anomaly, an over-reaction, perhaps exacerbated by an explosion in volatility which undoubtably has seriously harmed a lot of traders and investors and will have taken a lot of stops out in the process.

If the market continues higher many of those shaken out by the disturbing and excessive daily range will ultimately be obliged to re-enter at higher prices and this is what provides further fuel for the bull market – the fear of missing out.

If the market pukes yet again, we may be looking at a more extensive corrective period but there will be plentiful supply at lower prices – buyers and sellers – to build a larger more powerful T structure.

Regardless, for now, it seems that 2018 has brought with it some very exciting trading and a range that is far beyond recent experience. We should expect it to continue and trade accordingly. This is a Brave New World.

In the meantime, the simplicity of my proprietary price based S/T Signalling System continues to keep us on the correct side of the market, providing a timely Buy signal and a green light again, for now

If you would like to learn more about using the S/T Signalling System please get in touch.

Be prepared for what is coming next and trade with confidence:

To receive detailed daily analysis, guidance and the updated daily Buy / Sell trigger levels being generated by the Trading the Line system before the market opens, and intraday alerts when appropriate, please become a Member and Sign up for Alerts & Observations – includes access to Members Area and the Explanatory Notes for all of the concepts discussed.


Presidio

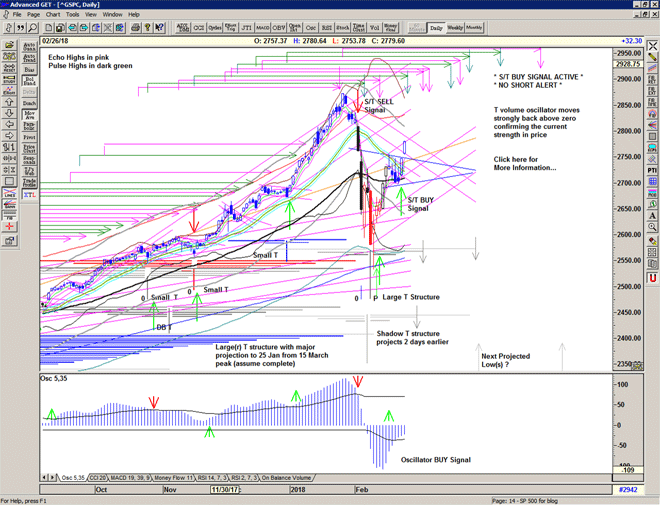
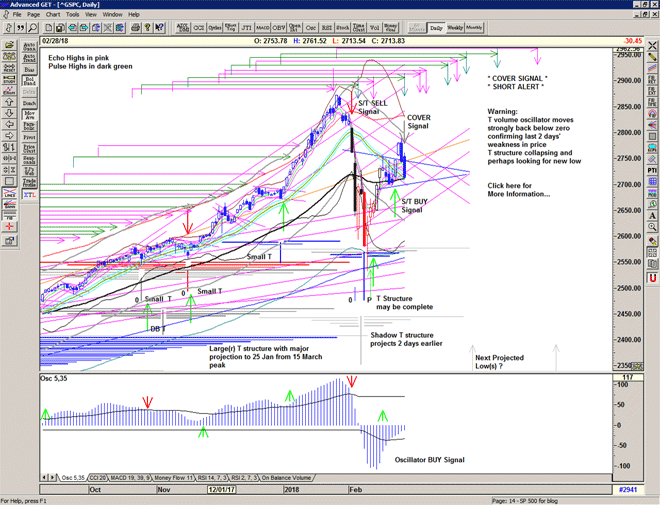
Market heads up into the Mid-channel to make a short-term peak at 2754 and this initiated some profit-taking prior to the extended weekend. It was quite a week after all.

The Osc oscillator makes a Buy Signal in-line with the strong momentum higher.

Whether a pull-back into rising support is required, or whether Friday afternoon's selling is the beginning of another phase down is unclear. Watch the rising support lines and averages for confirmation of a continuation higher or the beginnings of another sell-down.

Price still well above the Buy Signal line and it may just be that the market got a little bit too far ahead of itself.

Chart of S&P 500 for 19 February 2018

Be prepared for whatever is coming next, and trade with confidence:

To receive detailed daily analysis, guidance and the updated daily Buy / Sell trigger levels being generated by the Trading the Line system before the market opens, and intraday alerts when appropriate, please become a Member and Sign up for Alerts & Observations – includes access to Members Area and the Explanatory Notes for all of the concepts discussed.

Disclaimer: This is the diary of a personal trading system, its methodology and the signals that it is producing. You are welcome to follow along but please understand that the information presented here is for educational purposes only. No recommendations are being made to buy, or sell stocks, options or futures contracts. Please consult your own financial advisor before making any investment decisions.


Lupercalia

Lupercalia was a very ancient, possibly pre-Roman pastoral annual festival, observed in the city of Rome on February 15, to avert evil spirits and purify the city, releasing health and fertility. Lupercalia was also called "dies Februatus", purified (literally "februated day") after the instruments of purification called "februa", which give the month of February (Februarius) its name.

Wikipedia

The market continues to play catch me if you can, and the picture improves significantly.

A gap up open above the 55 ema with a quick spike down test is all, before another relentless move higher.

Cjhart of S&P 500 for 16 February 2018

 As you can see the T volume oscillator has moved upwards through the recent cash-build up line with a rising w pattern at the recent deep low and this confirms the new large T structure with the projections for highs in the weeks to come.

Because the market has now risen strongly above the 55 ema, a secondary low or double bottom seems less likely now, and the current Buy Signal continues with strong momentum.

Chart of S&P 500 for 16 February 2018

Be prepared for whatever is coming next, and trade with confidence:

To receive detailed daily analysis, guidance and the updated daily Buy / Sell trigger levels being generated by the Trading the Line system before the market opens, and intraday alerts when appropriate, please become a Member and Sign up for Alerts & Observations – includes access to Members Area and the Explanatory Notes for all of the concepts discussed.

Disclaimer: This is the diary of a personal trading system, its methodology and the signals that it is producing. You are welcome to follow along but please understand that the information presented here is for educational purposes only. No recommendations are being made to buy, or sell stocks, options or futures contracts. Please consult your own financial advisor before making any investment decisions.


There she goes

The wintergreen, the juniper
The cornflower and the chicory
All the words you said to me
Still vibrating in the air
The elm, the ash and the linden tree
The dark and deep, enchanted sea
The trembling moon and the stars unfurled
There she goes, my beautiful world

Nick Cave and the Bad Seeds, There She Goes my Beautiful World…, 2004


Quite a day, with a harsh mini-flash crash sell off in the Futures market prior to the open in reaction to the numbers issued. Quickly forgotten in early trade as the market held the Buy Signal level and then moved higher, rapidly. Buy Signal very much active, indeed.

The market regains its important short term averages, and the T volume oscillator moves up strongly through the recent cash-build up line and this now confirms the new Large T structure with projections for highs in late February and March.

The 4 day thrust higher from a panic low, a signature for the initiation of a long lasting move higher, adds to the bullish picture.

Chart of S&P 500 for 15 February 2018

Be prepared for whatever is coming next, and trade with confidence:

To receive detailed daily analysis, guidance and the updated daily Buy / Sell trigger levels being generated by the Trading the Line system before the market opens, and intraday alerts when appropriate, please become a Member and Sign up for Alerts & Observations – includes access to Members Area and the Explanatory Notes for all of the concepts discussed.

Disclaimer: This is the diary of a personal trading system, its methodology and the signals that it is producing. You are welcome to follow along but please understand that the information presented here is for educational purposes only. No recommendations are being made to buy, or sell stocks, options or futures contracts. Please consult your own financial advisor before making any investment decisions.


Gilgamesh

The epic of Gilgamesh
A pretty little black A-line dress
I give to you
The spinal cord of JFK
Wrapped in Marilyn Monroe's negligee
I give to you
I want nothing in return
Just the softest little breathless word
I ask of you
A word contained in a grain of sand
That can barely walk, can't even stand
I ask of you

C'mon baby, let's get out of the cold
And gimme, gimme, gimme your precious love for me to hold

Grinderman, Palace of Montezuma, 2010
Songwriters: Nick Cave, Warren Ellis, Martyn P. Casey, Jim Sclavunos

An S/T BUY Signal at 2661 confirmed at the close.

Short Alert still active.

A gap down at the open is gradually shrugged off and the market grinds higher and up into an S/T Buy Signal at 2661.

Caution still required due to the high volatility and recent collapse in price, but the signs are that the market is now improving.

Chart of S&P 500 for 14 February 2018

Be prepared for whatever is coming next, and trade with confidence:

To receive detailed daily analysis, guidance and the updated daily Buy / Sell trigger levels being generated by the Trading the Line system before the market opens, and intraday alerts when appropriate, please become a Member and Sign up for Alerts & Observations – includes access to Members Area and the Explanatory Notes for all of the concepts discussed.

Disclaimer: This is the diary of a personal trading system, its methodology and the signals that it is producing. You are welcome to follow along but please understand that the information presented here is for educational purposes only. No recommendations are being made to buy, or sell stocks, options or futures contracts. Please consult your own financial advisor before making any investment decisions.


Shades of Black

Everybody sees
And everyone agrees
That you and I are wrong
And it's been that way too long
Take it as it comes
And be thankful when it's done
There's so many ways to act
And there's many shades of black
There's so many shades of black

The Raconteurs, Many Shades of Black, 2008
(Songwriters: Jack White /Brendan Benson)

The market gaps up into 2650, fills the gap and finds support around 2625.

The subsequent move higher triggers an S/T BUY Signal which is not confirmed by the relatively weak close.

With the volatility levels still very high the risk of another sell-off is still high. Patience and caution is required.

Chart of S&P 500 for 13 February 2018

Be prepared for whatever is coming next, and trade with confidence:

To receive detailed daily analysis, guidance and the updated daily Buy / Sell trigger levels being generated by the Trading the Line system before the market opens, and intraday alerts when appropriate, please become a Member and Sign up for Alerts & Observations – includes access to Members Area and the Explanatory Notes for all of the concepts discussed.

Disclaimer: This is the diary of a personal trading system, its methodology and the signals that it is producing. You are welcome to follow along but please understand that the information presented here is for educational purposes only. No recommendations are being made to buy, or sell stocks, options or futures contracts. Please consult your own financial advisor before making any investment decisions.

Origin

“It is not the strongest of the species that survives,
not the most intelligent that survives.
It is the one that is the most adaptable to change.”

Charles Darwin

A deep probe below 2600 finally finds some strong support… at 2530 – which was strong support in the Futures market early last week and site of the 200 day moving average.

Looks like an important low, for now, with the T volume oscillator looking good and displaying positive divergence with price.

Chart of S&P 500 for 12 February 2018

Chart of S&P 500 for 12 February 2018

Be prepared for whatever is coming next, and trade with confidence:

To receive detailed daily analysis, guidance and the updated daily Buy / Sell trigger levels being generated by the Trading the Line system before the market opens, and intraday alerts when appropriate, please become a Member and Sign up for Alerts & Observations – includes access to Members Area and the Explanatory Notes for all of the concepts discussed.

Disclaimer: This is the diary of a personal trading system, its methodology and the signals that it is producing. You are welcome to follow along but please understand that the information presented here is for educational purposes only. No recommendations are being made to buy, or sell stocks, options or futures contracts. Please consult your own financial advisor before making any investment decisions.


In a state

My mind is in a state
'cause everything I miss it comes too late
So I try and disappear
But there is only one way out of here
This time, this time

My mind is in a state
But all I need to do is change my pace
And I know there's fear to face
But happiness is firm in its embrace

This time, this time

Unkle, In a State, 2003
Songwriters: Richard File / Antony Genn / James Lavelle

Market drops out of the box, following through from the previous day and starts selling, relentlessly.

Now heading towards the recent low established by the Futures market at 2530 and into the lower extremes of the channel.

Still looking for the market to establish a low or series of low which will define the next large T structure(s), because it is the selling that creates the necessary fuel for the next major advance.

Chart of S&P 500 for 09 February 2018

Be prepared for whatever is coming next, and trade with confidence:

To receive detailed daily analysis, guidance and the updated daily Buy / Sell trigger levels being generated by the Trading the Line system before the market opens, and intraday alerts when appropriate, please become a Member and Sign up for Alerts & Observations – includes access to Members Area and the Explanatory Notes for all of the concepts discussed.

Disclaimer: This is the diary of a personal trading system, its methodology and the signals that it is producing. You are welcome to follow along but please understand that the information presented here is for educational purposes only. No recommendations are being made to buy, or sell stocks, options or futures contracts. Please consult your own financial advisor before making any investment decisions.