Lay in wait for an answer

Here we are
Burning up in our cars
And in our hearts
Better days
Sleeping late with a headache
Perfect weather
Congregate
Lay in wait for an answer
They're still waiting
With your tea
Lucky tips as the day breaks
The blind are leading the blind

UNKLE featuring Big in Japan, The Answer, 2010

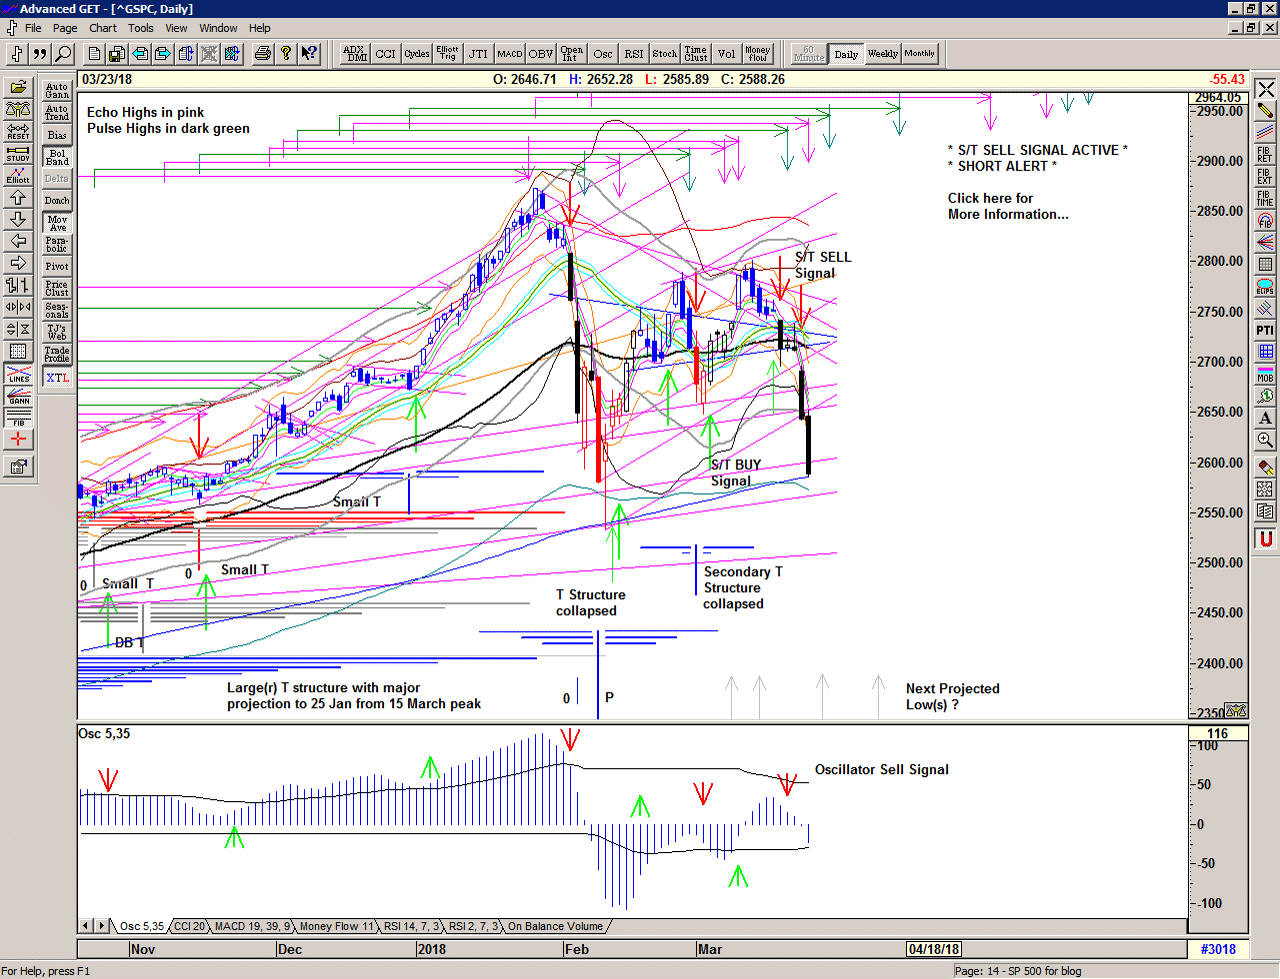
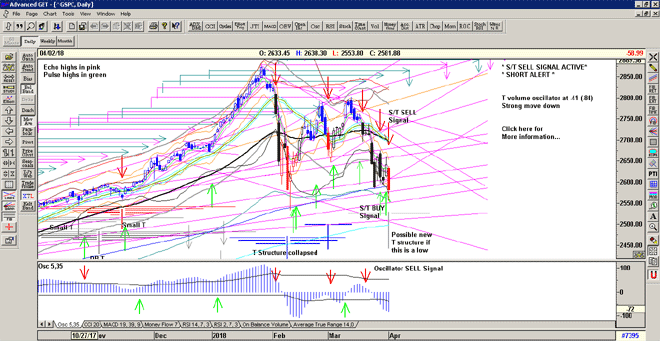
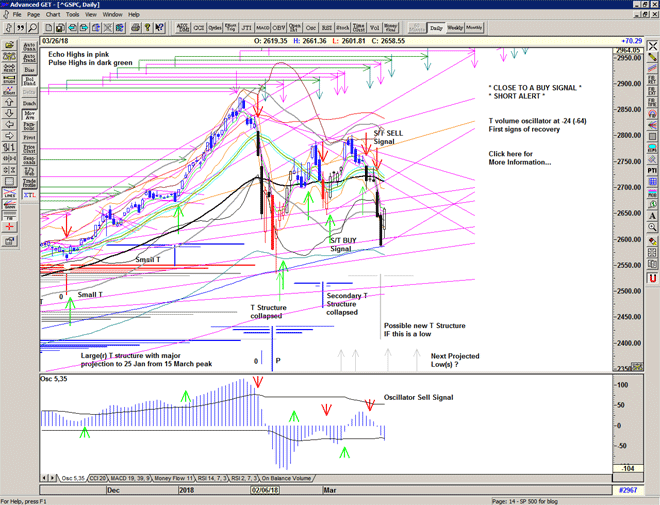
A big drop gap down at the open and an early attempt to recovery is quickly sold down into the 2660s.

A recovery back to the 2680s looks good but fails and rolls over in afternoon trade with relentless selling into the close.

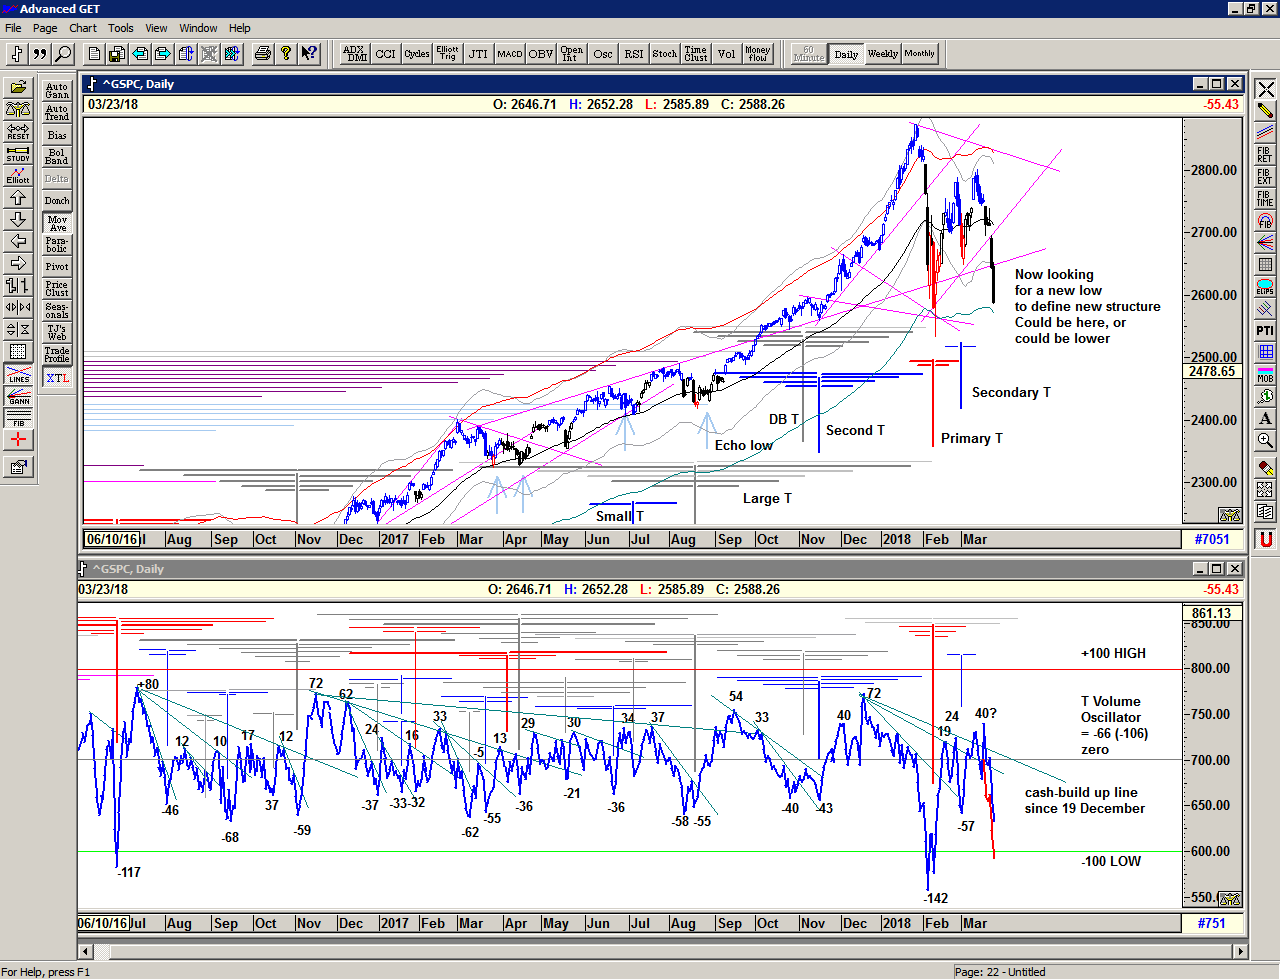
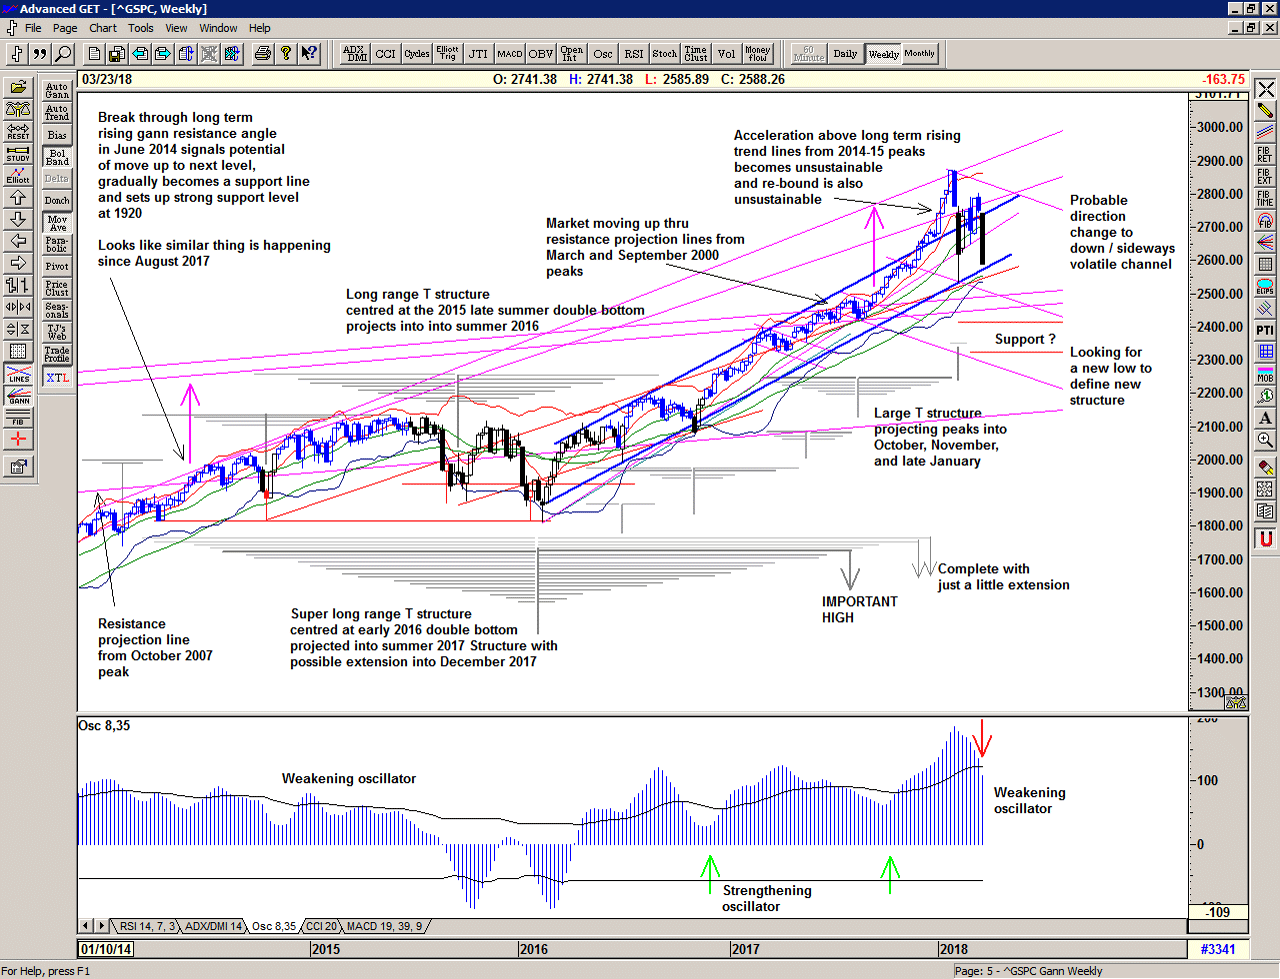
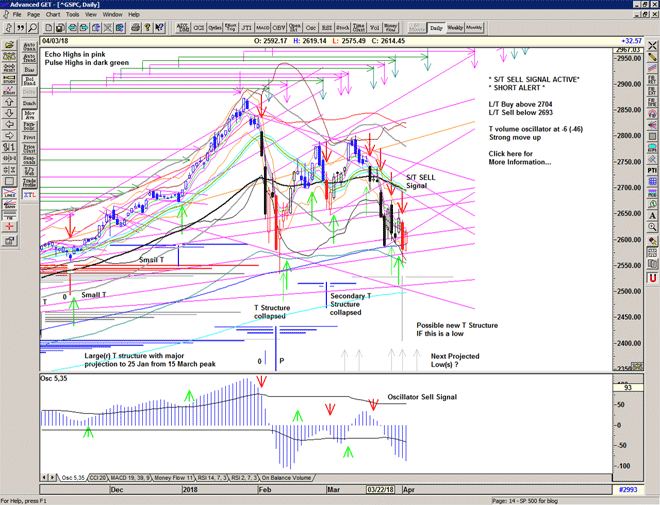
This week has continued the breakdown of the the structures from the 09 March high and now leaves a curious M shape that looks to be fundamentally challenging direction moving forward, and suggests a deeper low ahead of us.

Chart of S&P 500 for 23 March 2018

Be prepared for whatever is coming next, and trade with confidence:

To receive detailed daily analysis, guidance and the updated daily Buy / Sell trigger levels being generated by the Trading the Line system before the market opens, and intraday alerts when appropriate, please become a Member and Sign up for Alerts & Observations – includes access to Members Area and the Explanatory Notes for all of the concepts discussed.

Disclaimer: This is the diary of a personal trading system, its methodology and the signals that it is producing. You are welcome to follow along but please understand that the information presented here is for educational purposes only. No recommendations are being made to buy, or sell stocks, options or futures contracts. Please consult your own financial advisor before making any investment decisions.

 

Everybody Hurts

When your day is long
And the night
The night is yours alone
When you're sure you've had enough
Of this life
Well hang on
Don't let yourself go
'Cause everybody cries
And everybody hurts sometimes

R.E.M., Everybody Hurts, 1992
Songwriters: Bill Berry / Michael Stipe / Peter Buck / Michael Mills

(Great cover version by Patti Smith, 2007)

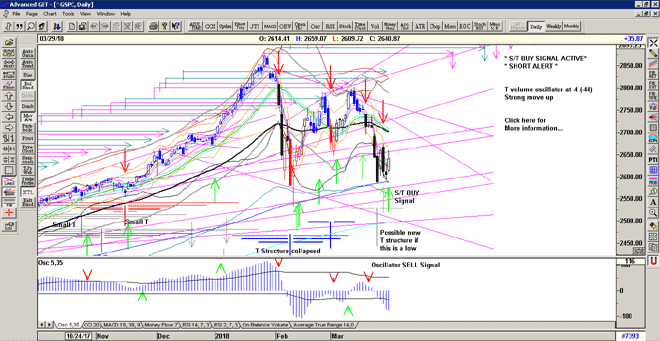
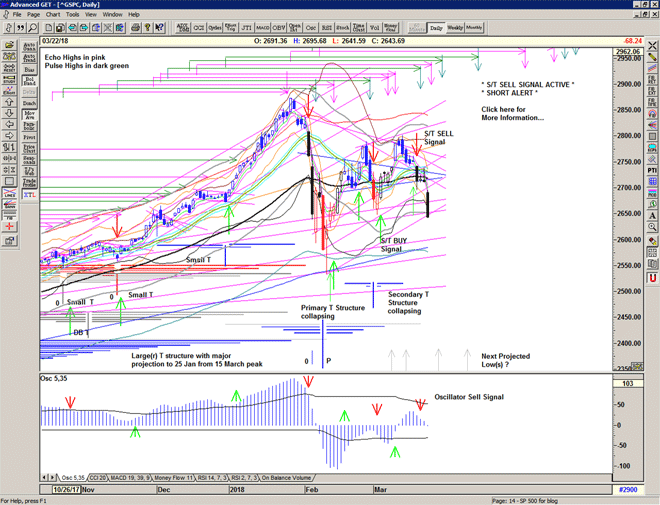
Another wild day with the focus upon the FED.

A grind into 2738 followed by a selloff back down to the lows of the day at 2710.

Still below the Sell Signal level and looking like the selling resumed.

Chart of S&P 500 for 22 March 2018

Be prepared for whatever is coming next, and trade with confidence:

To receive detailed daily analysis, guidance and the updated daily Buy / Sell trigger levels being generated by the Trading the Line system before the market opens, and intraday alerts when appropriate, please become a Member and Sign up for Alerts & Observations – includes access to Members Area and the Explanatory Notes for all of the concepts discussed.

Disclaimer: This is the diary of a personal trading system, its methodology and the signals that it is producing. You are welcome to follow along but please understand that the information presented here is for educational purposes only. No recommendations are being made to buy, or sell stocks, options or futures contracts. Please consult your own financial advisor before making any investment decisions.


Yellow haze of the sun

Well, I dreamed I saw the silver
Space ships flying
In the yellow haze of the sun,
There were children crying
And colors flying
All around the chosen ones.
All in a dream, all in a dream
The loading had begun.
They were flying Mother Nature's
Silver seed to a new home in the sun.
Flying Mother Nature's
Silver seed to a new home.

Neil Young, After the Gold Rush, 1970

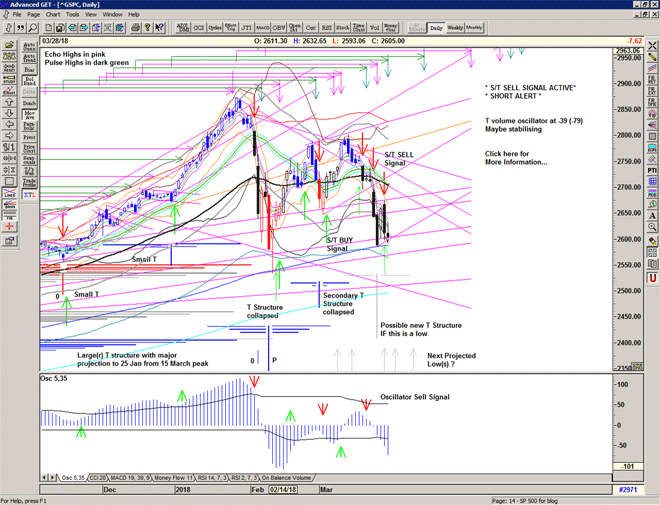
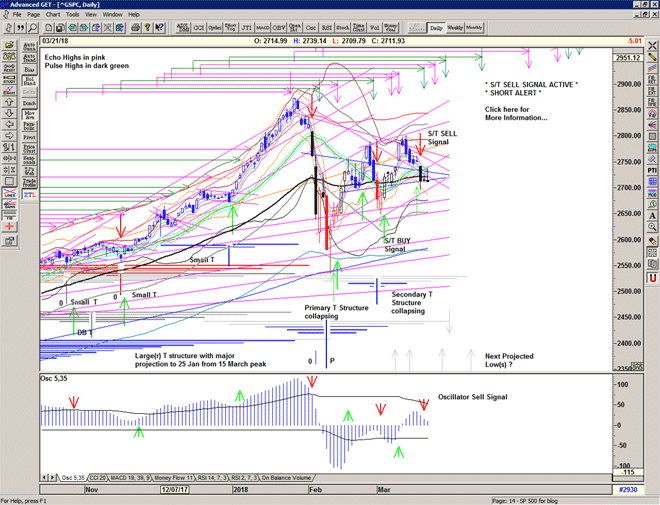
A day of stabilisation after Monday's heavy selling.

Still below the Sell Signal level but holding up above 2710, for now.

Chart of S&P 500 for 20 March 2018

Be prepared for whatever is coming next, and trade with confidence:

To receive detailed daily analysis, guidance and the updated daily Buy / Sell trigger levels being generated by the Trading the Line system before the market opens, and intraday alerts when appropriate, please become a Member and Sign up for Alerts & Observations – includes access to Members Area and the Explanatory Notes for all of the concepts discussed.

Disclaimer: This is the diary of a personal trading system, its methodology and the signals that it is producing. You are welcome to follow along but please understand that the information presented here is for educational purposes only. No recommendations are being made to buy, or sell stocks, options or futures contracts. Please consult your own financial advisor before making any investment decisions.


Another kind of strange

Every card he drew
Had a different face
Lingering and lost
Unholy holy ghosts
I tend to play them all
He spoke with confidence
Another kind of strange
To shift in loneliness

Patti Smith, Nine, 2012

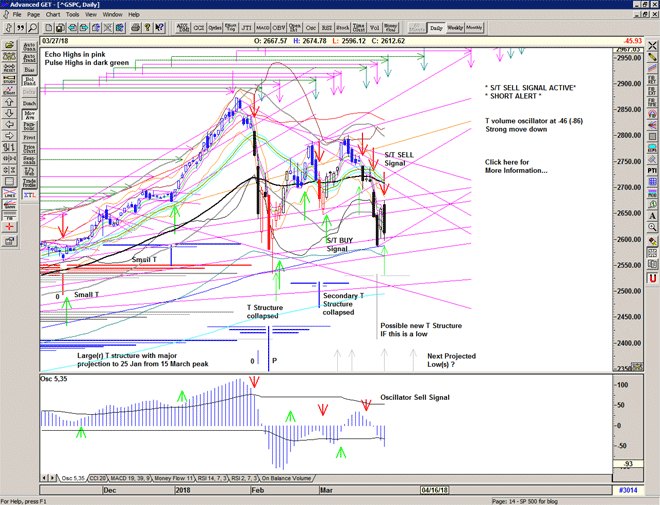
A weak start to the week and the market triggers an S/T Sell Signal in early trade at 2729.

Straight down into 2700.

Some buying interest at 2695 on a second bounce at a level below the amber channel helps to turn the market around in the afternoon.

Covered at 2710 on expectation of some relief to the strong selling but the Sell Signal is still active.

An Osc Sell Signal imminent.

And a pulse high today.

Chart of S&P 500 for 20 March 2018

Be prepared for whatever is coming next, and trade with confidence:

To receive detailed daily analysis, guidance and the updated daily Buy / Sell trigger levels being generated by the Trading the Line system before the market opens, and intraday alerts when appropriate, please become a Member and Sign up for Alerts & Observations – includes access to Members Area and the Explanatory Notes for all of the concepts discussed.

Disclaimer: This is the diary of a personal trading system, its methodology and the signals that it is producing. You are welcome to follow along but please understand that the information presented here is for educational purposes only. No recommendations are being made to buy, or sell stocks, options or futures contracts. Please consult your own financial advisor before making any investment decisions.


Sinnerman

Oh, sinnerman, where you gonna run to?
Sinnerman where you gonna run to?
Where you gonna run to?
All on that day
We got to run to the rock
Please hide me, I run to the rock
Please hide me, run to the rock
Please hide here
All on that day
But the rock cried out
I can't hide you, the rock cried out
I ain't gonna hide you there
All on that day
I said rock
What's the matter with you rock?
Don't you see I need you, rock?
Good Lord, Lord
All on that day
So I run to the river
It was bleedin', I run to the sea
It was bleedin', all on that day
So I run to the river
It was boilin', I run to the sea
It was boilin', all on that day

Nina Simone, Sinnerman, 1965

A disappointing week especially after the strong close on Friday 09 March.

However, the market retained its support and for now remains in neutral.

I suspect that a lot of the action and downward pressure was due to the considerable weight of quarterly option expiration, closing and rolling over of hedges etc.

The T volume oscillator moves up, considerably, due to the high volume of buying on Friday and this would normally be associated with a significant move up in price. I am slightly suspicious of this, maybe the data is not correct.

Chart of S&P 500 for 19 March 2018

Be prepared for whatever is coming next, and trade with confidence:

To receive detailed daily analysis, guidance and the updated daily Buy / Sell trigger levels being generated by the Trading the Line system before the market opens, and intraday alerts when appropriate, please become a Member and Sign up for Alerts & Observations – includes access to Members Area and the Explanatory Notes for all of the concepts discussed.

Disclaimer: This is the diary of a personal trading system, its methodology and the signals that it is producing. You are welcome to follow along but please understand that the information presented here is for educational purposes only. No recommendations are being made to buy, or sell stocks, options or futures contracts. Please consult your own financial advisor before making any investment decisions.


Like the rain

Every time she goes away, I feel the pain
I feel the same, it's like the rain
Every time I hear her name, I fall apart
This is the end, why do we start?
This is the only way, you go away
Be my friend, come back again
The only way, this is the only way
The only way, the only way

Tricky, The Only Way, 2017

The market continues to chop around looking for support. A quick move to 2763 finds sellers and in the afternoon the decline to 2742 finds some buyers.

The market remains neutral and volatile cancelling out last week's bullish stance, at least for now.

Chart of S&P 500 for 16 March 2018

Be prepared for whatever is coming next, and trade with confidence:

To receive detailed daily analysis, guidance and the updated daily Buy / Sell trigger levels being generated by the Trading the Line system before the market opens, and intraday alerts when appropriate, please become a Member and Sign up for Alerts & Observations – includes access to Members Area and the Explanatory Notes for all of the concepts discussed.

Disclaimer: This is the diary of a personal trading system, its methodology and the signals that it is producing. You are welcome to follow along but please understand that the information presented here is for educational purposes only. No recommendations are being made to buy, or sell stocks, options or futures contracts. Please consult your own financial advisor before making any investment decisions.

Ides of March

There is a tide in the affairs of men
Which, taken at the flood, leads on to fortune;
Omitted, all the voyage of their life
Is bound in shallows and in miseries.
On such a full sea are we now afloat;
And we must take the current when it serves,
Or lose our ventures.

William Shakespeare, Julius Caesar, c. 1599

A third down day as the market gaps up and sells yet again, triggering a cover Signal, and although the market did try to recover from 2745 it was not sustained and the relatively weak close confirms the cover signal for now.

The result is to erase Friday's huge move up and to reinforce the declining resistance from the highs, albeit at a shallower angle.

The T volume oscillator moves just below the important zero line, turning neutral and questioning the recent drive higher.

The market is unstable, and caution is advisable.

Chart of S&P 500 for 15 March 2018

Be prepared for whatever is coming next, and trade with confidence:

To receive detailed daily analysis, guidance and the updated daily Buy / Sell trigger levels being generated by the Trading the Line system before the market opens, and intraday alerts when appropriate, please become a Member and Sign up for Alerts & Observations – includes access to Members Area and the Explanatory Notes for all of the concepts discussed.

Disclaimer: This is the diary of a personal trading system, its methodology and the signals that it is producing. You are welcome to follow along but please understand that the information presented here is for educational purposes only. No recommendations are being made to buy, or sell stocks, options or futures contracts. Please consult your own financial advisor before making any investment decisions.


Anthrocene

Sit down beside me and I'll name it for you
Behold, behold
The heaven bound sea
The wind cast its shadow and moves for the tree
Behold the animals and the birds and the sky entire
I hear you been out there looking for something to set on fire
The head bow children fall to their knees
Humbled in the age of the Anthrocene

Nick Cave & The Bad Seeds, Anthrocene, 2016

A gap up and advance into 2800 is short-lived. The subsequent profit-taking turns into persistent selling as the market looks for support.

The result is an ugly reversal day exacerbated by fears that the return of volatility will push the market back down towards the recent lows.

As the market is still above the current Buy Signal level and some key support that still remains to be seen.

Chart of S&P 500 for 14 March 2018

Be prepared for whatever is coming next, and trade with confidence:

To receive detailed daily analysis, guidance and the updated daily Buy / Sell trigger levels being generated by the Trading the Line system before the market opens, and intraday alerts when appropriate, please become a Member and Sign up for Alerts & Observations – includes access to Members Area and the Explanatory Notes for all of the concepts discussed.

Disclaimer: This is the diary of a personal trading system, its methodology and the signals that it is producing. You are welcome to follow along but please understand that the information presented here is for educational purposes only. No recommendations are being made to buy, or sell stocks, options or futures contracts. Please consult your own financial advisor before making any investment decisions.


In Amber

Some go and some stay behind
Some never move at all
Girl in amber trapped forever, spinning down the hall
Let no part of her go unremembered, clothes across the floor
Girl in amber, slumber shuts the bathroom door
The phone, the phone, the phone it rings, it rings, it rings no more
The song, the song, the song it spins since nineteen eighty-four
The phone, the phone, the phone, it rings, the phone, it rings no more
The song, the song it's been spinning now since nineteen

And if you want to bleed, just bleed
And if you want to bleed, don't breathe a word
Just step away and let the world spin

Nick Cave & The Bad Seeds, Girl in Amber, 2016

The market opened higher and quickly found resistance at 2796.

Subsequent consolidation in the 2780-90 area has probably helped to relieve some of the pressure from the recent move higher. Good to see that the market did not sell off much of Friday's move.

Chart of S&P 500 for 13 March 2018

Be prepared for whatever is coming next, and trade with confidence:

To receive detailed daily analysis, guidance and the updated daily Buy / Sell trigger levels being generated by the Trading the Line system before the market opens, and intraday alerts when appropriate, please become a Member and Sign up for Alerts & Observations – includes access to Members Area and the Explanatory Notes for all of the concepts discussed.

Disclaimer: This is the diary of a personal trading system, its methodology and the signals that it is producing. You are welcome to follow along but please understand that the information presented here is for educational purposes only. No recommendations are being made to buy, or sell stocks, options or futures contracts. Please consult your own financial advisor before making any investment decisions.

The road that leads to everywhere

Take the road you know, the road that leads to everywhere
Spend the time where everyone and anyone is there
Something new's already old, we've heard it all before

In, out, in and out
Here by word of mouth
It's right here right now
Feel dead or alive

We'll be gone in a while
In the blinking of an eye
So give me quality time, baby
Quality time

UNKLE, The Road, 2017

Welcome to the Trading the Line Free Report.

Another exciting week, and a major development.

A Buy Signal on 05 March at 2713. The market stabilises and back-tests 2700, builds a platform, moves higher, builds another platform at 2725, and then… boom, the market bursts higher on Friday to gap up above 2750 and head for the recent high at 2780. A huge day that will of course leave many wondering… what's next?

Chart of S&P 500 for 12 March 2018

Save the image to your desktop to view a larger version

As you can see, the Osc oscillator is now rising and supporting the strong upward momentum, the market has moved upwards through the series of declining resistance lines from the all time high, the market has found recent support at the Mid-Channel and the gray channel has turned upwards. The general direction is now up.

Of course, we may need to see some stabilisation and profit-taking after Friday's strong move up, and the market is quite a long way above the curent Buy Signal level. Some caution is still required.

Chart of S&P 500 for 12 March 2018

Save the image to your desktop to view a larger version

However, the T volume oscillator is making a new relative high.

We can see from the T volume oscillator that we have a major low in place – with the oscillator rising strongly from a classic rising 'W' pattern at a very low level, and then we have another higher low, also with the oscillator rising strongly. The oscillator has risen upwards through the descending lines drawn from the oscillator peaks.

In T Theory these lines represent the period of cash-build up from the profit-taking and selling within the market as a whole because the oscillator is derived from the advance-decline volume of the NYSE.

As we can see the oscillator has been generally declining since a peak at 72 on 19 December, and made primary and secondary lows on 05 and 08 February. Each time the oscillator cuts upwards through the cash-build up line it confirms and activates this T structure. The market then uses the cash-build up from the left-hand side of the T to form the right-hand side of the T. Each wave of selling produces projections for highs within the T structure.

Friday's strong push upwards through the new higher cash build up line fully re-activates the Primary T structure and the Secondary T structure combining them into one powerful structure potentially releasing further strength to the upside, with the current full extent of the T structure now projecting highs towards the end of March. We should therefore see a general continuation higher into a peak at that time. If the oscillator rises above 72 it will also activate further sections of the previous cash-build ups. How the oscillator performs relative to price is therefore relevant.

Chart of S&P 500 for 12 March 2018

Save the image to your desktop to view a larger version

Zooming out to the weekly chart, we can see that price does not currently want to stay in the old channel – marked in blue.

The strong move up during the Fall of 2017 pushed the market up beyond the resistance projection lines from the 2000 peaks, and also through the rising trend lines from the 2014-15 peaks until it became unsustainable.

I suspect that a similar process is happening as did when the market started to move up through the resistance projection lines from the 2007 peak in 2014. The spike down to 2530 (like the spike down to 1820 in October 2014) now defines a very long term horizontal support line that we may need to revisit in the future, if or when the market cannot continue higher. As with the October 2014 low, it may be re-visited several times over several months in the process of building a major new structure, and a platform for higher prices.

For now, it seems likely that the market will continue to explore the higher prices and the region within the rising trend lines from 2014 and 2015.

2018 continues to bring with it some very exciting trading and a range that is far beyond the experience of recent years. We should expect it to continue and trade accordingly. This is a Brave New World.

In the meantime, the simplicity of my proprietary price based S/T Signalling System continues to keep us on the correct side of the market, providing a timely Buy signal and a green light again, for now.

If you would like to learn more about using the S/T Signalling System please get in touch.

Be prepared for whatever is coming next, and trade with confidence:

To receive detailed daily analysis, guidance and the updated daily Buy / Sell trigger levels being generated by the Trading the Line system before the market opens, and intraday alerts when appropriate, please become a Member and Sign up for Alerts & Observations – includes access to Members Area and the Explanatory Notes for all of the concepts discussed.

Disclaimer: This is the diary of a personal trading system, its methodology and the signals that it is producing. You are welcome to follow along but please understand that the information presented here is for educational purposes only. No recommendations are being made to buy, or sell stocks, options or futures contracts. Please consult your own financial advisor before making any investment decisions.