Eagle come down

Above the mountain, the mountain
An eagle is flying

High above the mountain
An eagle come down
To the soldier who falters
The soldier on the ground

By the mountain
I feel nothing
For in my own heart
Every tree is broken

The first tree will not blossom
The second will not grow
The third is almost fallen
Since you betrayed me so, since you 

PJ Harvey, The Mountain, 2007

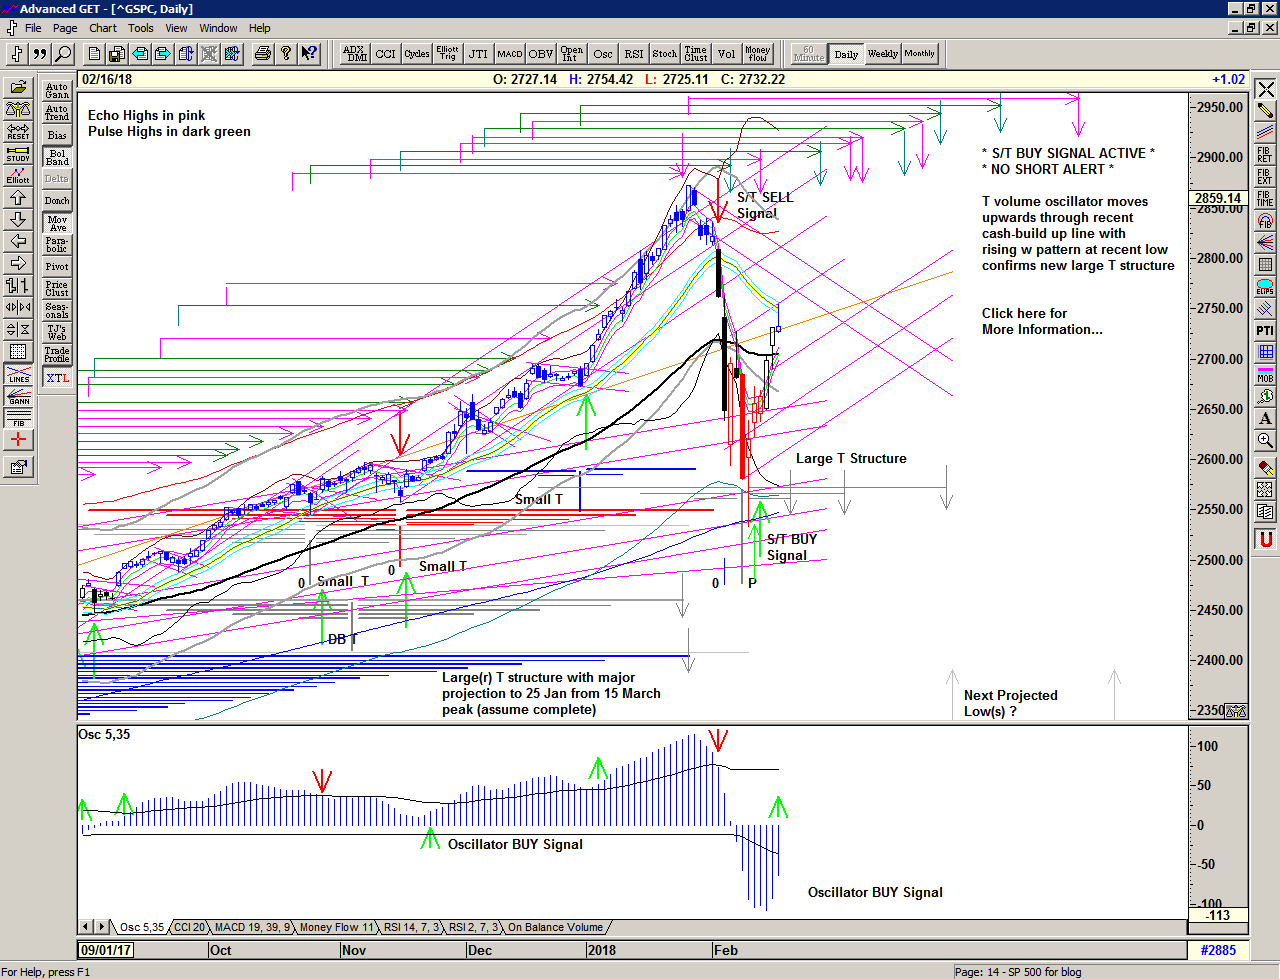
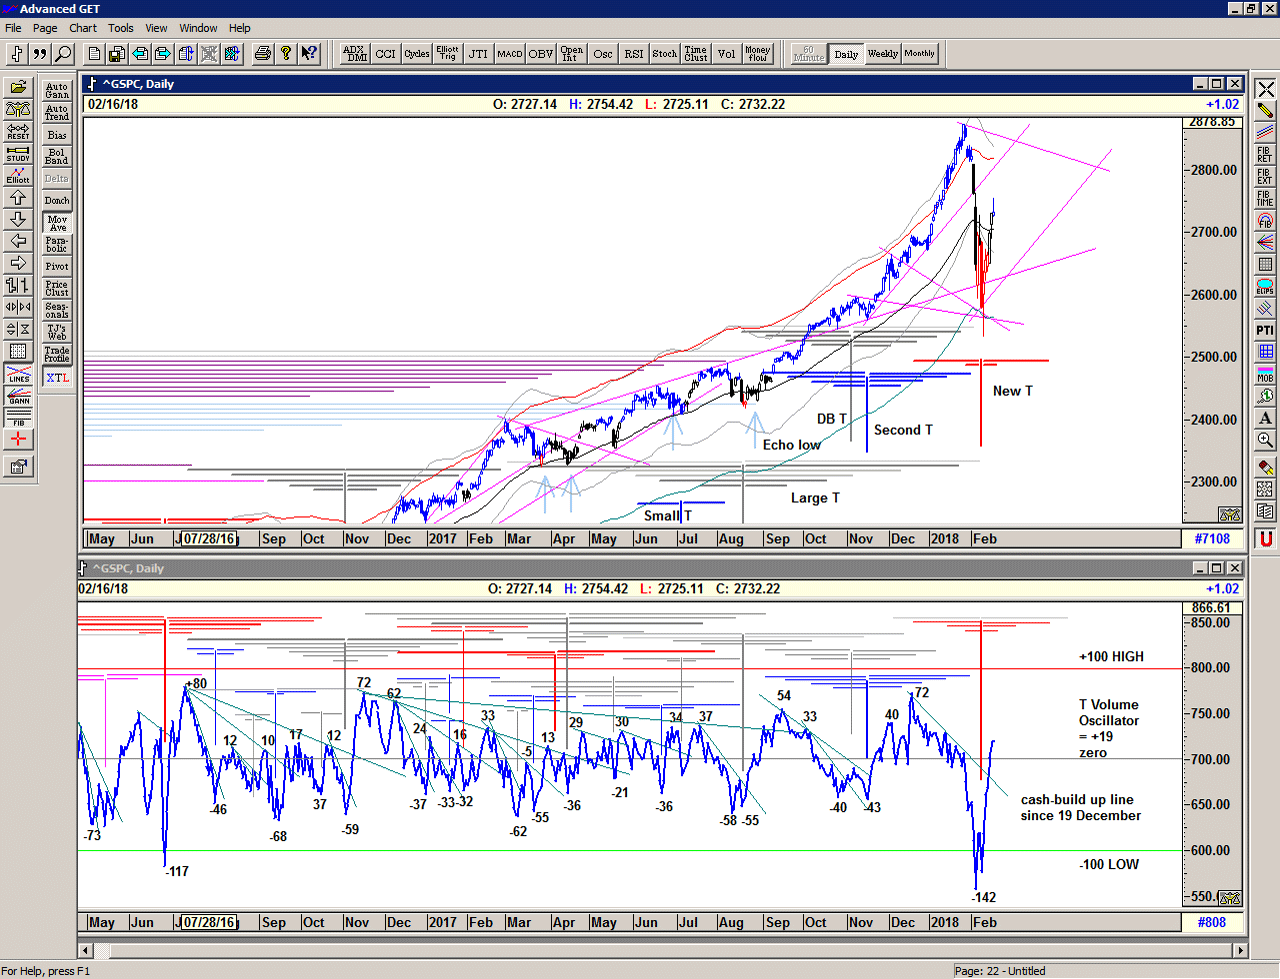
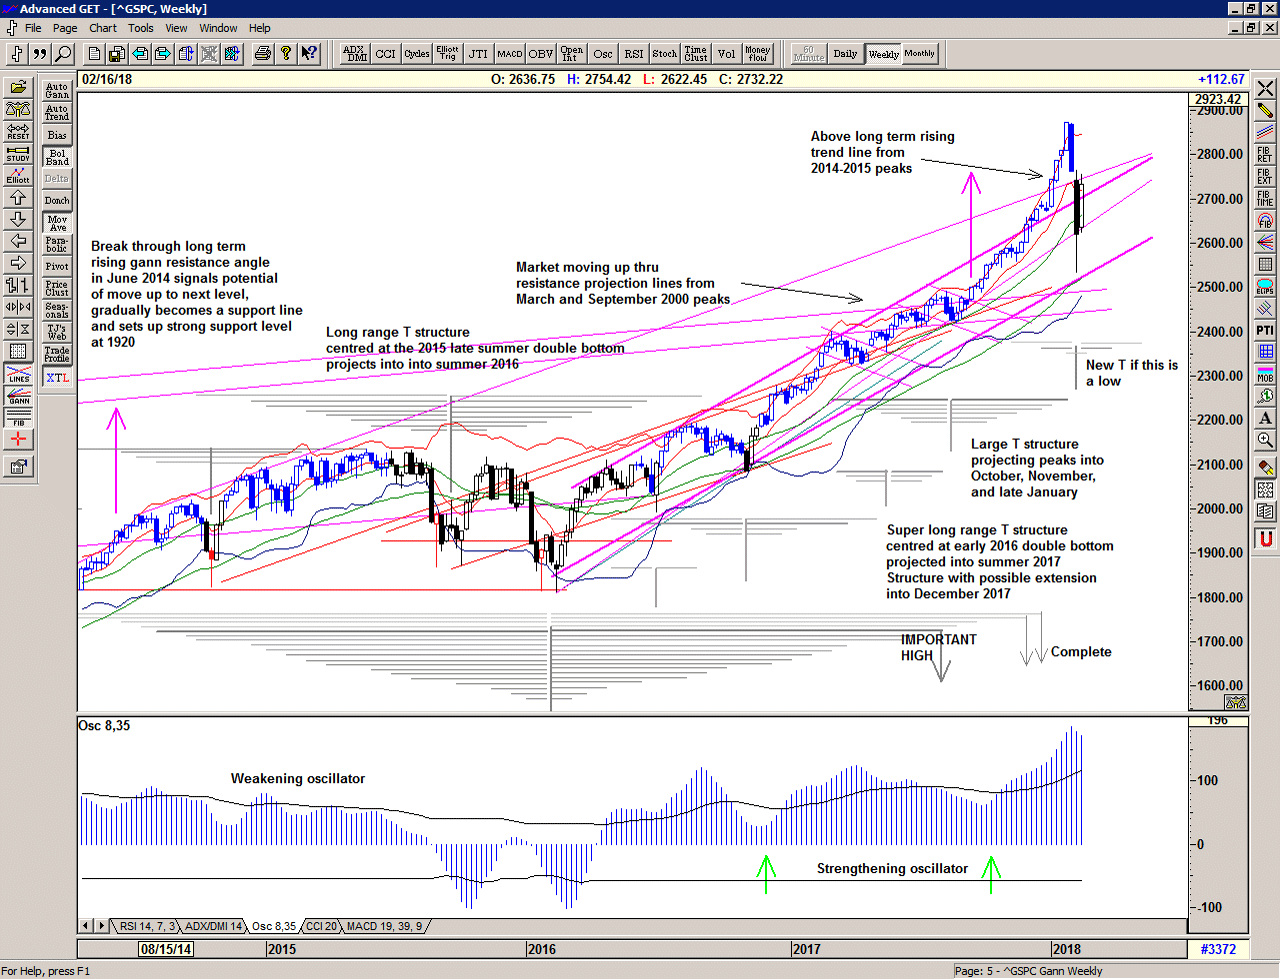
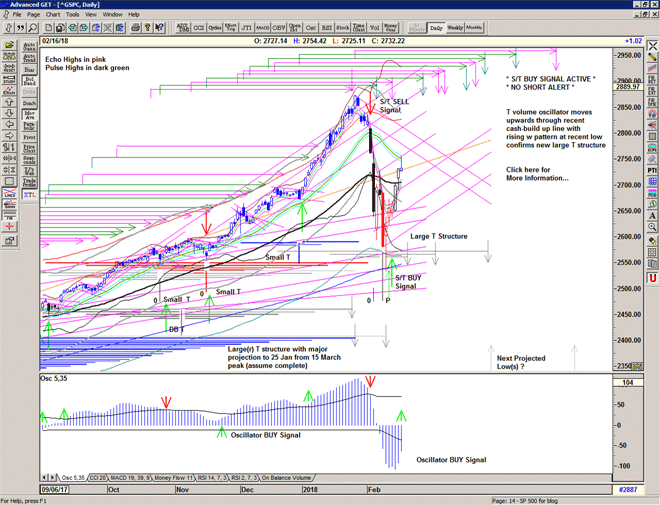
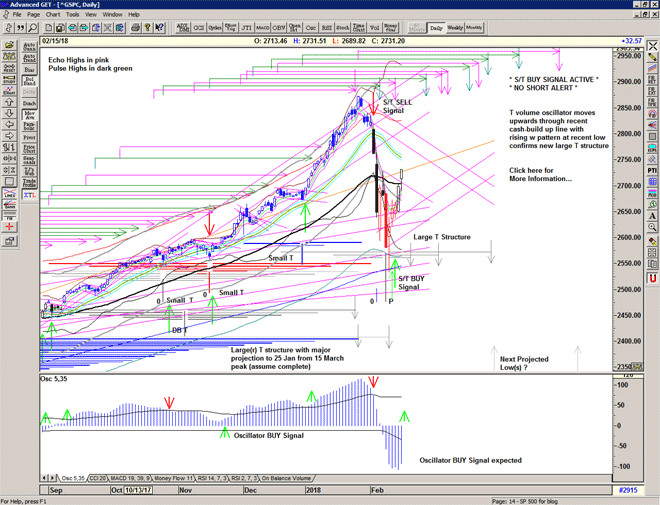
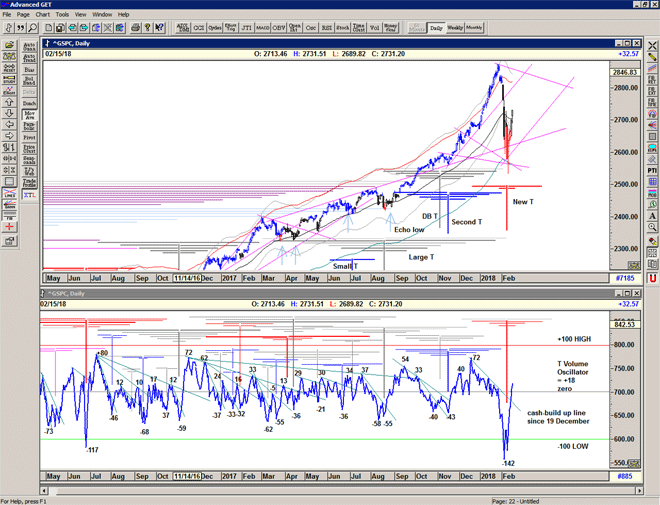
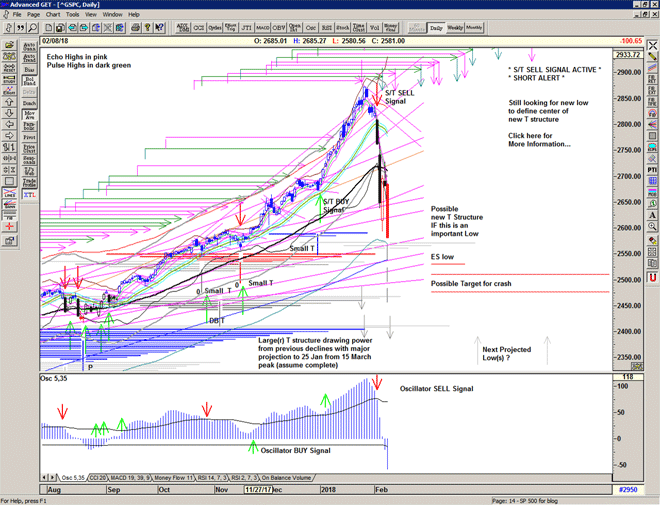
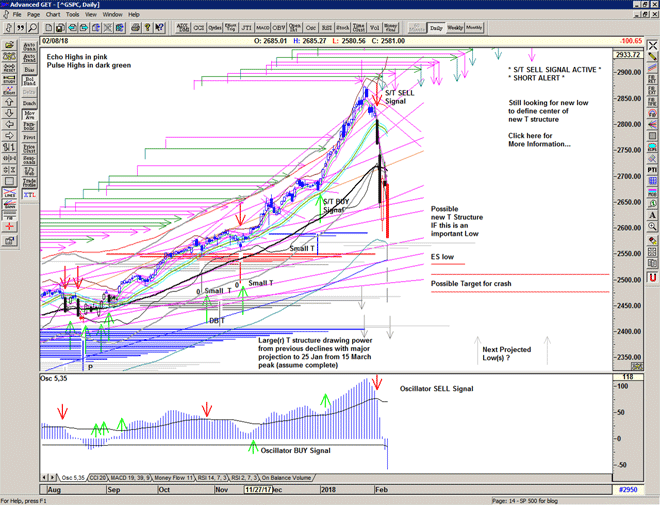
Market continues higher in early trade in an attempt to re-negotiate the 55 ema and the selling continues dragging into the close.

Sell Signal still active.

Chart of S&P 500 for 08 February 2018
 

Be prepared for whatever is coming next, and trade with confidence:

To receive detailed daily analysis, guidance and the updated daily Buy / Sell trigger levels being generated by the Trading the Line system before the market opens, and intraday alerts when appropriate, please become a Member and Sign up for Alerts & Observations – includes access to Members Area and the Explanatory Notes for all of the concepts discussed.

Disclaimer: This is the diary of a personal trading system, its methodology and the signals that it is producing. You are welcome to follow along but please understand that the information presented here is for educational purposes only. No recommendations are being made to buy, or sell stocks, options or futures contracts. Please consult your own financial advisor before making any investment decisions.


On the mountain

After 20 years, you analyze a lot…
You know, remember people, heroism…
Many people come up to me and say, that, had they been there
They surely would have died. But no, it makes no sense…
Because until you're in a situation like that
You have no idea how you'll behave

Fronted by solitude without decadence or a…
Single material thing to prostitute and elevate you to a spiritual plane
Where I felt the presence of God
Now, there's the God they taught me about at school
And there is the God that's hidden…
by what surrounds us in this civilization

That's the God I met on the mountain

Words written by survivor Carlitos Paez and narrated by John Malkovich, for the film, Alive, 1993
Sampled in: Unkle ft Moby, In a State / God Moving Over the Face of the Waters, 2003

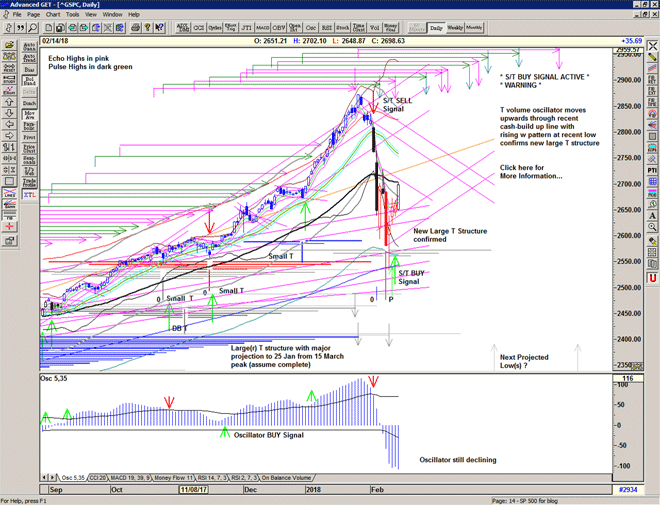
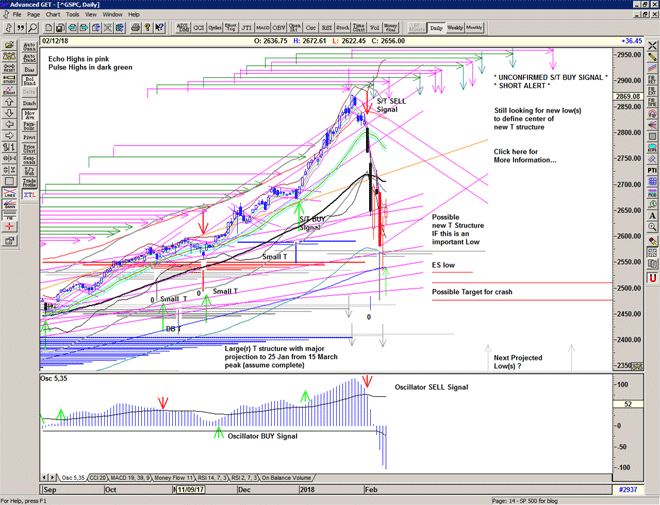
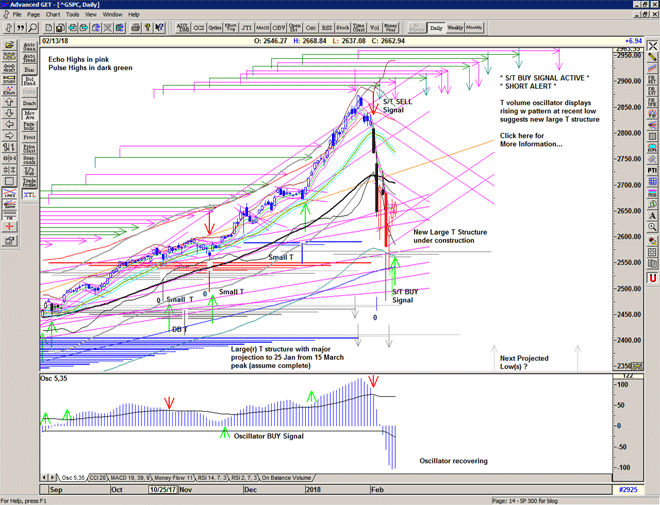
Another significant gap down at the open is bought as the market finds some strong support at 2600 and throughout the day at 2625 until finally pushing higher towards 2700.

This is starting to look like the market may have found a support level.

Still very much a market for ambitious daytraders or those with extremely deep pockets and/or an appetite for risk.

With such large movements the risk still remains very high with a high possibility of re-testing the lows again in due course, sooner or later.

The Sell signal remains valid until the market reaches the Buy Signal level which is still considerably higher.

Dangerous conditions, hedge accordingly.

Chart of S&P 500 for 07 February 2018

Be prepared for whatever is coming next, and trade with confidence:

To receive detailed daily analysis, guidance and the updated daily Buy / Sell trigger levels being generated by the Trading the Line system before the market opens, and intraday alerts when appropriate, please become a Member and Sign up for Alerts & Observations – includes access to Members Area and the Explanatory Notes for all of the concepts discussed.

Disclaimer: This is the diary of a personal trading system, its methodology and the signals that it is producing. You are welcome to follow along but please understand that the information presented here is for educational purposes only. No recommendations are being made to buy, or sell stocks, options or futures contracts. Please consult your own financial advisor before making any investment decisions.


Waterfall

See the steeple pine
The hills as old as time
Soon to be put to the test
To be whipped by the winds of the west

Stands on shifting sands
The scales held in her hands
The wind it just whips her away
And fills up her brigantine sails

She'll carry on through it all
She's a waterfall
She'll carry on through it all

She's a waterfall

The Stone Roses, Waterfall, 1989

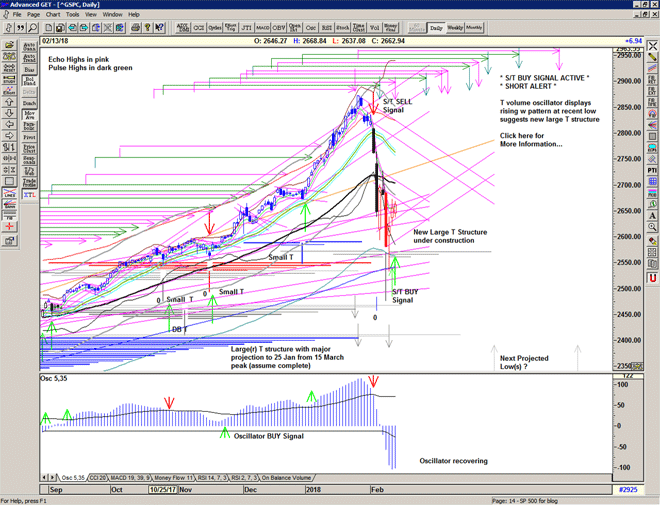
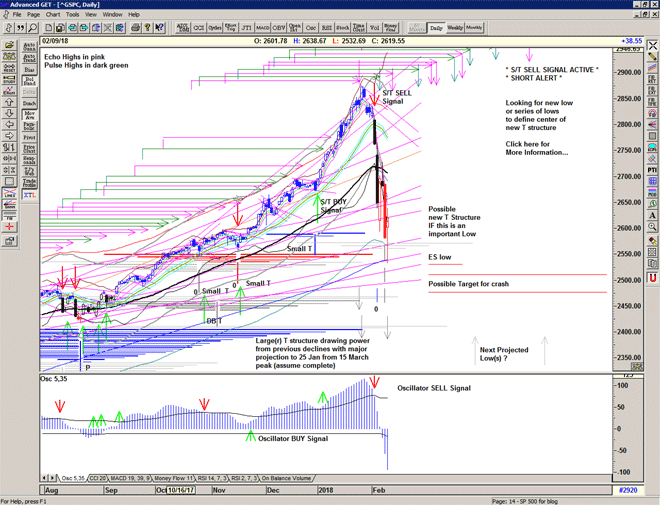
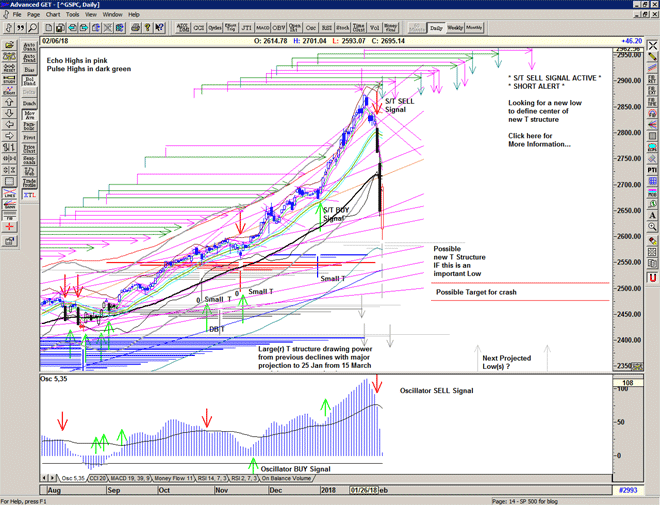
An ugly continuation of the selling from last week. The 20 point gap down open is initially bought and then sold into at breakeven, and the market accelerates lower finding almost no support until slamming into 2650 in late afternoon. A 50 point bounce is then sold into the close.

The market quickly dismissed some important 'support' in the 2715 area and this quickly opened the trap-door for a waterfall decline.

A lot of damage done as the market quickly re-corrects down towards the levels last seen in the Fall. We are now looking at a decline of the order of the August 2015 and January 2016 which leads me to believe that we will see some extensive corrective action ahead as the market adjusts to the collapse from the recent all time high.

The market is now thoroughly 'out of wack' with itself, and the signal levels are way, way above the current price. Dangerous conditions indeed. Hedge all positions carefully and thoroughly, locking in profits incremently.

Chart of S&P 500 for 06 February 2018

 Be prepared for whatever is coming next, and trade with confidence:

To receive detailed daily analysis, guidance and the updated daily Buy / Sell trigger levels being generated by the Trading the Line system before the market opens, and intraday alerts when appropriate, please become a Member and Sign up for Alerts & Observations – includes access to Members Area and the Explanatory Notes for all of the concepts discussed.

Disclaimer: This is the diary of a personal trading system, its methodology and the signals that it is producing. You are welcome to follow along but please understand that the information presented here is for educational purposes only. No recommendations are being made to buy, or sell stocks, options or futures contracts. Please consult your own financial advisor before making any investment decisions.


Hurt

I hurt myself today
To see if I still feel
I focus on the pain
The only thing that's real
The needle tears a hole
The old familiar sting
Try to kill it all away
But I remember everything

What have I become?
My sweetest friend
Everyone I know
Goes away in the end
You could have it all
My empire of dirt
I will let you down
I will make you hurt

Trent Reznor, Hurt, 1995

An excellent cover by Johnny Cash was recorded on his last album, American IV The Man Comes Around, 2002

Welcome to the Trading the Line Free Report.

On Friday 26 January the market gapped higher and rallied to 2872 at (or just after) an important projection for a high from several of the structures, and one day after a scheduled echo high.

On 30 January the market gapped down significantly and below the S/T Buy / Cover Signal line at 2839. Failure to recover on the day confirmed the cover signal.

On Friday 02 February, the market gapped down again with a 20 point drop into the Sell Signal area at 2794, a slight bounce which failed and then the selling really starts dragging the market down, a relentless 60 points.

An S/T Sell signal at 2794.

An OSC Sell Signal at the close.

Chart of S&P 500 for 05 February 2018

Save the image to your desktop to view a larger version

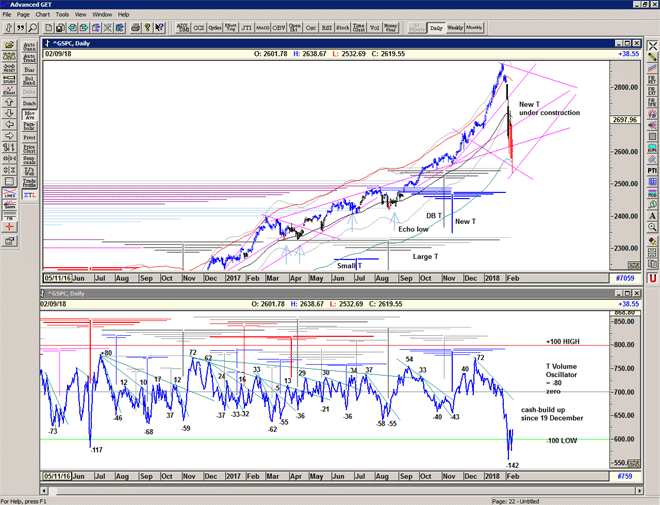
The T volume oscillator has been in decline for several weeks, since 19 December, and is now at a very low level already (-89), and in the area that major lows can occur. The Brexit panic low was -117 for example.

So we are now looking for a low to occur and a strong bounce at some point but I suspect that the market will need a significant amount of stabilising first after this shock.

IF Friday's severe sell-off is an important low (and we do not know that yet, but it might be) then we can draw the possible T structure that could develop out of this low.

The decline of the the T volume oscillator since its recent high on 19 December describes a cash-build up line that represents the fuel that has been building as the market has been taking profits even whilst it has moved higher.

What we are looking for is for the oscillator to rise upwards and ultimately through the declining cash-build up line and this will then define the next T structure with the waves of selling from the oscillator high and from the various price highs, projecting the next series of highs in the market.

Chart of S&P 500 for 05 February 2018

Save the image to your desktop to view a larger version

At the moment the market looks very dangerous and volatile as it seeks for support for the first time since the late summer. As we have already very rapidly moved down to the first level support line (notice the rising line under the previous lows), it may be that momentum will continue to drive lower, perhaps towards the important 55 ema and lower edge of the gray channel.

What does seem likely is that the range of the market will continue to be expansive.

Chart of S&P 500 for 05 February 2018

Save the image to your desktop to view a larger version

On the weekly chart we can see that the market moved beyond the target trend-line from the 2014-15 peaks and now appears to have made an exhaustion point. Perhaps this was just an overshoot and we are now seeing a return to the trend?

In the meantime, the simplicity of my proprietary S/T Signalling System continues to keep us on the correct side of the market, providing an appropriate cover signal and a very necessary red light when necessary.

If you would like to learn more about using the S/T Signalling System please get in touch.

Be prepared for whatever is coming next, and trade with confidence:

To receive detailed daily analysis, guidance and the updated daily Buy / Sell trigger levels being generated by the Trading the Line system before the market opens, and intraday alerts when appropriate, please become a Member and Sign up for Alerts & Observations – includes access to Members Area and the Explanatory Notes for all of the concepts discussed.

Disclaimer: This is the diary of a personal trading system, its methodology and the signals that it is producing. You are welcome to follow along but please understand that the information presented here is for educational purposes only. No recommendations are being made to buy, or sell stocks, options or futures contracts. Please consult your own financial advisor before making any investment decisions.


Thunder

And she turned around and took me by the hand and said,
I've lost control again.
And how I'll never know just why or understand,
She said I've lost control again.

Joy Division, She's Lost Control, 1979
(Bernard Sumner, Ian Curtis, Peter Hook, Stephen Morris)

A 20 point drop into the Sell Signal area, a slight bounce which fails and then the selling really starts.

An S/T Sell signal at 2794.

An OSC Sell Signal.

T volume oscillator at a very low level already (-89), so we are now looking for a low to occur and a strong bounce at some point but the market will need a significant amount of stabilising first after this shock.

Chart of S&P500 for 03 February 2018

Be prepared for whatever is coming next, and trade with confidence:

To receive detailed daily analysis, guidance and the updated daily Buy / Sell trigger levels being generated by the Trading the Line system before the market opens, and intraday alerts when appropriate, please become a Member and Sign up for Alerts & Observations – includes access to Members Area and the Explanatory Notes for all of the concepts discussed.

Disclaimer: This is the diary of a personal trading system, its methodology and the signals that it is producing. You are welcome to follow along but please understand that the information presented here is for educational purposes only. No recommendations are being made to buy, or sell stocks, options or futures contracts. Please consult your own financial advisor before making any investment decisions.


Groundhog

Market stabilising. An attempt towards the Buy Signal line is sold back down to the low of the day, and the momentum is therefore still down.

Declining channel still active.

Chart of S&P500 for 02 February 2018

Be prepared for whatever is coming next, and trade with confidence:

To receive detailed daily analysis, guidance and the updated daily Buy / Sell trigger levels being generated by the Trading the Line system before the market opens, and intraday alerts when appropriate, please become a Member and Sign up for Alerts & Observations – includes access to Members Area and the Explanatory Notes for all of the concepts discussed.

Disclaimer: This is the diary of a personal trading system, its methodology and the signals that it is producing. You are welcome to follow along but please understand that the information presented here is for educational purposes only. No recommendations are being made to buy, or sell stocks, options or futures contracts. Please consult your own financial advisor before making any investment decisions.


Thorn

Onward! And Onward! And Onward I go
Where no man before could be bothered to go
Till the soles of my shoes are shot full of holes
And it's all downhill with a bullet…

Nick Cave & The Bad Seeds, Do You Love Me? (Part 2), 1994

Market continues to stabilise and back away slightly from the recent high, defining a declining channel.

Chart of S&P 500 for 01 February 2018

Be prepared for whatever is coming next, and trade with confidence:

To receive detailed daily analysis, guidance and the updated daily Buy / Sell trigger levels being generated by the Trading the Line system before the market opens, and intraday alerts when appropriate, please become a Member and Sign up for Alerts & Observations – includes access to Members Area and the Explanatory Notes for all of the concepts discussed.

Disclaimer: This is the diary of a personal trading system, its methodology and the signals that it is producing. You are welcome to follow along but please understand that the information presented here is for educational purposes only. No recommendations are being made to buy, or sell stocks, options or futures contracts. Please consult your own financial advisor before making any investment decisions.

Marianne

Now so long, Marianne
It's time that we began to laugh
And cry and cry and laugh about it all again

Well, you know that I love to live with you
But you make me forget so very much
I forget to pray for the angels
And then the angels forget to pray for us

Leonard Cohen, So Long, Marianne, 1967

A gap down below the cover signal level without any significant recovery, suggesting that the market needs some further stabilisation.

Zooming out you can see that the recent peak synchronised with the projection for a high from the 15 March peak, reinforced by similar projections from the smaller more recent structures.

There is the possibility for another high associated with the earlier peak on 01 March – another attempt at a high perhaps?

We are now looking for some kind of low to occur. The T volume oscillator has been in decline and forming a cash-build up line since the 18 December high and is already at a level associated with lows (-55) though of course it can go much lower. This is the fuel for the next advance. Look for stabilisation in the oscillator and then a move upwards through the cash-build up line to initiate the next T structure.

Chart of S&P 500 for 31 January 2018

Be prepared for whatever is coming next, and trade with confidence:

To receive detailed daily analysis, guidance and the updated daily Buy / Sell trigger levels being generated by the Trading the Line system before the market opens, and intraday alerts when appropriate, please become a Member and Sign up for Alerts & Observations – includes access to Members Area and the Explanatory Notes for all of the concepts discussed.

Disclaimer: This is the diary of a personal trading system, its methodology and the signals that it is producing. You are welcome to follow along but please understand that the information presented here is for educational purposes only. No recommendations are being made to buy, or sell stocks, options or futures contracts. Please consult your own financial advisor before making any investment decisions.


Alive

Oil dripping on my head
Let's go back to bed
Bring you back
Bring you back
From the dead
From the dead
Wishing you were here by me
Wishing you were here
Let's massage history
All the money's gone
Funny it was never here
It was never here
Here's a song
Here's a song
To massage along
History along
Come with me
To the other side
Not everyone makes it out alive
Come with me
To the other side not everyone makes it out
Alive

Sonic Youth, Massage the History, 2009

Price proves to be unsustainable above the gray channel (again).

The T volume oscillator drops significantly, showing the strength of the profit-taking yesterday and suggesting that the market does need some consolidation after such a powerful start to the year.

Watch for declining resistance at the high to confirm whether the move is complete, or not, as the averages catch up with price.

Chart of S&P 500 for 30 January 2018

Be prepared for whatever is coming next, and trade with confidence:

To receive detailed daily analysis, guidance and the updated daily Buy / Sell trigger levels being generated by the Trading the Line system before the market opens, and intraday alerts when appropriate, please become a Member and Sign up for Alerts & Observations – includes access to Members Area and the Explanatory Notes for all of the concepts discussed.

Disclaimer: This is the diary of a personal trading system, its methodology and the signals that it is producing. You are welcome to follow along but please understand that the information presented here is for educational purposes only. No recommendations are being made to buy, or sell stocks, options or futures contracts. Please consult your own financial advisor before making any investment decisions.


Fly Me Away

Fly me away on an aeroplane
High in the sky
Wanna see you again
Wanna know this time

Gonna tell you what I'm feeling
Gonna know this time
Gonna get it back, that feeling

Miles and miles of sun
Endless roads, twist on
Don't wanna live a life
In a world that's all the same
The crazy little things
That you do are magical

This crazy life
This crazy world
We're living in is
Magical

Goldfrapp, Fly Me Away, 2005. Songwriters: Alison Elizabeth Goldfrapp / William Owen Gregory

Market gaps up and beyond the possible declining angle at the mid week high, and closes with yet another major high, in-line with the Large(r) T structure, as the market continues to show no signs of letting up on the parabolic move.

T volume oscillator turns back above zero.

Chart of S&P 500 for 29 January 2018

Be prepared for whatever is coming next, and trade with confidence:

To receive detailed daily analysis, guidance and the updated daily Buy / Sell trigger levels being generated by the Trading the Line system before the market opens, and intraday alerts when appropriate, please become a Member and Sign up for Alerts & Observations – includes access to Members Area and the Explanatory Notes for all of the concepts discussed.

Disclaimer: This is the diary of a personal trading system, its methodology and the signals that it is producing. You are welcome to follow along but please understand that the information presented here is for educational purposes only. No recommendations are being made to buy, or sell stocks, options or futures contracts. Please consult your own financial advisor before making any investment decisions.